 Open Access Article
A novel in situ N2 generation system assisted by authigenic acid for formation energy enhancement in an oilfield†
Cheng Qian abc,
Yefei Wang*abc,
Zhen Yang
 abc,
Zhengtian Quabc,
Mingchen Dingabc,
Wuhua Chenabc and
Zhenpei Heabc
aKey Laboratory of Unconventional Oil & Gas Development, China University of Petroleum (East China), Ministry of Education, Qingdao, Shandong 266580, P. R. China. E-mail: wangyf@upc.edu.cn
bShandong Key Laboratory of Oilfield Chemistry, School of Petroleum Engineering, China University of Petroleum (East China), Qingdao, Shandong 266580, P. R. China
cSchool of Petroleum Engineering, China University of Petroleum (East China), Qingdao, Shandong 266580, P. R. China
First published on 2nd December 2019
Abstract
The in situ N2 generation technique is a promising method for enhancing oil recovery (EOR) and blockage removal. Conventionally, N2 is generated through the redox reactions of sodium nitrite (NaNO2) and ammonium chloride (NH4Cl). The effect of several parameters on N2 production was studied in this work. The reaction kinetics between NaNO2 and NH4Cl were developed. The results revealed that the optimal molar ratio was 1![[thin space (1/6-em)]](https://www.rsc.org/images/entities/char_2009.gif) :
:![[thin space (1/6-em)]](https://www.rsc.org/images/entities/char_2009.gif) 1 for the reactants and a higher concentration of reactants, H+ and higher temperature would lead to an increase in the gas production volume and a better gas-generating efficiency. The kinetic equation of the N2 generation reaction was defined as dc/dt = −7.103 × 10⁷ cH+1.3291c02.0949e(−51.28 kJ mol−1)/RT. Methyl formate, ethyl formate, ammonium persulphate as well as paraformaldehyde were selected as authigenic acids by measuring their pH values and their effect on the rate of gas-generation, and the gas production volume was studied. An energy enhancement experiment was conducted to examine the influence of reactant concentration, initial pressure and different authigenic acids on energy enhancement and gas-generating efficiency. The results showed that the increase in reactant concentration can improve the energy enhancement while neither the reactant concentration nor the initial pressure could hardly influence the gas-generating efficiency. The presence of authigenic acids can considerably enhance both the gas production volume and the gas-generating efficiency of the system. The ammonium persulphate assisted N2 generation system is considered to be suitable for field applications.
1 for the reactants and a higher concentration of reactants, H+ and higher temperature would lead to an increase in the gas production volume and a better gas-generating efficiency. The kinetic equation of the N2 generation reaction was defined as dc/dt = −7.103 × 10⁷ cH+1.3291c02.0949e(−51.28 kJ mol−1)/RT. Methyl formate, ethyl formate, ammonium persulphate as well as paraformaldehyde were selected as authigenic acids by measuring their pH values and their effect on the rate of gas-generation, and the gas production volume was studied. An energy enhancement experiment was conducted to examine the influence of reactant concentration, initial pressure and different authigenic acids on energy enhancement and gas-generating efficiency. The results showed that the increase in reactant concentration can improve the energy enhancement while neither the reactant concentration nor the initial pressure could hardly influence the gas-generating efficiency. The presence of authigenic acids can considerably enhance both the gas production volume and the gas-generating efficiency of the system. The ammonium persulphate assisted N2 generation system is considered to be suitable for field applications.
1. Introduction
In situ gas generation technology has been an increasingly effective method to enhance oil recovery1 and to reform the formation.2,3 The commonly used in situ gas generation systems can generally be divided into two types: in situ CO2 generation system4 and in situ N2 generation system.5 The most widely used in situ N2 generation system consists of sodium nitrite (NaNO2) and ammonium chloride (NH4Cl),6 which has been applied in reducing the viscosity of paraffin-rich crude oil,7 improving the matrix acidizing,8 the removal of hydrate plug under subsea9 and enhancing the formation energy10 due to the remarkable generation of gas and heat. This highly exothermic chemical reaction is represented as:| NaNO2 + NH4Cl → N2↑ + NaCl + 2H2O ΔH = −332.58 kJ mol−1 |
An in situ N2 generation system was first proposed by the Shell company11,12 to replace the vaporized liquified nitrogen, which required a convenient source of liquid nitrogen and suitable high-pressure equipment. Considering the remarkable thermal performance, this system has been an effective alternative method towards steam and hot oil treatments to stimulate the production from paraffin plugged wells in California and Wyoming.13 Dom Joao field in Brazil adopted a new method called SGN/EMULSAO to stimulate the wells and the water/oil emulsified system could extend the reaction time and increase the radius of influence.14 Another application of the in situ N2 generation system was to promote the effect of the acidizing operation by heating the acid fluid.8 With the development of marine oil and gas, the in situ N2 generation system was applied in the removal of hydrate and paraffin blockages by heating subsea production pipes because low temperature was considered as the major element in the organic solid deposition.15 Recently, in situ steam generation assisted with the N2 release reaction between NaNO2 and NH4Cl was introduced for heavy oil production by mobilizing the low API crude oil.16 For an oilfield with low permeability as well as low formation energy, NaNO2/NH4Cl system was also used to enhance the formation energy to successfully boost the oil production, e.g. in Jianghan oilfield.17
In the N2 generation system, H+ was found to have a key effect on the reaction rate, reaction degree and the thermal effect of the system.18 In order to acquire a better performance of the in situ N2 generation system, some additives such as hydrochloric acid and citric acid were used to boost the reaction in order to get a much higher temperature and more gas volume. Singh et al.19 and Nguyen et al.20 treated the NaNO2/NH4Cl system as a fused chemical reaction by adding acid-filled capsules, which could release citric acid slowly. Apart from that, some chemicals, like methyl formate and tetrachloroethane,21,22 which can generate H+ at certain conditions were also used widely to strengthen the system. Nevertheless, some drawbacks accompanied with uncontrolled H+ led to an intensive reaction rate and side reactions, which resulted in by-products (e.g. NO and NO2).23 In order to make the best use of the catalytic H+, the concentration boundary of H+ for promoting the main reaction has to be determined accurately. Dusenbury et al.24 reported that the NaNO2/NH4Cl system would not generate NOx at pH = 1–6 according to their study on the kinetics and the mechanism. Wu Wengang et al.25 suggested that the in situ N2 generation system can generate N2 at room temperature without NOx at pH = 3. Besides, Nguyen et al.26 focused on the functions of H+, temperature and reactants in the reaction of the NH4+/NO2− system and presented the predicted kinetics equation at pH = 3–5. The reported ranges of pH were quite inconsistent, which would confuse readers. Thus, a worker cannot choose the appropriate acid or the latent acid in the application of the in situ N2 generation system. This study was carried out to figure out the effect of each parameter on the gas production volume and to form an efficient authigenic acid assisted N2 generation system.
In this work, the effect of several reaction parameters (concentration of reactants, H+ and the temperature) on the N2-producing ability of the NaNO2/NH4Cl mixture was studied. Meanwhile, the kinetics study was also conducted. Four chemicals that served as authigenic acids were investigated through pH measurements and their capacity of assisting the in situ N2 generation system was examined by an energy enhancement test. A novel ammonium persulphate assisted N2 generation system that can be used for energy enhancement in an oilfield was proposed.
2. Materials and methods
2.1. Chemicals
Chemicals used in this study include, sodium nitrite (NaNO2), ammonium chloride (NH4Cl), hydrogen chloride (HCl), methyl acetate (MA), ethyl acetate (EA), paraformaldehyde (PFA) and ammonium persulphate (APS); the above chemicals were analytical reagents and purchased from Sinopharm Chemical Reagent Co., Ltd. Methyl formate (MF) and ethyl formate (EF) were chemically pure and purchased from Sinopharm Chemical Reagent Co., Ltd, and sodium chloroacetate (SC) of analytical reagent was purchased from Aladdin, Shanghai, China. Distilled water was used for dissolving the above compounds.2.2. Experiments
Several authigenic acids were selected through the pH measurement to form new N2 generation systems. Then, the capability of the systems with authigenic acids to generate gas was investigated through gas-producing experiments.
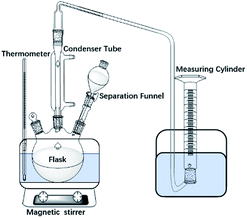
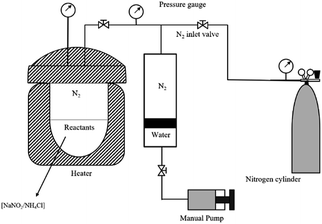
The detailed procedure is as follow: (1) reactant solution (volume: 150 mL) was injected into the reactor (volume: 300 mL) at 20 °C; (2) the pressure of the reactor was adjusted to the targeted pressure by injecting N2; (3) the reactor's temperature was increased to 100 °C and heated for 4 h while magnetically stirring at 300 rpm. Afterwards, the system was cooled naturally to 25 °C. Temperature and pressure of the experiment were recorded continuously.
3. Results and discussion
3.1. Evaluation of the gas-producing reaction
![[thin space (1/6-em)]](https://www.rsc.org/images/entities/char_2009.gif) :
:![[thin space (1/6-em)]](https://www.rsc.org/images/entities/char_2009.gif) 1.5, 2.0
1.5, 2.0![[thin space (1/6-em)]](https://www.rsc.org/images/entities/char_2009.gif) :
:![[thin space (1/6-em)]](https://www.rsc.org/images/entities/char_2009.gif) 1.0, 1.0
1.0, 1.0![[thin space (1/6-em)]](https://www.rsc.org/images/entities/char_2009.gif) :
:![[thin space (1/6-em)]](https://www.rsc.org/images/entities/char_2009.gif) 2.0, 1.0
2.0, 1.0![[thin space (1/6-em)]](https://www.rsc.org/images/entities/char_2009.gif) :
:![[thin space (1/6-em)]](https://www.rsc.org/images/entities/char_2009.gif) 1.5, 1.5
1.5, 1.5![[thin space (1/6-em)]](https://www.rsc.org/images/entities/char_2009.gif) :
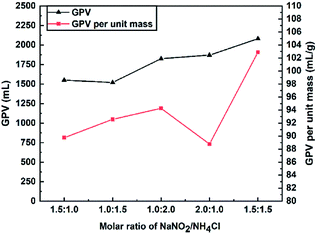
:![[thin space (1/6-em)]](https://www.rsc.org/images/entities/char_2009.gif) 1.0) on the GPV in the presence of 0.0178 M HCl at 30 °C is shown in Fig. 3. As the total concentration of the reactants increased from 2.5 M to 3 M, the GPV rose from 1550 mL to 1870 mL. Under the circumstances of the same total concentration of 3.0 M (NaNO2/NH4Cl = 1.5
1.0) on the GPV in the presence of 0.0178 M HCl at 30 °C is shown in Fig. 3. As the total concentration of the reactants increased from 2.5 M to 3 M, the GPV rose from 1550 mL to 1870 mL. Under the circumstances of the same total concentration of 3.0 M (NaNO2/NH4Cl = 1.5![[thin space (1/6-em)]](https://www.rsc.org/images/entities/char_2009.gif) :
:![[thin space (1/6-em)]](https://www.rsc.org/images/entities/char_2009.gif) 1.5, 2.0
1.5, 2.0![[thin space (1/6-em)]](https://www.rsc.org/images/entities/char_2009.gif) :
:![[thin space (1/6-em)]](https://www.rsc.org/images/entities/char_2009.gif) 1.0, 1.0
1.0, 1.0![[thin space (1/6-em)]](https://www.rsc.org/images/entities/char_2009.gif) :
:![[thin space (1/6-em)]](https://www.rsc.org/images/entities/char_2009.gif) 2.0), the tested group whose molar ratio of reactants was 1.5
2.0), the tested group whose molar ratio of reactants was 1.5![[thin space (1/6-em)]](https://www.rsc.org/images/entities/char_2009.gif) :
:![[thin space (1/6-em)]](https://www.rsc.org/images/entities/char_2009.gif) 1.5 had a maximum GPV compared to other groups (NaNO2/NH4Cl = 2.0
1.5 had a maximum GPV compared to other groups (NaNO2/NH4Cl = 2.0![[thin space (1/6-em)]](https://www.rsc.org/images/entities/char_2009.gif) :
:![[thin space (1/6-em)]](https://www.rsc.org/images/entities/char_2009.gif) 1.0, 1.0
1.0, 1.0![[thin space (1/6-em)]](https://www.rsc.org/images/entities/char_2009.gif) :
:![[thin space (1/6-em)]](https://www.rsc.org/images/entities/char_2009.gif) 2.0). Also, the maximum GPV per unit mass was found at a molar ratio of 1
2.0). Also, the maximum GPV per unit mass was found at a molar ratio of 1![[thin space (1/6-em)]](https://www.rsc.org/images/entities/char_2009.gif) :
:![[thin space (1/6-em)]](https://www.rsc.org/images/entities/char_2009.gif) 1. This means the reaction had better performance to generate gas when the molar ratio of NaNO2 and NH4Cl was 1
1. This means the reaction had better performance to generate gas when the molar ratio of NaNO2 and NH4Cl was 1![[thin space (1/6-em)]](https://www.rsc.org/images/entities/char_2009.gif) :
:![[thin space (1/6-em)]](https://www.rsc.org/images/entities/char_2009.gif) 1. Therefore, the optimal molar ratio of reactants was 1
1. Therefore, the optimal molar ratio of reactants was 1![[thin space (1/6-em)]](https://www.rsc.org/images/entities/char_2009.gif) :
:![[thin space (1/6-em)]](https://www.rsc.org/images/entities/char_2009.gif) 1 and this molar ratio was applied in the following experiments.
1 and this molar ratio was applied in the following experiments.
 | (1) |
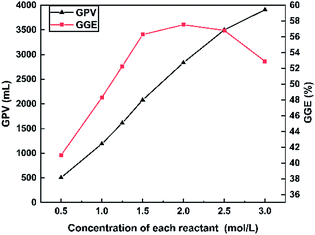
The effect of the reactant concentration (0.5–3.0 M for each reactant) on the total GPV at 30 °C is shown in Fig. 4. As the concentration of each reactant was increased from 0.5 to 3.0 M, the GPV soared from 505 to 3910 mL. This is because the concentration of NO2− and NH4+ increased with the increase in the reactant concentration, leading to a rapid increase in the GPV. Meanwhile, GGE generally went up from 40.99 to 56.82% as the concentration of the NaNO2/NH4Cl system was increased from 0.5 to 2.5 M. However, a slight decrease of GGE at 3.0 M (from 56.82% to 52.90%) was observed. The GGE seems to remain at around 55% once the reactant concentration is over 1.5 M. As a result, 1.5 M was recognized as the appropriate concentration for each reactant in the following experiments.
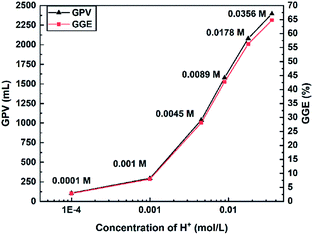
Nguyen et al.26 found that the activation energy of the reaction does not change when the c(H+) is varied by two orders of magnitude and they thought that H+ would affect the concentration of the reactants by influencing the rate-limiting step. Due to the presence of NO2−, which could combine with H+ to form an unstable substance (HNO2), the reaction is prone to produce by-products, such as NO and NO2, which are harmful for the workers and the environment. According to the results of the experiment, when the c(H+) reaches 0.0356 M, a reddish brown gas (NOx) could be observed. Therefore, the concentration of H+ was set at 0.0178 M in the following experiments.
The kinetic equation of the reaction between NaNO2 and NH4Cl can be expressed as eqn (2).
 | (2) |
According to the previous experiments, the concentration of H+ had a significant impact on the reaction rate and GPV, but the effect of H+ is not reflected in eqn (2). Nguyen et al.26 have reported the effect of H+ based on eqn (2) and the kinetic equation was shown as follow:
 | (3) |
Wu Anming et al.27 considered that the reaction rate constant (KT) of the same reaction increased with the rise of the concentration of H+ and established the reaction kinetic equation as:
 | (4) |
According to the reported results, the kinetic equation could be expressed as follows:
 | (5) |
The concentration variation of the two reactants was transformed into the volume of produced gas in this study. c0 (the initial concentration of reactants) was used to indicate cNaNO2 and cNH4Cl due to the same concentration of the two reactants in the experiments. Eqn (5) can be transformed as eqn (6).
 | (6) |
Transposing and integrating eqn (6) gives:
 | (7) |
Taking logarithm of eqn (6) and the result is shown as eqn (8):
 | (8a) |
 | (8b) |
The unknown parameters in eqn (6) are A, m, n, and ΔE and these parameters can be obtained through eqn 8(a) and (b) and the results of the gas-producing reaction test. A linear relationship could be found between ln![[thin space (1/6-em)]](https://www.rsc.org/images/entities/char_2009.gif) t and 1/T when k, c0, cH+were the same and the slope was ΔE/R. The same linear relationship could also be found between ln
t and 1/T when k, c0, cH+were the same and the slope was ΔE/R. The same linear relationship could also be found between ln![[thin space (1/6-em)]](https://www.rsc.org/images/entities/char_2009.gif) t and −ln
t and −ln![[thin space (1/6-em)]](https://www.rsc.org/images/entities/char_2009.gif) cH+ or ln
cH+ or ln![[thin space (1/6-em)]](https://www.rsc.org/images/entities/char_2009.gif) c0.
c0.
The time that the reaction generated a certain gas volume (500, 750, 1000, 1250 mL) was recorded at various temperatures (303–333 K) with the presence of 1.5 M of each reactant and 0.0178 M H+. As shown in eqn (8a), when the C0, CH+ and the ratio k were all same, a linear relationship could be observed between ln![[thin space (1/6-em)]](https://www.rsc.org/images/entities/char_2009.gif) t and 1/T and the line slope was ΔE/R. The same k meant same GPV because of the same C0. The linear relationship between ln
t and 1/T and the line slope was ΔE/R. The same k meant same GPV because of the same C0. The linear relationship between ln![[thin space (1/6-em)]](https://www.rsc.org/images/entities/char_2009.gif) t and 1/T is shown in Fig. S1.† According to the average slope of four lines and the equation slope = ΔE/R, the calculated apparent Arrhenius activation energy is 51.28 kJ mol−1.
t and 1/T is shown in Fig. S1.† According to the average slope of four lines and the equation slope = ΔE/R, the calculated apparent Arrhenius activation energy is 51.28 kJ mol−1.
The time that the reaction generated a certain gas volume (500, 750, 1000 mL) was recorded under various CH+ (0.00445, 0.0089, 0.0178, 0.0356 M) with the presence of 1.5 M of each reactant at 303 K. As shown in eqn (8b), when the C0, T and the ratio k were all same, a linear relationship could be observed between lg![[thin space (1/6-em)]](https://www.rsc.org/images/entities/char_2009.gif) t and (−lg
t and (−lg![[thin space (1/6-em)]](https://www.rsc.org/images/entities/char_2009.gif) CH+) and the line slope was the order of H+ (m). The linear relationship between lg
CH+) and the line slope was the order of H+ (m). The linear relationship between lg![[thin space (1/6-em)]](https://www.rsc.org/images/entities/char_2009.gif) t and (−lg
t and (−lg![[thin space (1/6-em)]](https://www.rsc.org/images/entities/char_2009.gif) CH+) is shown in Fig. S2† and the order of H+ (m) is 1.3291.
CH+) is shown in Fig. S2† and the order of H+ (m) is 1.3291.
The time that the reaction generated a certain gas volume (k = 1.1386, 1.2546, 1.3219) was recorded under various reactant concentrations (1.0, 1.25, 1.5, 2.0 M) in the presence of 0.0178 M H+ at 303 K. As shown in eqn (8b), when the CH+, K and the ratio k were all same, a linear relationship could be observed between lg![[thin space (1/6-em)]](https://www.rsc.org/images/entities/char_2009.gif) t and lg
t and lg![[thin space (1/6-em)]](https://www.rsc.org/images/entities/char_2009.gif) C0 and the line slope was the order of reactants (n). According to the average slope of the three lines in Fig. S3,† the order of reactants (n) is 2.0949.
C0 and the line slope was the order of reactants (n). According to the average slope of the three lines in Fig. S3,† the order of reactants (n) is 2.0949.
 | ||
| Fig. 7 pH values of methyl formate (a.MF), ethyl formate (b.EF), methyl acetate (d.MA) and ethyl acetate (c.EA) vs. time at 70 °C. | ||
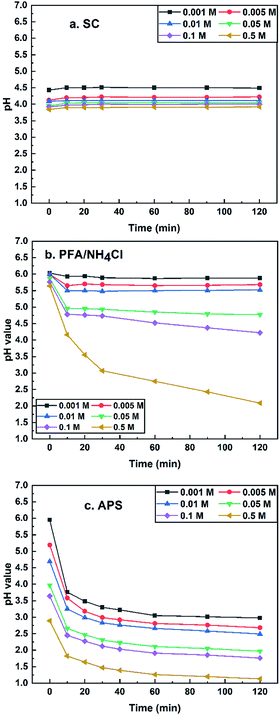 | ||
| Fig. 8 pH values of sodium chloroacetate (a: SC), paraformaldehyde/ammonium chloride (b: PFA/NH4Cl) and ammonium persulphate (c: APS) vs. time at 70 °C. | ||
On the basis of the intercepts of linear relationship in Fig. S1–S3,† the frequency factor A can be calculated as the average value of eqn (9a)–(9c) and the frequency factor A is 7.103 × 10⁷.
 | (9a) |
 | (9b) |
 | (9c) |
The resulting values of the undetermined kinetic parameters are listed in Table S1† and the kinetic equation of the reaction between NaNO2 and NH4Cl under experimental conditions is as follows:
 | (10) |
3.2. Acidic characteristic of authigenic acids
According to the results of Section 3.1, the reaction between NaNO2 and NH4Cl could benefit from the presence of H+. However, it is unpractical to use HCl as a source of H+ in field applications because the strong electrolyte could generate H+ immediately and thus lead to a rapid generation of N2. The chemicals known as ‘authigenic acids’ would hardly generate H+ at room temperature but release H+ at high temperature, and thus authigenic acids can boost the system only at high temperatures. Meanwhile, the pH range for selecting the potential acids should be determined. Wu Wengang et al.25 suggested that NOx would not be formed by the NaNO2/NH4Cl system when the pH is controlled at around 3 (c(H+) = 0.001 M). On the basis of previous experiments in Section 3.1, a much better gas production performance could be achieved without the generation of NOx at a c(H+) range of 0.0045–0.0178 M. Therefore, the pH boundary for selecting authigenic acids is about 2–4 in this paper. The esters and salts are the two main kinds of authigenic acids used in the acidic characteristic experiments.| RCOOR′ + H2O → RCOOH + R′OH |
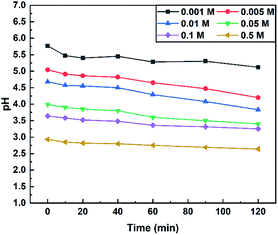
A concentration range of 0.001–0.5 M was used to study the esters' potential acidic characteristic at 70 °C and the results of the experiment are displayed in Fig. 7. The pH values of the four ester solutions tended to decline with the increase of concentration and duration time. MA and EA whose pH values did not reach 4 under experimental conditions were not suitable for being authigenic acids in the N2 generation system. For MF and EF, a concentration range of 0.01–0.1 M could cover the requirements mentioned above.
| ClCH2COO− + H2O → HOCH2COOH + Cl− |
PFA is a linear polymer of formaldehyde that is soluble in hot water and gets decomposed by releasing formaldehyde (CH2O). CH2O and NH4Cl would react to form HCl and hexamethylenetetramine under certain conditions as the following reaction equation:30,31
| 4NH4Cl + 6CH2O → N4(CH2)6 + 4HCl + 6H2O |
APS is an unstable substance whose aqueous solution can get decomposed to generate sulfuric acid when heated. The reaction equation is as follows:32
| 2(NH4)2S2O8 + 2H2O → 2(NH4)2SO4 + 2H2SO4 + O2 |
The acidic characteristics of the three salts are shown in Fig. 8. The pH values of the three salt solutions (0.001–0.5 M) decreased with the rise of the concentration of salts and the pH value of SC remained essentially unchanged during the experiment. The PFA/NH4Cl and APS aqueous solutions had a downward trend with the increase of the measuring time. It is worth noting that the pH of the APS aqueous solution had a sharp drop at all tested concentrations but the pH of the PFA/NH4Cl mixture only declined considerably at higher concentrations, such as 0.05 M. It can be summarized that PFA/NH4Cl (0.1–0.5 M) and AP (0.001–0.01 M) can meet the requirements mentioned above.
Another pH test of APS at 30 °C was performed to estimate its stability at room temperature due to the sharp pH drop at 70 °C. If the pH value of APS solution at 30 °C declines as fast as that of 70 °C, this salt will not be the authigenic acid searched. As shown in Fig. 9, the pH value decreased slightly with the increasing measuring time, which suggested the good thermal stability of APS.
In conclusion, methyl formate (MF), ethyl formate (EF), paraformaldehyde (PFA) and ammonium persulphate (APS) can cover the requirements of authigenic acids. Therefore, MF, EF, PFA and APS were chosen as authigenic acids in the following gas-producing tests.
3.3. Gas-producing tests with authigenic acids
3.4. Energy enhancement examination
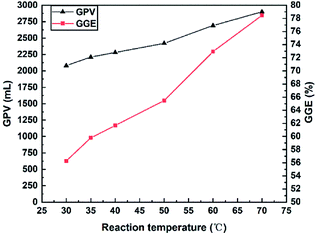
According to the results of the gas-producing tests, an in situ N2 generation system with a higher concentration of reactants, H+ and a higher temperature could promote the GPV. However, the ability of this system to increase the pressure and temperature is still needed to be estimated by energy enhancement experiments in a constant volume reactor. Energy-enhancing means the increase of pressure and temperature in oilfield formation and the energy enhancement experiments were conducted to investigate the effects of reactant concentration and initial pressure on increasing the pressure and temperature. The performance of the N2 generation system assisted by four different authigenic acids was compared through the energy enhancement experiments.Before the experiments, several parameters had to be defined: Pc was the container pressure at 25 °C; P0 was the initial container pressure at room temperature (20 °C); ΔP was the difference between Pc and P0 (ΔP = |Pc − P0|); Tmax and Pmax were the maximum temperature and pressure during the experiments. The gas production volume V was calculated according to the ideal-gas equation (PV = nRT).
| Temperature/°C | P0/MPa | c(reactant)/M | Tmax/°C | Pmax/MPa | Pc/MPa | ΔP/MPa | GPV/L | GGE/% |
|---|---|---|---|---|---|---|---|---|
| 100 | 0 | 1.5 | 125 | 3.62 | 2.88 | 2.88 | 4.184 | 77.48 |
| 2.0 | 163 | 5.26 | 4.15 | 4.15 | 6.030 | 83.75 | ||
| 2.5 | 201 | 8.00 | 5.10 | 5.10 | 7.410 | 82.33 | ||
| 3.0 | 218 | 10.90 | 6.15 | 6.15 | 8.936 | 82.74 |
| Temperature/°C | P0/MPa | c(reactant)/M | Tmax/°C | Pmax/MPa | Pc/MPa | ΔP/MPa | GPV/L | GGE/% |
|---|---|---|---|---|---|---|---|---|
| 100 | 2 | 1.5 | 135 | 6.20 | 5.10 | 3.10 | 4.455 | 82.50 |
| 4 | 136 | 8.70 | 7.20 | 3.20 | 4.550 | 84.26 | ||
| 6 | 130 | 10.75 | 8.90 | 2.90 | 4.065 | 75.28 | ||
| 8 | 133 | 11.00 | 11.00 | 3.00 | 4.161 | 77.06 |
| Authigenic acids | Temperature/°C | P0/MPa | Tmax/°C | Pmax/MPa | Pc/MPa | ΔP/MPa | GPV/L | GGE/% |
|---|---|---|---|---|---|---|---|---|
| Blank group | 100 | 0 | 125 | 3.62 | 2.88 | 2.88 | 4.184 | 77.48 |
| 0.005 M APS | 135 | 4.08 | 3.31 | 3.31 | 4.810 | 89.07 | ||
| 0.050 M MF | 137 | 4.10 | 3.31 | 3.31 | 4.810 | 89.07 | ||
| 0.050 M MF | 135 | 4.05 | 3.30 | 3.30 | 4.795 | 88.80 | ||
| 0.050 M PFA | 128 | 3.85 | 3.19 | 3.19 | 4.621 | 85.57 |
4. Conclusion
The main purpose of this study was to find out the effect of several factors on the gas production volume (GPV) and develop the kinetics equation of the NaNO2/NH4Cl system. In order to form an authigenic acid assisted in situ N2 generation system, several potential chemicals were selected by monitoring the pH value. The gas generating and energy enhancing capacities of these systems were examined and the main conclusions are summarized below.(1) With the increasing reactant concentration, c(H+) and the temperature, the volume of nitrogen production increased. The optimal molar ratio of NaNO2/NH4Cl is 1![[thin space (1/6-em)]](https://www.rsc.org/images/entities/char_2009.gif) :
:![[thin space (1/6-em)]](https://www.rsc.org/images/entities/char_2009.gif) 1. The experimental kinetic equation of the N2 generating process by NaNO2 and NH4Cl is dc/dt = −7.103 × 10⁷cH+1.3291c02.0949e(−51.28 kJ mol−1)/RT.
1. The experimental kinetic equation of the N2 generating process by NaNO2 and NH4Cl is dc/dt = −7.103 × 10⁷cH+1.3291c02.0949e(−51.28 kJ mol−1)/RT.
(2) The optimized concentrations of authigenic acids are 0.05 M for methyl formate (MF) and 0.005 M for ammonium persulphate (APS). Both these authigenic acids could clearly increase the gas production volume of the system.
(3) The energy-enhancing capacity increased with the increasing reactant concentration while the initial pressure had a little impact on energy enhancement. The presence of authigenic acids in the NaNO2/NH4Cl mixture would provide a higher pressure and temperature. The gas-generating efficiency of the system with 0.05 M methyl formate and 0.005 M ammonium persulphate could reach 89.07%. The N2 generation system assisted by ammonium persulphate would be a better choice for oil field application than methyl formate.
Conflicts of interest
There are no conflicts to declare.Acknowledgements
This work was supported by “National Science and Technology Major Project of China” (2016ZX05058-003-003). The authors express their appreciation to technical reviewers for their constructive comments.Notes and references
- S. S. Wang, C. L. Chen, B. Shiau and J. H. Harwell, Fuel, 2018, 217, 499–507 CrossRef CAS.
- D. Y. Zhu, J. R. Hou, J. F. Wang, X. Wu, P. Wang and B. J. Bai, Fuel, 2018, 215, 619–630 CrossRef CAS.
- F. Wang, H. L. Chen, S. Alzobaidi and Z. M Li, Energy Fuels, 2018, 32, 9093–9105 CrossRef CAS.
- K. K. Gumersky, I. S. Dzhafarov, A. K. Shakhverdiev and Y. G. Mamedov, presented at SPE European Petroleum Conference, Paris, France, October, 2000, SPE 65170 Search PubMed.
- D. A. Nguyen, H. S. Fogler and S. Chavadej, Ind. Eng. Chem. Res., 2001, 40, 5058–5065 CrossRef CAS.
- D. R. Davies, E. A. Richardson and D. Antheunis, presented at SPE Middle East Oil Technical Conference and Exhibition, Manama, Bahrain, March, 1981, SPE 9653 Search PubMed.
- H. W. Mcspadden, M. L. Tyler and T. T. Velasco, presented at SPE California Regional Meeting, Oakland, California, April, 1986, SPE 15098 Search PubMed.
- C. N. Khalil and Z. A. Franco, presented at SPE Latin America Petroleum Engineering Conference, Rio de Janeiro, Brazil, October, 1990, SPE 21113 Search PubMed.
- E. A. Evangelista, C. M. Chagas, J. A. F. Melo, J. D. H. Rocha, N. B. Filho and L. C. C. Marques, presented at SPE Offshore Technology Conference, Houston, Texas, USA, May, 2009, SPE 19730 Search PubMed.
- T. Moussa, S. Patil and M. Mahmoud, presented at SPE Kingdom of Saudi Arabia Annual Technical Symposium and Exhibition, Dammam, Saudi Arabia, April, 2018, SPE 192432-MS Search PubMed.
- E. A. Richardson, R. F. Scheuerman and D. C. Berkshire, US Pat., 4219083, Aug. 26, 1980.
- E. A. Richardson and R. F. Scheuerman, US Pat., 4178993, Dec. 18, 1979.
- T. I. Mitchell, S. C. Donovan, J. B. Collesi and H. W. Mcspadden, presented at SPE California Regional Meeting, Long Beach, California, USA, April, 1984, SPE 12776 Search PubMed.
- R. K. Romeu, C. N. Khalil and A. Rabinovitz, presented at SPE Latin America Petroleum Engineering Conference, Rio de Janeiro, Brazil, October, 1990, SPE 21108 Search PubMed.
- K. Singh, A. S. Mohamed, S. S. Alian, M. Ismail, M. Anwar, W. W. Mohamed and S. A. Ghani presented at SPE Offshore Technology Conference, Houston, Texas, USA, May, 2013, SPE 23933 Search PubMed.
- A. R. Alnakhli, L. A. Sukkar, J. Arukhe, A. Mulhem, A. Mohannad, M. Ayub and M. Arifin, presented at SPE Heavy Oil Conference & Exhibition, Kuwait City, Kuwait, December, 2016, SPE 184118MS Search PubMed.
- Y. X. Liu, Q. Xie and X. Y. Chen, Pet. Geol. Recovery Effic., 2002, 9, 85–88 Search PubMed.
- J. P. Ashton, L. J. Kirspel, H. T. Nguyen and D. J. Credeur, SPE Prod. Eng., 1989, 4, 157–160 CrossRef CAS.
- P. Singh and H. S. Fogler, Ind. Eng. Chem. Res., 1998, 37, 2203–2207 CrossRef CAS.
- D. A. Nguyen, F. F. Moraes and H. S. Fogler, Ind. Eng. Chem. Res., 2004, 43, 5862–5873 CrossRef CAS.
- N. C. Lu, K. C. Zhang, P. H. Tan, T. Z. Yang and L. J. Wu, J. Chem. Ind. Eng., 1998, 49, 261–267 CAS.
- F. L. Zhao, Oilfield Chemistry, China University of Petroleum Press, Dongying, China, 2nd edn, 2012, pp. 175–182 Search PubMed.
- E. D. Hughes, C. K. Ingold and J. H. Ridd, J. Chem. Soc., 1958, 12–21 Search PubMed.
- J. H. Dusenbury and R. E. Powell, J. Am. Chem. Soc., 1951, 73, 3266–3268 CrossRef CAS.
- W. G. Wu, Y. Xiong, J. Wang and D. J. Chen, Oilfield Chem., 2007, 24, 106–108 CAS.
- D. A. Nguyen, M. A. Iwaniw and H. S. Fogler, Chem. Eng. Sci., 2003, 58, 4351–4362 CrossRef CAS.
- A. M. Wu, M. T. Chen, S. R. Gu and W. J. Wang, Oil Drill. Prod. Technol., 1995, 17, 60–64 Search PubMed.
- Z. S. Gao, Research of in situ generation gas technology cleanup and viscosity reduction adaptability in low permeability reservoirs, MS thesis, Xi’an Shiyou University, China, May 2011 Search PubMed.
- Q. Y. Xing, W. W. Pei, R. Q. Xu and J. Pei, Fundamentals of Organic Chemistry, Higher Education Press, Beijing, China, 3rd edn, 2005, pp. 602–605 Search PubMed.
- W. F. Gao, Study and preparation on new sandstone type latent acid, MS thesis, China University of Petroleum (East China), China, May 2011 Search PubMed.
- W. M. Salathiel and C. M. Shaughnessy, US Pat., 4136739, Jan. 30, 1979.
- Y. N. Liu, J. H. Lei and L. S. Wang, Inorganic Chemistry, Science Press, Beijing, China, 2nd edn, 2013, pp. 328–330 Search PubMed.
Footnote |
| † Electronic supplementary information (ESI) available. See DOI: 10.1039/c9ra07934c |
| This journal is © The Royal Society of Chemistry 2019 |

