 Open Access Article
High-efficiency adsorption of tetracycline by the prepared waste collagen fiber-derived porous biochar†
Xinxing Weiac,
Renjing Zhangac,
Wenchao Zhangac,
Yue Yuan*b and
Bo Lai *ac
*ac
aState Key Laboratory of Hydraulics and Mountain River Engineering, College of Architecture and Environment, Sichuan University, Chengdu 610065, China. E-mail: laibo@scu.edu.cn; Fax: +86 15308172530; Tel: +86 15308172530
bDepartment of Biomass and Leather Engineering, Chengdu 610065, China. E-mail: smileyuan1987@scu.edu.cn; Fax: +86 18215501987; Tel: +86 18215501987
cSino-German Centre for Water and Health Research, Sichuan University, Chengdu 610065, China
First published on 29th November 2019
Abstract
Porous biochar (PBC) derived from Cr-containing waste collagen fibers was prepared by two-step pyrolysis to 800 °C (PBC-800) and alkali activation. Brunauer–Emmet–Teller (BET) analysis, scanning electron microscopy (SEM), Raman spectroscopy, X-ray photoelectron spectroscopy (XPS), Fourier transform infrared spectroscopy (FTIR), X-ray fluorescence (XRF), thermogravimetric analysis (TGA) and zeta potential analysis were used to characterize PBC-800. Batch experiments showed that PBC-800 had an excellent removal effect on tetracycline (TC), and the maximum adsorption capacity was 593.84 mg g−1. Meanwhile, PBC-800 was found to be suitable for a wide pH range. The isothermal adsorption and kinetic model fitting proved that the TC adsorption by PBC-800 occurred via 5 types of chemical adsorption. The main rate-limiting step was closely related to the initial concentration of TC. The total release of Cr was less than 0.05 mg L−1, which indicated that PBC-800 was stable and did not cause serious secondary pollution. Compared to the conventional metal-free biomass, Cr in a waste collagen fiber (WCF) played an important role in carbon formation and adsorption. The excellent adsorption properties of PBC-800 indicated that it could enrich low concentrations of TC in water. Thus, WCF can be used to prepare cost-effective PBC, which supplies a new process to reuse Cr-containing waste.
1. Introduction
TC, mainly used in the treatment of human diseases and aquatic animal husbandry, is an antibiotic that is produced in large amounts and is widely used.1,2 The TC concentration in surface water locally and globally is about ng L−1 to μg L−1 (ref. 3–5) and the high concentration of TC in pharmaceutical wastewater is several hundred ppm.6 TC is difficult to degrade and can have a negative impact on various animals and plants. It also endangers human health and causes damage to the blood, kidneys, liver and nervous system of the human body.7–9 Numerous approaches, including advanced oxidation,10,11 electrochemical methods,12,13 biological treatments14 and adsorption,15 have been applied to remove organic pollutants and antibiotics like TC. Although extensive experimental studies have focused on the catalytic degradation of TC, the treatment with free radicals is considered to be uneconomical on account of the expensive raw materials.16 Furthermore, if the reaction process is not fully mineralized, it may cause secondary pollution due to the production of more toxic by-products.17 On the contrary, adsorption is the primary choice due to its non-toxicity, economic feasibility, and effectiveness; moreover, it does not produce secondary pollution and limits the flow to avoid the spread of pollutants.Biochar (BC), derived from the pyrolysis of biomass, consists of two parts. One is a highly graphitized black carbon repolymerized by pyrolysis gas, and the other is a coke-type black carbon composed of solid residues.18 The structural properties of BC are as follows: it is highly aromatic and porous, has a high specific surface area (SSA) and large pore volume, and is rich in various oxygen-containing functional groups. Agricultural and industrial wastes such as leaves,19 rice straw,20 sawdust,21 waste chicken feathers,22 sewage sludge,23 crab shells,24 pecan nutshells,25 and WCF are frequently used as BC precursors due to their low prices.26,27
The tanning industry has produced a large amount of leather solid waste. Cr-containing waste accounts for about 20% of the world's total leather waste.28 There are nearly 1.4 million tons of waste leather produced every year in China, and the reuse of this resource is very necessary (http://www.chinaleather.org in Chinese). There are few reports on leather waste-derived BC. Kantarli et al. used CO2 physical activation and H3PO4 and ZnCl2 chemical activation to make leather waste into BC for the adsorption of toxic pollutants in water.27 Oliveira and his companions made waste leather into Cr-containing BC, which applied Cr oxide to catalyze the production of a hydroxyl radical degradation dye by hydrogen peroxide.26 Currently, there are no studies on the adsorption of antibiotic contaminants by leather collagen fiber-derived BC and the discussion of the adsorption mechanism.
Taking into account the reuse of WCF resources, in this study, potassium hydroxide (KOH) was used as an activator to treat Cr-containing waste leather by a two-step pyrolysis process to produce PBC-800 containing poly-metallic minerals for the rapid and efficient adsorption of TC in an aqueous solution. The purpose of this research was to (1) prepare and characterize PBC-800 and demonstrate the superiority of PBC-800 to others, (2) study the kinetic and isotherm models to understand the adsorption process, (3) explore the effects of anions with various intensities on the PBC-800 adsorption of TC, and (4) determine the mechanism of the adsorption of TC by PBC-800.
2. Experimental materials and methods
2.1. Materials and reagents
The details of the reagents used in this experiment have been provided in the ESI.†2.2. Preparation of waste collagen fiber-derived porous biochar
WCF was crushed by a skin powder crusher into a particle size of about 1 mm after drying for two days at 50–60 °C. Referencing the method described by Konikkara,29 PBC-800 was prepared by a two-stage process including pre-carbonization and alkali activator modification. The pre-carbonization process was carried out in the presence of nitrogen, the temperature control program of the tube furnace was set to 400 °C, the heating rate was 5 °C min−1, and the temperature of 400 °C was kept for 4 h. The remaining substance at this stage was labeled as BC-400. In the chemical modification process, BC-400 was ultrasonically mixed with a KOH solution (3.65 M) at a solid–liquid ratio of 1![[thin space (1/6-em)]](https://www.rsc.org/images/entities/char_2009.gif) :
:![[thin space (1/6-em)]](https://www.rsc.org/images/entities/char_2009.gif) 4 until drying to constant weight. After impregnation, the mixture was heated to 800 °C under anaerobic conditions and incubated for 2 h. After washing several times with hot deionized water for removing the soluble substances and drying, the final carbon material was labeled as PBC-800.
4 until drying to constant weight. After impregnation, the mixture was heated to 800 °C under anaerobic conditions and incubated for 2 h. After washing several times with hot deionized water for removing the soluble substances and drying, the final carbon material was labeled as PBC-800.
2.3. Characterizations of material
Specific methods have been provided in the ESI.†2.4. Batch experiments
The adsorption isotherm experiments were carried out by vigorously shaking 100 mL of TC solution (20 to 220 mg L−1 ± 5 mg L−1, pH = 6) mixed with 20 mg (±0.5 mg) of PBC-800 to reach equilibrium. The supernatant was filtered using a 0.45 μm filter and quantified by a UV spectrophotometer at 365 nm.30The exploration of adsorption kinetic features requires sampling at different time points. Except for the initial concentration of TC (20 mg L−1 and 100 mg L−1, ±5 mg L−1), other experimental conditions were consistent with the exploration of isothermal adsorption properties.
In order to understand the applicable pH of PBC-800, the initial pH was adjusted to different pH values using 0.1 M HCl or NaOH. In addition, to investigate the effects of the different concentrations of various anions on the adsorption of TC, PBC-800 was added to the TC solution with various anion concentrations (1, 5, 10, 20, 50 mM). The pH of the system was monitored before and after the reaction. Unless otherwise stated, this experiment was completed at 25 °C.
Three parallel experiments were set up, with a standard deviation of less than 5%, and the arithmetic mean values were calculated. The adsorption capacity at time t, qt, (mg g−1) and the removal efficiency (R%) were determined using eqn (1) and (2):
 | (1) |
 | (2) |
3. Results and discussion
3.1. The characteristics of the adsorbent
| 2KOH + CO2 = K2CO3 + H2O↑ | (3) |
| 2C + 2KOH = 2CO2↑+ 2K↑ + H2↑ | (4) |
| K2CO3 + C = K2O + 2CO↑ | (5) |
| K2O + C = 2K↑ + CO↑ | (6) |
The SSA of PBC-800 produced in this experiment reached 2010.4 m2 g−1, and the total pore volume was 1.2 cm3 g−1 (Table 1). The mesopore (pore diameter: 2–50 nm) volume was approximately 80% of the total pore volume. Fig. S1† shows that micropore (pore diameter: < 2 nm) filling leads to a sharp rise in nitrogen adsorption during the low-pressure phase. As the relative pressure increased, the nitrogen absorption and desorption curve of PBC-800 showed a mild slope and a H4 type hysteresis loop, which indicates that most of the pores of the PBC-800 were slit holes produced by the layered structure.29 The average pore diameter calculated by the BJH method was 2.8 nm, which is larger than the molecular diameter of TC (1.27 nm).30 Due to smaller size exclusion, it is reasonable to expect that the PBC-800 has sufficient pore size to allow the TC to permeate the pore interior.
| Sample | SBETa (m2 g−1) | Smicb (m2 g−1) | Smesoc (m2 g−1) | Vtotald (cm3 g−1) | Vmicroe (cm3 g−1) | Vmesof (cm3 g−1) | Vmicro/Vtotal (%) | Vmeso/Vtotal (%) | Dpg (nm) |
|---|---|---|---|---|---|---|---|---|---|
| a BET surface area.b Micropore surface area.c Mesopore surface area.d Total pore volume.e Micropore volume.f Mesopore volume.g Average pore diameter, —: no data. | |||||||||
| BC-400 | 0.09 | — | — | 0.001 | — | — | — | — | — |
| PBC-800 | 2010.4 | 412 | 1599 | 1.2 | 0.2 | 0.9 | 20.2 | 79.8 | 2.8 |
The SEM images of samples are presented in Fig. S2.† WCF (Fig. S2(A)†) is a unique compact fiber bundle structure with a smooth surface. The surface of BC-400 (Fig. S2(B)†) does not have a distinct porous structure. Consistent with the analysis of the nitrogen adsorption and desorption, Fig. S2(C) and (D)† clearly show that PBC-800 was etched by lye to produce a rich slit hole, which confirmed that KOH does play a positive role in the development of pores.
The XRD analysis of BC-400 and PBC-800 are shown in Fig. 1(A). The main components of the crystals contained in BC-400 were Cr oxide, copper blue, and Cr carbide. After activation by KOH, Cr carbonyl and graphite peaks appeared in PBC-800 at 26°, 44°, 55°, and 64° corresponding to the (002), (100/101), (004) and (221) planes of the graphite structure.35,36 The graphite peak was weak, which may have been affected by Cr compounds. It has been reported that Cr(NO3)3 was used as a catalyst to promote the graphitization of carbon under microwave irradiation.36 Thus, Cr in the WCF can also be active in the carbon formation process, making the degree of graphitization of PBC-800 higher than that of BC-400 under high-temperature conditions.
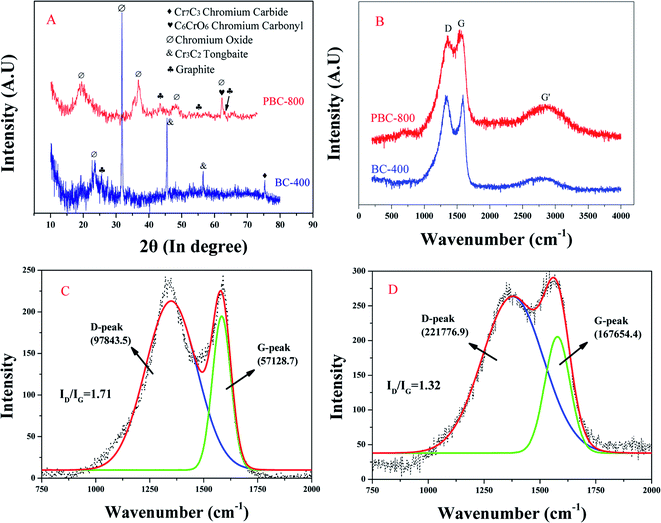 | ||
| Fig. 1 XRD patterns (A) and Raman spectra (B) of samples. Peak fitting of BC-400 (C) and PBC-800 (D) Raman spectra. | ||
As shown by the Raman spectrum (Fig. 1(B)), the D-band (1341–1360 cm−1), G-band (1563–1589 cm−1) and G′-band (2780–2851 cm−1) are fundamental bands in Raman spectroscopy for graphite material.36 The D peak corresponds to the vibration of the edge plane in the sp3 carbon lattice, which was activated by defective disordered carbon.29 The G peak was produced by the tensile bonding of all defect-free carbon rings and sp2 heteroatoms on the carbon chain, representing graphite carbon.29 G′ directs the graphite overtone peak of the sp2 bonded planar graphene sheet stack response.37 It is apparent that the G′ intensity of PBC-800 was enhanced and it has also been reported that the embedding of metal has a significant effect on G'.37 “I” represents the intensity of the peak band, and the intensity ratio (ID/IG) reflects the degree of graphitization and disorder of BC.29 The ID/IG (intensity ratio) of BC-400 and PBC-800 were 1.71 and 1.32 (Fig. 1(C) and (D)), respectively, which demonstrated that the surface activation process increased the size of the sp2 conjugated system and reduced the disorder of PBC-800 36.
3.2. Control experiment
To demonstrate the necessity of a two-step pyrolysis, one-step pyrolysis was used to prepare BC at different temperatures (BC-400, BC-600 and BC-800). Although the adsorption capacity increased slightly with increasing the pyrolysis temperature, the removal efficiency was less than 20% (Fig. S3†); therefore, it was suitable for preparing PBC by a two-step pyrolysis method. The adsorption of TC by PBC (PBC-600 and PBC-800) of different activation temperatures was investigated. It is obvious that PBC-600 only reached 25% and PBC-800 could attain 99% in terms of the TC adsorption efficiency, which reflected the importance of pyrolysis to 800 °C in the activation step.In order to indirectly prove the action of Cr, the adsorbent was prepared using Cr-free WCF (commonly known as white skin powder). BC-400-W, PBC-600-W and PBC-800-W (W means white) were prepared according to the method described in Section 2. The removal efficiencies of PBC-600-W and PBC-800-W were just half of PBC-600 and PBC-800, which indicated that Cr may play a role in carbon formation and adsorption processes. Cr may undergo activation during carbon formation and can combine with TC through surface complexation (SC) and cation bridges (CB).
BC-400-W and Cr2O3 were mixed in a ratio of 20![[thin space (1/6-em)]](https://www.rsc.org/images/entities/char_2009.gif) :
:![[thin space (1/6-em)]](https://www.rsc.org/images/entities/char_2009.gif) 1 and the PBC-800-Mix was prepared by KOH activation. As shown in the XRD diagram (Fig. S4†), the PBC-800-Mix has only the peak of graphite and Cr oxide with little intensity. From the aspect of adsorption, the removal efficiency of PBC-800-Mix on TC was obviously lower than that of PBC-800, and also slightly lower than PBC-800-W. The above results may indicate that the extra added Cr does not significantly promote graphitization in carbon formation, and may also inhibit the PBC-800-Mix adsorption of TC due to the plugging of pore sites. Thus, the uniform and tightly bound nature of trivalent Cr may play an irreplaceable role in carbon formation, which reflects the superiority of WCF as biomass. Table 3 compares the SSA of different biomass-derived BC with the adsorption amount of TC.
1 and the PBC-800-Mix was prepared by KOH activation. As shown in the XRD diagram (Fig. S4†), the PBC-800-Mix has only the peak of graphite and Cr oxide with little intensity. From the aspect of adsorption, the removal efficiency of PBC-800-Mix on TC was obviously lower than that of PBC-800, and also slightly lower than PBC-800-W. The above results may indicate that the extra added Cr does not significantly promote graphitization in carbon formation, and may also inhibit the PBC-800-Mix adsorption of TC due to the plugging of pore sites. Thus, the uniform and tightly bound nature of trivalent Cr may play an irreplaceable role in carbon formation, which reflects the superiority of WCF as biomass. Table 3 compares the SSA of different biomass-derived BC with the adsorption amount of TC.
| Biomass | Activator | BET (m2 g−1) | Total pore volume (cm3 g−1) | qmax (mg g−1) | References |
|---|---|---|---|---|---|
| Rice-husk | H2SO4, KOH | 46.8, 117.8 | 0.033, 0.073 | 23.26, 58.82 | 56 |
| Nut shells | NaOH | 1524 | 0.180 | 455.8 | 28 |
| Leave | ZnCl2 | 461.98 | 0.3359 | 146.68 | 17 |
| Sawdust | ZnCl2, FeCl3 | 518.54 | 0.069 | 102 | 19 and 57 |
| Chicken feather | KOH | 1838 | 1.033 | 388.33 | 20 |
| WCF | KOH | 2010.4 | 1.2 | 593.84 | Present study |
As can be seen from Fig. S5,† the SSA of PBC-600 after the TC adsorption was significantly smaller than before, which indicated that TC was attached to PBC-600 and occupied an effective site, resulting in the SSA decreasing from 693 m2 g−1 to 631 m2 g−1. Fig. S2† shows the XPS spectrum of Cr 2p on the surface of PBC-600 before and after TC adsorption. Since Cr on the surface of PBC-600 reacted with TC, the binding energy of Cr 2p increased from 586.1 eV and 576.32 eV to 586.24 eV and 576.4 eV. The above results indicate that both SSA and surface metal Cr play a certain role when PBC-600 adsorbs TC. However, the effect of PBC-600 on TC adsorption was significantly lower than that of PBC-800, which may be caused by the following. The lower pyrolysis temperature caused more oxygen-containing functional groups to be present in PBC-600 as compared PBC-800. According to the literature,33 the pyrolysis temperature affected the hydrophobicity of the biochar. PBC-600 has a large polarity index and a small aromatic index, which makes it less hydrophobic than PBC-800. The small hydrophobicity is not conducive to the adsorption of TC.
3.3. Batch experiments
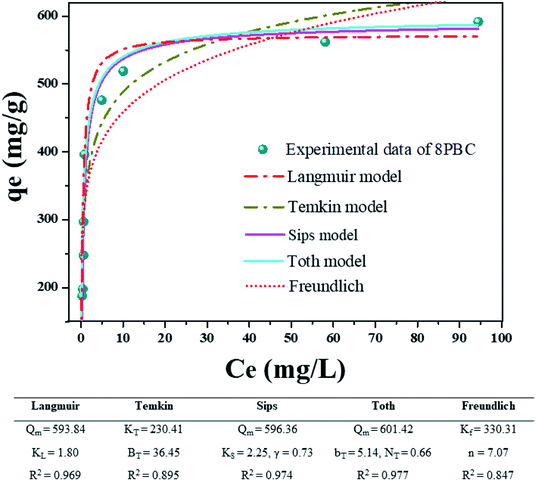
The R2 of the Temkin and Freundlich fits were 0.895 and 0.847. It was shown that the fitting effect of the Temkin equation was slightly higher as compared to Freundlich. The value of BT was 36.45 > 1, which demonstrated that the exothermic reaction was due to electrostatic attraction (EA) and heterogeneous pores.30
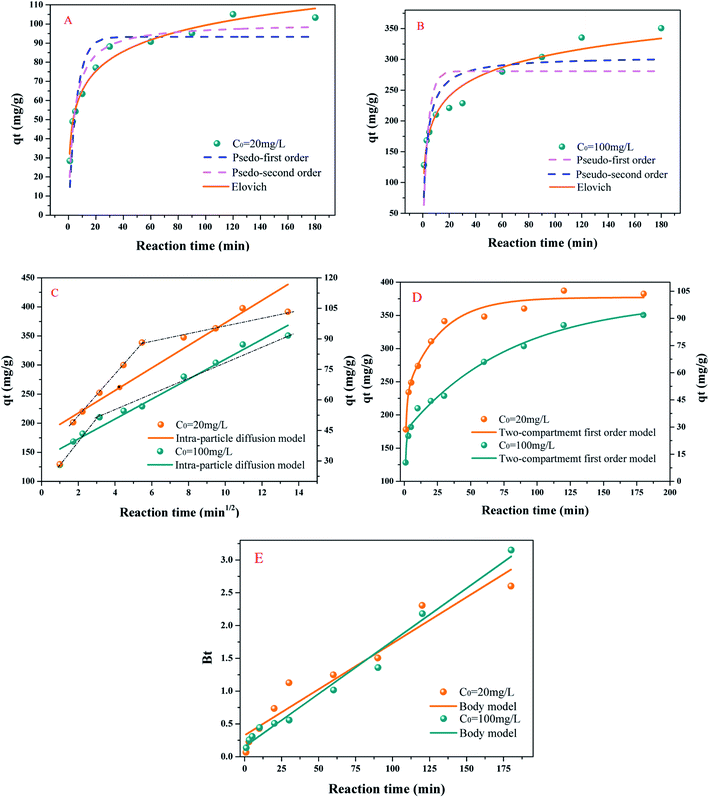
It is noteworthy that whether the initial concentration was 20 mg L−1 or 100 mg L−1, the Elovich (E) (R2: 0.97937 and 0.95193) model better describes the process of uptake than the pseudo-first-order (PFO) (R2: 0.8236 and 0.50305) and pseudo-second-order (PSO) (R2: 0.93971 and 0.72397) models. The hypothesis of the E model is that the process was energetically heterogeneous and there was non-desorption.21 Thus, it was proved that the chemical adsorption of TC by PBC-800 mainly covered hydrogen bonding (HB), π–π electron-donor–acceptor (π–π EDA), and EA.33,40
The two-compartment first-order (TFO) model describes the time course of the PBC-800 adsorption of TC (Fig. 3(D)). The high R2 value (R2 > 0.98) indicated that PBC-800 adsorption of TC was a dual-domain process.21 The values of Ff (0.45827 and 0.46431) were lower than FS (0.54173 and 0.53569). The results revealed that the amount of rapid adsorption was lower than that of slow adsorption, which indicated that slow adsorption was dominant. Zhou et al. considered that rapid adsorption occurred due to HB and π–π EDA.21 The fast adsorption phase may also involve physical adsorption (van der Waals forces) because of the large SSA.
The intra-particle diffusion (IPD) and Boyd model were employed to analyze the actual rate-controlling step (Fig. 3(C) and (E)). A plot of qt versus t0.5 displayed several linearities in distinct regions prior to equilibrium. The first stage was rapid adsorption, and the rate-limiting step was liquid film diffusion (LFD). This process is attributed to TC being stacked on the outer surface of PBC-800 30. The second stage was slow adsorption, and the rate-limiting step was IPD. TC diffused into the pore interior,30 which is similar to the results of Zhou et al.41
The intercept value represents the thickness of the boundary layer (Fig. 3(C)). When the initial concentrations were 20 mg L−1 and 100 mg L−1, the fitted value of L was 42.4 mg g−1 and 138.7 mg g−1, and the time of entering the inner diffusion was 30 min and 9 min. A larger L meant a thicker boundary layer and indicated that the TC entered the internal diffusion phase early. A previous study has shown that the p-interaction of the benzene ring caused the adsorbed molecules to be parallel to each other.42 Therefore, plenty of parallel TC molecules were deposited on the surface of PBC-800 at a high concentration, which is advantageous for diffusing TC into the interior of PBC-800 43.
The Body model shows the linear relationship of Bt vs. time (Fig. 3(E)). The calculation method for Bt is recorded in the literature.44 The intercept of low concentration (20 mg L−1) was obviously not zero, indicating that LFD dominated.41 In contrast, the intercept of high concentration (100 mg L−1) was infinitely close to zero, indicating that the sorption was governed by IPD.41 This result coincides with the analysis of IPD.
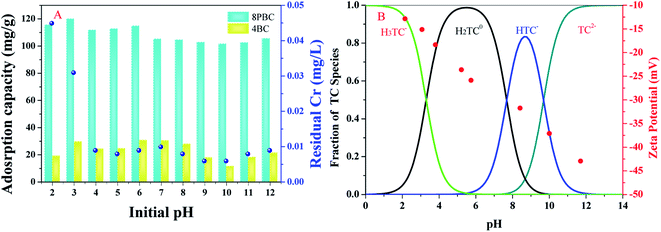
Surprisingly, when the pH gradually increased, the adsorption efficiency of PBC-800 on TC was not reduced all the time. When the pH > 11, the main form of TC is TC2− and the adsorption efficiency was strengthened because deprotonated nitrogen and negatively charged hydroxyl groups caused strong chelation of TC with polyvalent metal cations.47 Mitscher and Martin reported the complexation of antibiotics with Ca, in which the divalent anion complex constants of oxytetracycline (OTC), tetracycline (TET) and chlortetracycline (CTC) were an order of magnitude larger than the monovalent anion complexation constant.48,49 Therefore, the reason the adsorption capacity does not decrease all the time under alkaline conditions may be that the strengthening of the metal complex partially offset the effect of electrostatic repulsion and occupied the dominant adsorption at high pH conditions, which is in line with the mechanism of BC adsorption of TC as summarized by Peiris.40
Although the change in pH affected the adsorption capacity of the PBC-800, the PBC-800 still exhibited excellent adsorption capacity (Fig. 4(A)). This is evidence that PBC-800 has applicability under a wide range of pH conditions and is different from other BC that were poorly adsorbed under per-acid and high alkaline conditions 33. The stability and possible secondary pollution of PBC-800 were evaluated by measuring the total Cr concentration after the reaction. Regardless of acidic or alkaline, the total Cr concentration was less than 0.05 mg L−1 and within the safe range (WHO Guidelines for Drinking Water Quality, https://www.who.int/zh). There was almost no Cr6+ in the total Cr ions released during the adsorption process. Studies have shown that the formation of Cr carbide does not lead to the leaching of Cr.50 Leaching of Cr ions was significantly reduced (CCr < 0.01 mg L−1) when the pH of the experimental condition was neutral. The comprehensive experimental results and actual conditions proved that PBC-800 is very stable at pH > 3. It could be applied to wastewater treatment because the pH of the operating conditions of a typical sewage treatment plant is 5.5–8.0.51
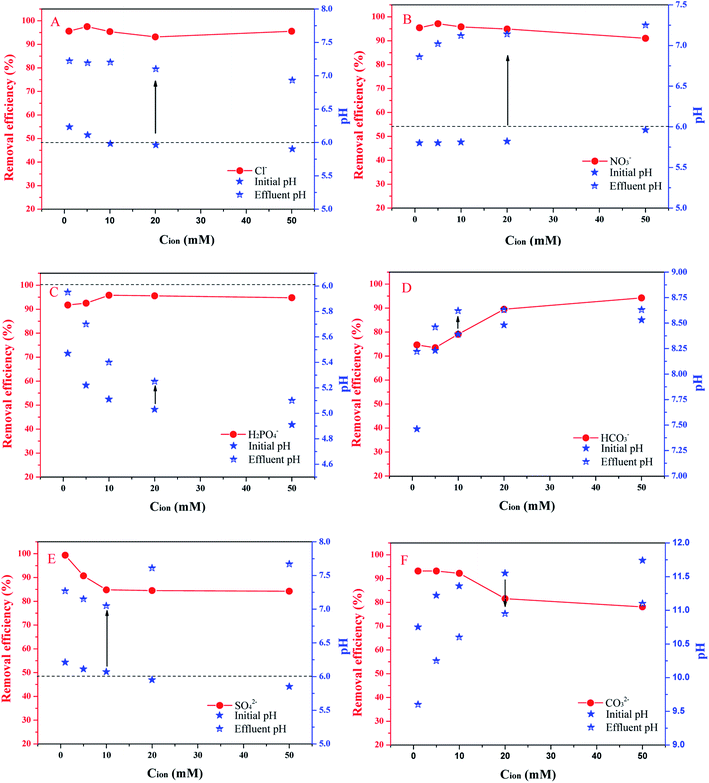
Monovalent anions have a slight influence on the adsorption efficiency of TC, except for HCO3−. Anions such as Cl−, NO3− and H2PO4− had a certain promoting effect at concentrations of 1–5 mM, 1–5 mM and 1–10 mM, respectively. Subsequent, increases in the ion concentration slightly inhibited adsorption. The promotion or inhibition of ions on BC adsorption of organic matter is attributed to the “salting out” effect and the “squeeze-out” effect on carbonaceous adsorbents.52 Salt ions influence the structure, electrostatic nature and hydrophobicity of antibiotics, reducing the solubility of antibiotics and increasing the adsorption of antibiotics (“salting out”).52 It has been reported that ions can penetrate into the diffusion layer of the graphene surface and eliminate the repulsive force between the adsorbents, which may promote the formation of a more compact aggregate structure. This squeeze-out effect is unfavorable for the uptake of organic matter.53 The pH of the effluent increased because TC was adsorbed by PBC-800. In the presence of H2PO4−, the pH was relatively small because H2PO4− can be ionized to be acidic.
HCO3− has an inhibitory effect on TC adsorption. When the concentration of HCO3− was greater than 5 mM, the inhibitory effect was weakened constantly. The main mechanisms of the adsorption process are SC and CB under alkaline condition.40 It has been proved that the effect of electrostatic repulsion is weakened even though the main form of TC is HTC−. The reason for the slight change in the pH of the effluent is that HCO3− can be hydrolyzed and ionized.
The presence of SO42− and CO32− inhibited the adsorption of TC and the adsorption efficiency was only 80% because plenty of the adsorption sites were occupied. It has been reported that Na+ and Cl− can weaken electrostatic interactions between BC and TC, which resulted in electrostatic shielding.54 Thus, the electrostatic shielding of the PBC-800 surface is stronger due to the enhancement of ionic strength.
The different anions at different concentrations have various influences. The ion composition of the actual water body is complex, which means exploring the importance of different ions on the adsorption effect of TC.
4. Mechanism analysis
4.1. Adsorbent functional group
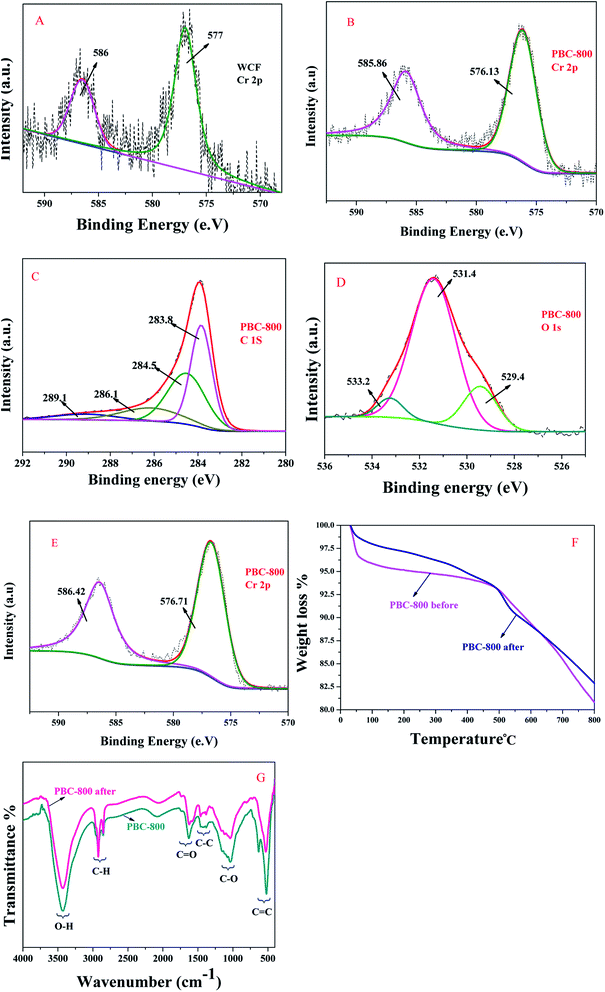
The XPS of the materials are shown in Fig. 6(A–E). A and B diagrams represent the Cr 2p XPS spectrum of WCF and PBC-800, respectively. Peaks at 586, 577, 585.86 and 576.31 eV all represent the binding energies of Cr(III) 2p,55 which also show that the dangerous hexavalent Cr is almost non-existent in the prepared adsorbent. The C and D graphs have shown that the XPS spectra of PBC-800 C 1s and O 1s are composed of three peaks, respectively. The peaks are located at 289.1, 286.1, 284.5, 283.8, 533.2, 531.4, and 529.4 eV, which are attributed to the carbon–oxygen double (C![[double bond, length as m-dash]](https://www.rsc.org/images/entities/char_e001.gif) O) bond, carbon–oxygen (C–O)/carbon nitrogen (C–N) bond, carbon–carbon (C
O) bond, carbon–oxygen (C–O)/carbon nitrogen (C–N) bond, carbon–carbon (C![[double bond, length as m-dash]](https://www.rsc.org/images/entities/char_e001.gif) C) double bond, carbon–carbon (C–C)/carbon-hydrogen (C–H) bond, Cr(III) organic oxygen, Cr deficient oxygen (Cr–O)/oxygen hydrogen (O–H) bond and lattice oxygen in the metal oxide (Cr–O).43,55,56
C) double bond, carbon–carbon (C–C)/carbon-hydrogen (C–H) bond, Cr(III) organic oxygen, Cr deficient oxygen (Cr–O)/oxygen hydrogen (O–H) bond and lattice oxygen in the metal oxide (Cr–O).43,55,56
The FTIR spectrum of PBC-800 is presented in Fig. 6(G). The strong band at 3428 cm−1 represents the O–H stretching vibration. The band at 2853–2943 cm−1 is attributed to the C–H symmetric asymmetric stretching vibration. The bands at 1735–1623 cm−1 and 1500–1384 cm−1 are assigned to C![[double bond, length as m-dash]](https://www.rsc.org/images/entities/char_e001.gif) O and C–C tensile vibrations, respectively. The belt at 1250–1136 cm−1 corresponds to the C–O stretching vibration.30 A series of bands recorded in the 750–500 cm−1 region are attributed to vibrations of C
O and C–C tensile vibrations, respectively. The belt at 1250–1136 cm−1 corresponds to the C–O stretching vibration.30 A series of bands recorded in the 750–500 cm−1 region are attributed to vibrations of C![[double bond, length as m-dash]](https://www.rsc.org/images/entities/char_e001.gif) C.30 Therefore, combining the results from XPS and FTIR, it was found that PBC-800 contains carboxyl groups, amino groups, hydroxyl groups and metal oxides to facilitate the adsorption of TC.
C.30 Therefore, combining the results from XPS and FTIR, it was found that PBC-800 contains carboxyl groups, amino groups, hydroxyl groups and metal oxides to facilitate the adsorption of TC.
4.2. Adsorption mechanism
The thermogravimetric curves and infrared spectra of PBC-800 and PBC-800-loaded (loaded means PBC-800 after adsorption of TC) are shown in Fig. 6(F and G). The weight loss below 100 °C represents dehydration. Because TC occupied most of the special sites, resulting in less water being adsorbed by PBC-800, the mass percentage of PBC-800-loaded TC dehydration was less than PBC-800. At 500–600 °C, the PBC-800-loaded weight loss percentage and rate were faster as compared to PBC-800, which may be because the adsorbed TC decomposed together with the unstable components in the PBC-800. TC (C22H24N2O8) contains a large amount of C. As a result, the total weight loss of the PBC-800-loaded sample was less as compared to PBC-800. The above phenomena indicate that TC was steadily bonded on PBC-800.The TC structures of different ion states are shown in Fig. S5.† Since the ketone group has strong electron-withdrawing ability, the conjugated ketene structure of TC affects its own π-electron acceptor properties and easily forms a π–π EDA interaction with BC.40 For example, cationic π bond interactions can occur due to the protonation of the amino group on the carbocyclic ring.57 In the FTIR spectrum (Fig. 5G), the PBC-800-loaded C![[double bond, length as m-dash]](https://www.rsc.org/images/entities/char_e001.gif) C is represented by a single peak, and the intensity is greatly weakened; the C–C peak shape is obvious, and the intensity is increased. Thus, PBC-800 adsorption of TC can be achieved by forming π–π EDA. In addition, it is well known that the phenolic hydroxyl, amine, hydroxyl and ketene moieties of TC can form HB with carboxyl and hydroxyl functional groups.40 Because the zeta potential of PBC-800 is negative, protonated amino groups are also most susceptible to EA. According to the results of this experiment, CB and SC are prone to occur on the surface of the metal, especially under alkaline conditions. According to XPS analysis, after the adsorption of TC on PBC-800, the peak of Cr 2p changed from 585.89 eV (virgin adsorbent) to 586.42 eV, and the peak of Cr 2p slightly shifted up by 0.58 to 576.13 and 576.71 eV. The increase in the binding energy of Cr indicated the decrease in the electron density due to the formation of Cr–O bonds between Cr and TC through complexation and cation bridges during the adsorption process.43
C is represented by a single peak, and the intensity is greatly weakened; the C–C peak shape is obvious, and the intensity is increased. Thus, PBC-800 adsorption of TC can be achieved by forming π–π EDA. In addition, it is well known that the phenolic hydroxyl, amine, hydroxyl and ketene moieties of TC can form HB with carboxyl and hydroxyl functional groups.40 Because the zeta potential of PBC-800 is negative, protonated amino groups are also most susceptible to EA. According to the results of this experiment, CB and SC are prone to occur on the surface of the metal, especially under alkaline conditions. According to XPS analysis, after the adsorption of TC on PBC-800, the peak of Cr 2p changed from 585.89 eV (virgin adsorbent) to 586.42 eV, and the peak of Cr 2p slightly shifted up by 0.58 to 576.13 and 576.71 eV. The increase in the binding energy of Cr indicated the decrease in the electron density due to the formation of Cr–O bonds between Cr and TC through complexation and cation bridges during the adsorption process.43
Fig. 7 provides a schematic illustration of the mechanism, the foremost mechanism of PBC-800 adsorption of TC is as follows.40 Although adsorption involves a small part of physical adsorption (van der Waals forces), chemical adsorption dominates. Under acidic conditions, TC is easily combined with PBC-800 through HB and SC, and protonated amino and C![[double bond, length as m-dash]](https://www.rsc.org/images/entities/char_e001.gif) C can cause electron transfer. Under neutral pH conditions, the most likely reaction is that the tetracycline molecule is electrostatically attracted to the protonated amino group and the phenolic hydroxyl group on the PBC-800. As the basicity of the system increases, the main interaction of TC and PBC-800 is CB and SC.
C can cause electron transfer. Under neutral pH conditions, the most likely reaction is that the tetracycline molecule is electrostatically attracted to the protonated amino group and the phenolic hydroxyl group on the PBC-800. As the basicity of the system increases, the main interaction of TC and PBC-800 is CB and SC.
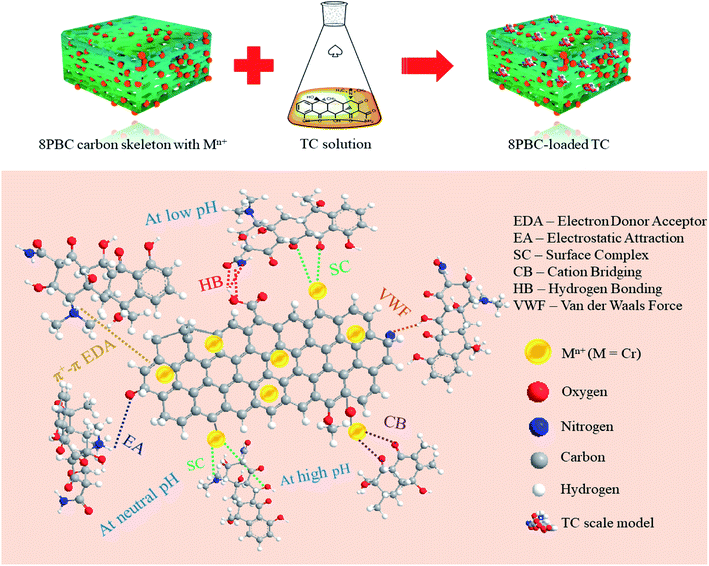 | ||
| Fig. 7 Graphical illustration of the adsorption mechanisms during the adsorption of TC on the PBC-800 surface. | ||
5. Conclusion
PBC-800 has a graphitized porous structure with SSA as high as 2010.4 m2 g−1 and an average pore diameter of 2.8 nm. The raw material contains a tightly bound trivalent Cr, which plays an active role in the carbon formation stage and adsorption process. PBC-800 not only contains a plurality of oxygen-containing functional groups but also has special metal sites. By using equation fitting, experimental data and characterization methods, it has been proved that PBC-800 adsorption of TC is a chemical reaction (HB, SC, π–π EDA, EA and CB) process and the maximum adsorption capacity can reach 593.84 mg g−1 (Langmuir). Anion effect experiments with different ionic strengths indicate that the inhibitory impact of dianions on adsorption is significantly stronger as compared to monovalent anions. Different anion types have different effects on adsorption, which is helpful for understanding the adsorption behavior in actual water bodies. The total release of Cr is below 0.05 mg L−1, which means that the adsorbent is stable and will not cause serious secondary pollution; this opens up the possibility for engineering applications of PBC-800.Conflicts of interest
There are no conflicts to declare.Acknowledgements
The authors would like to acknowledge the financial support from the National Natural Science Foundation of China (No. 21808146 and No. 51878423).References
- L. Wollenberger, B. Halling-Sørensen and K. O. Kusk, Chemosphere, 2000, 40, 723–730 CrossRef CAS PubMed.
- M.-L. Loke, J. Tjørnelund and B. Halling-Sørensen, Chemosphere, 2002, 48, 351–361 CrossRef CAS PubMed.
- K. Kümmerer, Chemosphere, 2009, 75, 417–434 CrossRef PubMed.
- L. B. Massey, B. E. Haggard, J. M. Galloway, K. A. Loftin, M. T. Meyer and W. R. Green, Ecol. Eng., 2010, 36, 930–938 CrossRef.
- Y. Valcárcel, S. González Alonso, J. L. Rodríguez-Gil, A. Gil and M. Catalá, Chemosphere, 2011, 84, 1336–1348 CrossRef PubMed.
- D. G. J. Larsson, C. de Pedro and N. Paxeus, J. Hazard. Mater., 2007, 148, 751–755 CrossRef CAS PubMed.
- O. A. Arikan, L. J. Sikora, W. Mulbry, S. U. Khan, C. Rice and G. D. Foster, Process Biochem., 2006, 41, 1637–1643 CrossRef CAS.
- N. Esiobu, L. Armenta and J. Ike, Int. J. Environ. Health Res., 2002, 12, 133–144 CrossRef PubMed.
- A. K. Sarmah, M. T. Meyer and A. B. A. Boxall, Chemosphere, 2006, 65, 725–759 CrossRef CAS PubMed.
- H. Xiong, S. Dong, J. Zhang, D. Zhou and B. E. Rittmann, Water Res., 2018, 136, 75–83 CrossRef CAS PubMed.
- H. Zhang, Q. Ji, L. Lai, G. Yao and B. Lai, Chin. Chem. Lett., 2019, 30, 1129–1132 CrossRef CAS.
- W. Sun, Y. Sun, K. J. Shah, P.-C. Chiang and H. Zheng, J. Hazard. Mater., 2018, 370, 24–32 CrossRef PubMed.
- J. Li, Y. Li, Z. Xiong, G. Yao and B. Lai, Chin. Chem. Lett., 2019 DOI:10.1016/j.cclet.2019.04.057.
- S. Shao, Y. Hu, C. Cheng, J. Cheng and Y. Chen, Chemosphere, 2018, 209, 35–43 CrossRef CAS PubMed.
- L. Ji, Y. Wan, S. Zheng and D. Zhu, Environ. Sci. Technol., 2011, 45, 5580–5586 CrossRef CAS PubMed.
- J. Cao, L. Lai, B. Lai, G. Yao, X. Chen and L. Song, Chem. Eng. J., 2019, 364, 45–56 CrossRef CAS.
- J. Cao, Z. Xiong and B. Lai, Chem. Eng. J., 2018, 343, 492–499 CrossRef CAS.
- M. W. I. Schmidt and A. G. Noack, Global Biogeochem. Cycles, 2000, 14, 777–793 CrossRef CAS.
- C. Ma, H. Huang, X. Gao, T. Wang, Z. Zhu, P. Huo, Y. Liu and Y. Yan, J. Taiwan Inst. Chem. Eng., 2018, 91, 299–308 CrossRef CAS.
- T. Chen, L. Luo, S. Deng, G. Shi, S. Zhang, Y. Zhang, O. Deng, L. Wang, J. Zhang and L. Wei, Bioresour. Technol., 2018, 267, 431–437 CrossRef CAS PubMed.
- Y. Zhou, X. Liu, Y. Xiang, P. Wang, J. Zhang, F. Zhang, J. Wei, L. Luo, M. Lei and L. Tang, Bioresour. Technol., 2017, 245, 266–273 CrossRef CAS PubMed.
- H. Li, J. Hu, Y. Meng, J. Su and X. Wang, Sci. Total Environ., 2017, 603–604, 39–48 CrossRef CAS PubMed.
- L. Tang, J. Yu, Y. Pang, G. Zeng, Y. Deng, J. Wang, X. Ren, S. Ye, B. Peng and H. Feng, Chem. Eng. J., 2018, 336, 160–169 CrossRef CAS.
- L. Dai, W. Zhu, L. He, F. Tan, N. Zhu, Q. Zhou, M. He and G. Hu, Bioresour. Technol., 2018, 267, 510–516 CrossRef CAS PubMed.
- M. A. Zazycki, M. Godinho, D. Perondi, E. L. Foletto, G. C. Collazzo and G. L. Dotto, J. Cleaner Prod., 2018, 171, 57–65 CrossRef CAS.
- L. C. A. Oliveira, C. V. Z. Coura, I. R. Guimarães and M. Gonçalves, J. Hazard. Mater., 2011, 192, 1094–1099 CrossRef CAS PubMed.
- I. C. Kantarli and J. Yanik, J. Hazard. Mater., 2010, 179, 348–356 CrossRef CAS PubMed.
- K. J. Sreeram, S. Saravanabhavan, J. R. Rao and B. U. Nair, Ind. Eng. Chem. Res., 2004, 43, 5310–5317 CrossRef CAS.
- N. Konikkara, L. J. Kennedy and J. J. Vijaya, J. Hazard. Mater., 2016, 318, 173–185 CrossRef CAS PubMed.
- A. C. Martins, O. Pezoti, A. L. Cazetta, K. C. Bedin, D. A. S. Yamazaki, G. F. G. Bandoch, T. Asefa, J. V. Visentainer and V. C. Almeida, Chem. Eng. J., 2015, 260, 291–299 CrossRef CAS.
- J. Wang and S. Kaskel, J. Mater. Chem., 2012, 22, 23710–23725 RSC.
- W.-J. Liu, H. Jiang and H.-Q. Yu, Chem. Rev., 2015, 115, 12251–12285 CrossRef CAS PubMed.
- H. M. Jang, S. Yoo, Y.-K. Choi, S. Park and E. Kan, Bioresour. Technol., 2018, 259, 24–31 CrossRef CAS PubMed.
- M. Taheran, M. Naghdi, S. K. Brar, E. J. Knystautas, M. Verma, A. A. Ramirez, R. Y. Surampalli and J. R. Valero, Sci. Total Environ., 2016, 571, 772–777 CrossRef CAS PubMed.
- Y. Wang, S. Gao, X. Zang, J. Li and J. Ma, Anal. Chim. Acta, 2012, 716, 112–118 CrossRef CAS PubMed.
- I. Made Joni, M. Vanitha, P. Camellia and N. Balasubramanian, Diamond Relat. Mater., 2018, 88, 129–136 CrossRef.
- A. C. Ferrari and D. M. Basko, Nat. Nanotechnol., 2013, 8, 235 CrossRef CAS PubMed.
- K.-T. Wu, P.-H. Wu, F.-C. Wu, R.-L. Jreng and R.-S. Juang, Chem. Eng. J., 2013, 221, 373–381 CrossRef CAS.
- A. B. Albadarin, M. N. Collins, M. Naushad, S. Shirazian, G. Walker and C. Mangwandi, Chem. Eng. J., 2017, 307, 264–272 CrossRef CAS.
- C. Peiris, S. R. Gunatilake, T. E. Mlsna, D. Mohan and M. Vithanage, Bioresour. Technol., 2017, 246, 150–159 CrossRef CAS PubMed.
- Y. Zhou, X. Liu, L. Tang, F. Zhang, G. Zeng, X. Peng, L. Luo, Y. Deng, Y. Pang and J. Zhang, J. Hazard. Mater., 2017, 333, 80–87 CrossRef CAS PubMed.
- E. Molis, O. Barrès, H. Marchand, E. Sauzéat, B. Humbert and F. Thomas, Colloids Surf., A, 2000, 163, 283–292 CrossRef CAS.
- Q. Liu, L.-B. Zhong, Q.-B. Zhao, C. Frear and Y.-M. Zheng, ACS Appl. Mater. Interfaces, 2015, 7, 14573–14583 CrossRef CAS PubMed.
- D. Reichenberg, J. Am. Chem. Soc., 1953, 75, 589–597 CrossRef CAS.
- R. A. Figueroa, A. Leonard and A. A. MacKay, Environ. Sci. Technol., 2004, 38, 476–483 CrossRef CAS PubMed.
- R. A. Figueroa and A. A. MacKay, Environ. Sci. Technol., 2005, 39, 6664–6671 CrossRef CAS PubMed.
- S. A. Sassman and L. S. Lee, Environ. Sci. Technol., 2005, 39, 7452–7459 CrossRef CAS PubMed.
- S. R. Martin, Biophys. Chem., 1979, 10, 319–326 CrossRef CAS PubMed.
- L. A. Mitscher, Arch. Pharm., 1978, 312, 719 Search PubMed.
- H. C. Wells, K. H. Sizeland, R. L. Edmonds, W. Aitkenhead, P. Kappen, C. Glover, B. Johannessen and R. G. Haverkamp, ACS Sustainable Chem. Eng., 2014, 2, 1864–1870 CrossRef CAS.
- N. Le-Minh, S. J. Khan, J. E. Drewes and R. M. Stuetz, Water Res., 2010, 44, 4295–4323 CrossRef CAS PubMed.
- G. Ersan, O. G. Apul, F. Perreault and T. Karanfil, Water Res., 2017, 126, 385–398 CrossRef CAS PubMed.
- Y. Zhou, O. G. Apul and T. Karanfil, Water Res., 2015, 79, 57–67 CrossRef CAS PubMed.
- J. Rivera-Utrilla, C. V. Gómez-Pacheco, M. Sánchez-Polo, J. J. López-Peñalver and R. Ocampo-Pérez, J. Environ. Manage., 2013, 131, 16–24 CrossRef CAS PubMed.
- M. C. Biesinger, B. P. Payne, A. P. Grosvenor, L. W. M. Lau, A. R. Gerson and R. S. C. Smart, Appl. Surf. Sci., 2011, 257, 2717–2730 CrossRef CAS.
- S. Yang, S. Wang, X. Liu and L. Li, Carbon, 2019, 147, 540–549 CrossRef CAS.
- L. Ji, W. Chen, L. Duan and D. Zhu, Environ. Sci. Technol., 2009, 43, 2322–2327 CrossRef CAS PubMed.
Footnote |
| † Electronic supplementary information (ESI) available. See DOI: 10.1039/c9ra07289f |
| This journal is © The Royal Society of Chemistry 2019 |

