 Open Access Article
Current recovery from sewage wastewater using electrochemically oxidized graphite felt†
Naoko Yoshida *a,
Yasushi Miyatab and
Kazuki Iidac
aDepartment of Civil Engineering, Nagoya Institute of Technology, Nagoya, Aichi, Japan. E-mail: yoshida.naoko@nitech.ac.jp
bNagoya Municipal Industrial Research Institute, 3-4-41, Rokuban, Atsuta-ku, Nagoya 456-0058, Japan
cNippon Koei Co., Ltd., 1-14-6 Kudankita, Chiyoda-ku, Tokyo 102-8539, Japan
First published on 29th November 2019
Abstract
The oxidation of a carbon anode has been reported to enhance electricity recovery in a microbial fuel cell (MFC). This study investigates the applicability of electrochemically oxidized graphite felt (EOGF) as the anode for the recovery of electricity from sewage wastewater when polarized at 0.2 V during MFC operation. EOGFs were prepared by polarizing graphite felt (GF) at 2 V in 1% sulfuric acid or nitric acid. The nitric acid-treated EOGF inoculated with an sewage sludge produced a maximum current of 110 μA cm−3, which exceeds that produced by the original GF (91 μA cm−3) under electrochemical cultivation at 0.2 V vs. Ag/AgCl. This outcome is attributed to a decrease in charge-transfer resistance and an increase in the capacitance of the anode. In contrast, electrochemical oxidation did not affect the chemical oxygen demand (COD) removal rate or the microbial community structure of the anode. The MFC equipped with the EOGF delivered 340–560 mW m−3-MFC of electricity during operation in the drainage water channel of a primary sedimentation tank, which corresponds to 11–15 μA cm−3 of current density. The lower current produced in the MFC compared to that observed during electrochemical cultivation indicates that factors other than the anode material restrict current production in the MFC. Even with the small amount of generated electricity, when operated for more than three days, the MFC provides a positive net energy balance when integrated with post-aeration treatment.
1. Introduction
Microbial fuel cells (MFCs) have received much attention for applications in sewage wastewater treatment systems.1–3 Characteristically, an MFC has a single chamber containing an anode in wastewater and an oxygen-reducing cathode that is exposed to the atmosphere.3–5 In general, microbes in the anodic chamber oxidize organic matter and negatively charge the anode through extracellular electron transfer.6 The anode in an MFC functions as a collector of the electrons transferred from microbial cells and also as a carrier that holds the microbial cells. Hence, the anode requires good microbe affinity and a large specific surface area or 3D-structure that facilitates the adhesion of a large number of microbial cells. The surface chemistry of the anode is important for the formation of a microbial biofilm on the electrode, which is triggered by the adhesion of microbial cells through hydrogen bonding, electrostatic, and van der Waals forces.7Carbon-based anodes are becoming increasingly popular and are advantageous in terms of their commercial availability in various forms, such as felt, brush, cloth, and granules,8,9 although non-carbon anodes are still being optimized for practical applications.10 Focusing on the affinity of the electrode toward microbes, a charged and hydrophilic carbon-electrode surface enhances the adhesion of electrochemically active microbes, such as Geobacter species, which can be achieved by chemical oxidation.7 Graphene oxide (GO), the oxidized form of graphene and the ultimate unit of single carbon sheets exfoliated by the chemical oxidation of graphite, has been demonstrated to exhibit considerably higher and more-stable energy production than graphite.11–16 This superior performance is attributable to the selective growth of electrochemically active bacteria,13 better biofilm growth, greater capacity, and a much smaller charge-transfer resistance.16 However, it requires several weeks for the microbial reduction of GO and its subsequent use as an anode; hence, the preparation process needs to be improved for practical applications. A more practical procedure involves oxidizing the surface of a carbon electrode by heating,17 acid soaking,17 or electrochemical means.18–22
In this study, we prepared and evaluated the performance of electrochemically oxidized graphite felt (EOGF), an alternative 3D-carbon anode prepared from GO. Firstly, the prepared EOGFs were evaluated as anodes for the recovery of electricity from sewage wastewater under polarization using a potentiostat, after which they were polarized in an operating MFC. The EOGFs were first evaluated during current recovery from sewage wastewater at a constant voltage by comparing them to the original graphite felt (GF) devoid of treatment. The GF and EOGF acclimated with sewage sludge were analyzed by cyclic voltammetry (CV) and electrochemical impedance spectroscopy (EIS). Furthermore, electricity production was evaluated in an MFC floating in the drainage channel of a primary sedimentation tank of a sewage wastewater treatment plant. The MFC was also run as a batch reactor to evaluate organic-matter reduction.
2. Experimental
2.1 Preparing the EOGFs
To prepare the EOGF, GF (ϕ 3.0 cm × 1.0 cm) was suspended as the working electrode in a 900 mL vessel filled 1.0% nitric acid or 1% sulfuric acid. Platinum wire and an Ag/AgCl electrode were used as the counter and reference electrodes, respectively. The GF was electrochemically oxidized by polarizing it at +2.0 V vs. Ag/AgCl for 30 min, during which time the current was recorded by a data logger in one-minute intervals. The EOGF was removed and washed five times by immersion in MilliQ water, followed by air drying overnight. A piece was cut from the EOGF and examined by X-ray photoelectron spectroscopy (XPS) using a Versa Probe PHI-5000 (ULVAC-PHI Inc., Osaka, Japan) instrument as described previously.15 To prepare the MFC anode, three GF sheets (10 × 70 × 0.4 cm) were electrochemically oxidized by polarization overnight (17 h) at +2.0 V vs. Ag/AgCl in 1% nitric acid. The EOGF sheets were washed with MilliQ water as described above and set in the MFC. The GF and two EOGFs were also observed by scanning electron microscopy (SEM) as described previously.13 To observe biofilms, the anodes polarized for 7 days were observed.2.2 Electrochemical cultivation
The EOGF of smaller size (ϕ 3.0 cm × 1.0 cm) was suspended as the working electrode in a 900 mL glass bottle filled with sewage wastewater. Platinum wire and an Ag/AgCl electrode were used as counter and reference electrodes, respectively. The EOGF was inoculated with a 1 mL aliquot of a sewage-sludge suspension by injection with a syringe. The EOGF was then polarized at +0.2 V vs. Ag/AgCl and the current was recorded by a data logger at 60 min intervals. Every week, 1 mL of the culture was sampled and analyzed to determine the chemical oxygen demand (COD),23 as described below.2.3 Electrochemistry
The GF or EOGF and sewage sludge complexes were subjected to CV and EIS using an HZ-7000 electrochemical measurement system (Hokuto Denko, Tokyo, Japan) as described previously.13 CV traces were acquired at a scan rate of 0.2 mV s−1 in the −400 to 600 mV potential range, while EIS was performed between 100 kHz and 0.5 mHz at 200 mV, with a 20 mV alternating current amplitude.2.4 Microbial community analysis
DNA was extracted from the anodes of the original GF and EOGFs that had been polarized for more than 45 d. Approximately 150 bps of partial 16S rRNA gene were amplified using the 515F and 806R bacterial and archaeal consensus primers, and sequenced using the Illumina Miseq platform, as described previously.24 An operational taxonomic unit (OTU) is defined as a phylogenetic group with ≥97% sequence similarity and the proportion of each OTU in the total reads were determined.2.5 Electricity recovery by EOGF in tuber MFCs
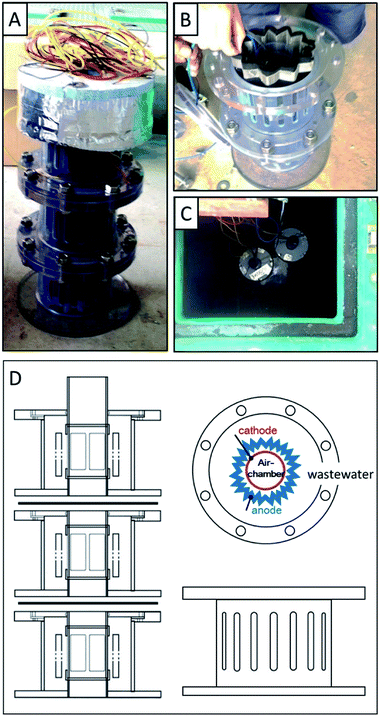
Three tuber MFC units were vertically connected and assembled to form one MFC package. The single MFC used in this study was tubular in shape (ϕ 22 cm × 13 cm) with an air chamber core (ϕ 6.0 cm × 6.5 cm). The air core was a tubular frame surrounded by a cathode composed of carbon-cloth supporting 0.5 mg cm−2 of platinum, EOGF-sheet folded bellows, and a guard mesh (Fig. 1).The MFC package had a styrene-foam floater on top and the three MFC units (i.e., top, middle, and bottom) were placed 0–13 cm, 13–26 cm, and 26–39 cm from the surface of the water. The MFC package was installed in the drainage channel of the primary sedimentation tank in a sewage wastewater treatment plant. The anode was immersed in the sewage-sludge suspension before the MFC was polarized. The anode and cathode were connected via a 47 Ω external resistor, and the voltage was recorded every 60 min.2.6 Batch evaluation of COD-removal rate by a tuber MFC
The MFC package was removed from the water channel and placed in a cylindrical container (ϕ 30 cm × 50 cm) filled with 22 L of drained waste water from a primary sedimentation tank. The MFC was polarized at 25 °C in the container and its organic-compound removal efficiency evaluated. The wastewater in the container was stirred and sampled at three places (upper, middle, and lower) in order to determine the COD. The sampled wastewater was frozen until required for analysis. The COD was measured using the previously described colorimetric assay.14 The coulombic efficiency (CE) was calculated from the change in COD and the recorded voltage as reported previously,1 using the following equation:| CE = Cp/CTi × 100 (%), | (1) |
| CTi = FbiSiv/Mi, | (2) |
![[thin space (1/6-em)]](https://www.rsc.org/images/entities/char_2009.gif) 485 C mol−1 of electrons), bi is the number of moles of electrons produced per mole of oxygen (b = 4), Si (g L−1) is the COD concentration, v (L) is the liquid volume, and Mi is the molecular weight of oxygen (32 g mol−1).
485 C mol−1 of electrons), bi is the number of moles of electrons produced per mole of oxygen (b = 4), Si (g L−1) is the COD concentration, v (L) is the liquid volume, and Mi is the molecular weight of oxygen (32 g mol−1).
3 Results and discussion
3.1 Electrochemical oxidation of graphite felt
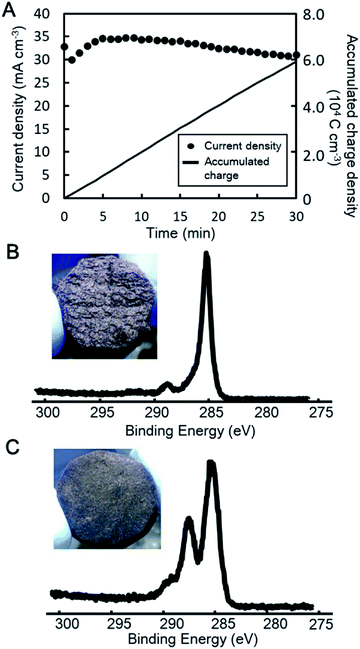
Fig. 2A shows current density as a function of time during the electrochemical oxidation of GF at +2.0 V vs. Ag/AgCl in 1% nitric acid; approximately 30–35 mA cm−3 of current density was produced in 1% nitric acid, while almost no current was produced in water (data not shown). Polarization for 30 min produced about 59![[thin space (1/6-em)]](https://www.rsc.org/images/entities/char_2009.gif) 000 C cm−3 of accumulated charge density. The GF was visually different following electrochemical oxidation, as shown in Fig. 2B and C. The texture of the EOGF is rough and it appears to have lost its surface gloss. However, the SEM images have no apparent changes in the surface morphologies of the GF and EOGFs (Fig. S1†).
000 C cm−3 of accumulated charge density. The GF was visually different following electrochemical oxidation, as shown in Fig. 2B and C. The texture of the EOGF is rough and it appears to have lost its surface gloss. However, the SEM images have no apparent changes in the surface morphologies of the GF and EOGFs (Fig. S1†).
The XPS spectrum of the EOGF is also different to that of the original GF (Fig. 2B and C). The C 1s spectrum of the original GF exhibits a prominent CC or CH peak (285 eV), while EOGF clearly shows a peak ascribable to CCO or OCO (288 eV). The wide-range scan also shows an increase in the intensity of the O 1s peak following electrochemical cultivation (Fig. S2 and S3†). The electrochemical oxidation of GF in sulfuric acid showed similar current behavior (Fig. S4†), while the XPS data 3 reveal that less carbon was oxidized in 1% sulfuric acid (Fig. S5†). The GF immersed for 30 min in sulfuric acid or nitric acid in the absence of polarization was also examined by XPS and showed only single CC or C–H peaks (data not shown). The GF was also polarized at 2.0 V vs. Ag/AgCl in water, although the current was very low and no change in the XPS spectrum was observed (data not shown).
3.2 Electrochemical cultivation using EOGF
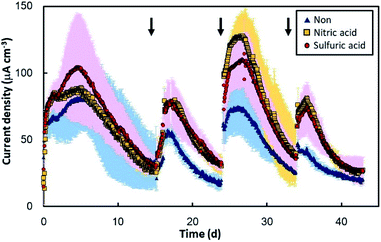
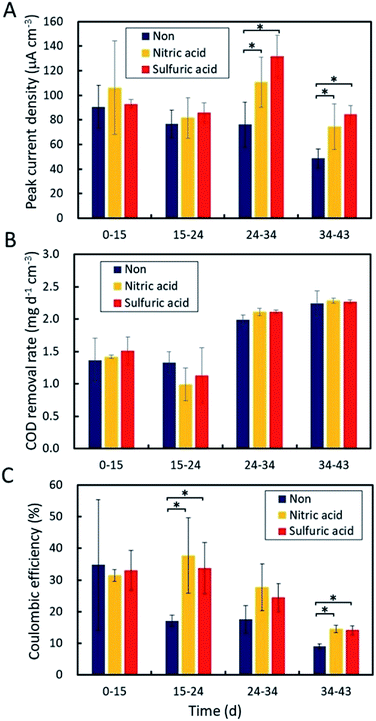
The original GF and the two EOGFs were polarized at +0.2 V vs. Ag/AgCl in sewage wastewater to evaluate the effect of the anode on electricity production. Regardless of the GF type, all three anodes immediately produced current after 10 d of pre-incubation with sewage sludge (Fig. 3). A current density of 60–150 μA cm−3 was observed within 5 d, but gradually decreased until the sewage wastewater was refreshed. At that time, all of anodes had abundant biomass on the surface (Fig. S1†). The current production immediately recovered when fresh wastewater was introduced into each bottle, which suggests that the decline in current is caused by a shortage of organic compounds. This decrease/recovery trend in current production was observed repeatedly for the GF as well as the EOGFs. On the whole, the EOGFs produced higher currents than the original GF over 45 d with three wastewater replacements, and the currents produced by the two EOGFs were equivalent. Fig. 4A shows peak current densities observed during the four cultivation terms according to wastewater replacement. The EOGFs produced peak current densities that were higher than those produced by the GF, while no significant differences between the two EOGFs were observed. These results indicate that the acid used during electrochemical oxidation does not affect the production of current. The COD removal rates were calculated from the initial and final CODs determined immediately after and before wastewater replacement. CODs in the 1.0–2.0 mg d−1 cm−3 range were determined for all bottles, and no significant differences were observed among the cultures incubated with the three types of anode (Fig. 4B). The coulombic efficiencies in the EOGF cultures were in the 14–38% range and are higher than those of the untreated GF (9–35%) (Fig. 4C). These differences appear to reflect the higher current produced in the EOGF cultures.Compared to graphene oxide, the enhancement in electricity production was limited. Specifically, the maximum peak current density obtained using the EOGF was about 150 μA cm−3, while the complex formed between microbially reduced GO and microbes (the rGO complex) was reported previously to deliver a maximum peak current density of 310 μA cm−3.13 The current density produced using the original GF is similar to that obtained previously (89 μA cm−3 on average) and in this study (73 μA cm−3 on average), even when real sewage wastewater sampled in different years was used. These results suggest that electrochemical oxidation is unable to provide an anode material as capable of enhancing electricity production as the rGO complex. Anode modification by electrochemical oxidation for practical applications also requires large amounts of acid and produces acidic wastewater during the washing process, which is another obstacle to scale-up.25 In addition, the washing process can potentially peel the oxidized carbon from the anode surface. Exposure of the anode surface to plasma is an alternative approach, but this method requires a large vacuum chamber. Atmospheric plasma or burning of the anode-surface can be more practically applied to MFCs used in wastewater treatment.
3.3 Cyclic voltammetry and electrochemical impedance spectroscopy of EOGF
Fig. S6† shows the cyclic voltammograms acquired in cultures using the three anodes after polarization for 40 d or more. Catalytic current was produced from −400 mV vs. Ag/AgCl and increased with increasing voltage in all cultures. The original GF exhibited 90–100 μA cm−3 at 200 mV vs. Ag/AgCl, while the two EOGFs produced higher current densities of 170–220 μA cm−3. Comparing the cyclic voltammograms reveals that the EOGFs exhibit larger closed areas than the untreated GF, which indicates that the EOGFs retain more charge in the anode-sludge complex.The charge-transfer resistances (Rct) of the two EOGFs were determined to be <10 Ω cm−3 (Fig. S7†) from the diameters of the semicircles in their respective Nyquist plots. In contrast, the Rct of the untreated GF was >50 Ω cm−3. In ideal electrochemical kinetics reactions, Rct and the angular frequency (ωmax) at the top of semicircle are inversely proportional to capacitance (C), as expressed by the relationship: ωmaxCRct = 1. According to Fig. S7† and this formula, the capacitance of the EOGF must be much higher than that of the untreated GF.
3.4 Analyzing the enriched microbial communities on the anodes
The microbial communities were analyzed using the 16S rRNA gene sequence, which revealed the predominance of Geobacter species, which are well-known bacteria capable of transferring electrons from cells to the electrode in all three anodes (Table S1†). The relative populations of Geobacter-OTUs were 23–31% on average. In addition to these Geobacter species, phylotypes belong to the Desulfovivrio and Desulfomicrobium genera, the Bacteroidales order, and the Holophagaceae family were also commonly observed in the 1.2–5.1% range. The comparative ratios of these OTUs do not significantly differ among the three types of anode. Additionally, the three microbial communities are similar to those observed for the GF-sludge complex polarized at 0.2 V in a past result, rather than those of the GO-sludge complex.13 These results suggest that the electrochemically active microbial communities in the anode with sludge and sewage wastewater are highly stable and have no impact on the electrochemical oxidation of the anode surface.3.5 Electricity recovery by the EOGF in the three MFCs
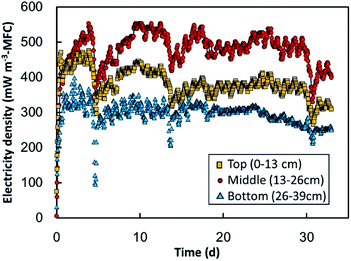
GF sheets were next electrochemically oxidized in 1% nitric acid for use as anodes in the MFC (Fig. S8A†). The current density produced on the GF-sheets was much lower than previously observed, which is ascribable to the larger anode size. Accordingly, the time required for electrochemical oxidation was extended to 17 h, which resulted in an accumulated charge density of approximately 60% of that produced by a small GF block. While XPS revealed the oxidation of carbon in the GF sheets, the CCO or OCO peak was less intense than that observed for the GF block (Fig. S8B†). The EOGF sheets were further used as MFC anodes.Fig. 5 shows the electricity produced in the three MFC units equipped with the EOGF sheets; i.e., the top MFC, middle MFC, and bottom MFC positioned at 0–13 cm, 13–26 cm, and 26–39 cm below the surface of the water, respectively. Electricity production increased dramatically and stabilized within 3 d from floating in the water channel of wastewater. Over 33 d of polarization, the top-, middle-, and bottom MFCs produced average power densities of 440, 560, and 340 mW m−3-MFC volume, respectively, which correspond to 54, 69, and 42 mW m−2-cathode area, respectively. The highest amount of electricity was produced by the middle MFC, which suggests that water depth affects electricity production. Specifically, oxygen dissolved from the water surface, as a competitive electron acceptor, can inhibit electricity recovery to the anode in the top-MFC. In contrast, there is possibly insufficient oxygen in the cathodic chamber of the bottom MFC. The large declines in electricity produced over days 4–5, 13–14, and 29–30 are probably associated with drops in the water level, which exposed the MFCs to the atmosphere. The electricity produced in the three MFCs exhibited small fluctuations (<20%) in amplitude during their daily cycles, which suggest that these fluctuations are the result of daily changes in organic content and the temperature of the sewage wastewater in the channel. Those trends, the highest electricity in the middle MFC and the dairy fluctuation were also observed in the previous study.26
The current density produced in the MFC was about 13 μA cm−3-anode volume on average, and much less than that observed in the EOGF polarized using a potentiostat. This suggests that factors other than the anode material restricted electricity production in the MFC. Possible rate-limiting factors are the separator, cathode, and accessibility of the substrate. The MFC used in this study produced 450 ± 110 mW m−3-MFC (which corresponds to 54 ± 14 mW m−2-cathode area) in the water channel. The value is somewhat lower than the electricity produced (82–170 mW m−2-cathode area) in other MFCs that treat sewage wastewater containing 118–3300 mg L−1 of COD.26
3.6 Batch evaluation of COD removal rate by a tuber MFC
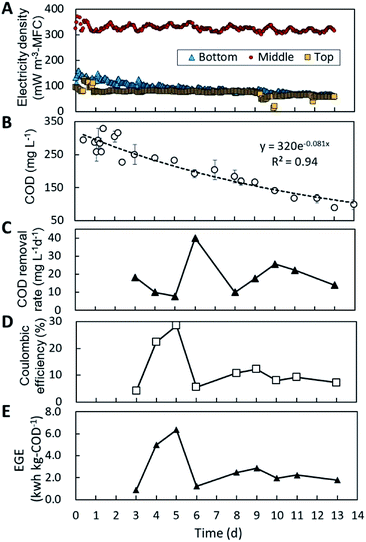
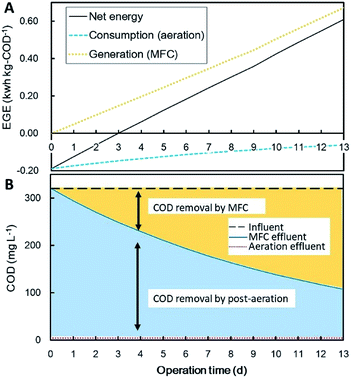
COD removal by the MFC-unit was evaluated using a batch reactor filled with sewage wastewater, the results of which are shown in Fig. 6. Through 13 days of incubation, the top-MFC, middle-MFC and the bottom-MFC produced 73, 330, and 91 mW m−3 of electricity on average, respectively (Fig. 6A). Electricity generation by the MFC in the batch reactor was stable over 13 days, but the currents were less than that observed in the water channel. This is possibly the result of limited substrate availability in the anode biofilm due to interruptions in the continuous flow surrounding the anode. The change in COD concentration in the batch culture revealed a 73% reduction in COD after 13 days of incubation, and fitted a first-order rate formula well (R2 = 0.94) (Fig. 6B). Based on the daily COD levels (Fig. 6C) and electricity production, coulombic efficiency and electricity generation efficiency (EGE) were calculated to be 13% and 2.0 kW h kg-COD−1 on average (Fig. 6D and E). The fluctuations observed for coulombic efficiency and EGE reflect COD removal rather than electricity production.Energy balance was calculated for wastewater treatment by combining batch MFC treatment with post-aeration for different MFC-operating times (0–15 d) (Fig. 7). The values of energy recovery and COD removal by the MFC refer to the batch experimental data displayed in Fig. 6. Energy consumption for the removal of COD by aeration was calculated to be −0.6 kW h kg-COD−1.27,28 The total energy balance calculation indicates that more than three days of MFC operation are required for the net energy balance to become positive when combined with post-aeration.
4. Conclusions
This study evaluated the effect of the electrochemical oxidation of a GF anode on electricity recovery from sewage wastewater under two conditions: polarization using a potentiostat, and with the MFC running. The electrochemical oxidation of GF was found to enhance current production at a stable potential of +0.2 V vs. Ag/AgCl, although the current in the MFC was less than one-tenth of this current. To increase electricity recovery by the MFC, the entire system requires improvement rather than the anode material alone.Conflicts of interest
This study was partially funded by the Nippon Koei Co. Ltd. K. Iida is an employee of Nippon Koei Co. Ltd. We got a patent on the MFC configuration reported in this paper. All authors declare scientific fairness in relation to experimental design and the interpretation of results.Acknowledgements
This study was funded by the GAIA Project, MLIT, Japan, a JSPS KAKENHI (grant number: 26701010, 18K18876). We thank the staff at KOHOKU Wastewater Treatment Plant, Yokohama City, Japan, for providing the anaerobic sludge used in this study. We also thank Y. Takiguchi and N. Shibata for their experimental support.Notes and references
- B. E. Logan, B. Hamelers, R. Rozendal, U. Schröder, J. Keller, S. Freguia, P. Aelterman, W. Verstraete and K. Rabaey, Environ. Sci. Technol., 2006, 41, 5181–5192 CrossRef PubMed.
- B. E. Logan and K. Rabaey, Science, 2012, 337, 686–690 CrossRef CAS PubMed.
- M. Sun, L. F. Zhai, W. W. Li and H. Q. Yu, Chem. Soc. Rev., 2016, 45, 2847–2870 RSC.
- H. Liu, R. Ramnarayanan and B. E. Logan, Environ. Sci. Technol., 2004, 38, 2281–2285 CrossRef CAS PubMed.
- Z. Du, H. Li and T. Gu, Biotechnol. Adv., 2007, 25, 464–482 CrossRef CAS PubMed.
- D. R. Lovley, Annu. Rev. Microbiol., 2012, 66, 391–409 CrossRef CAS PubMed.
- K. Guo, S. Freguia, P. G. Dennis, X. Chen, B. C. Donose, J. Keller, J. J. Gooding and K. Rabaey, Environ. Sci. Technol., 2013, 47, 7563–7570 CrossRef CAS PubMed.
- J. Wei, P. Liang and X. Huang, Bioresour. Technol., 2011, 102, 9335–9344 CrossRef CAS PubMed.
- S. Li, C. Cheng and A. Thomas, Adv. Mater., 2016, 29, 1602547, DOI:10.1002/adma.201602547.
- A. Baudler, I. Schmidt, M. Langner, A. Greiner and U. Schröder, Energy Environ. Sci., 2015, 8, 2048–2055 RSC.
- Y. Goto, N. Yoshida, Y. Umeyama, T. Yamada, R. Tero and A. Hiraishi, Front. Bioeng. Biotech., 2015, 3, 42, DOI:10.3389/fbioe.2015.00042.
- Y. Goto and N. Yoshida, AIP Conf. Proc., 2016, 1709, 020007 CrossRef.
- N. Yoshida, Y. Miyata, A. Mugita and K. Iida, Materials, 2016, 9, 742, DOI:10.3390/ma9090742.
- Y. Goto and N. Yoshida, J. Gen. Appl. Microbiol., 2017, 63, 165–171, DOI:10.2323/jgam.2016.10.001.
- N. Yoshida, Y. Goto and Y. Miyata, C, 2, 15, DOI:10.3390/c2020015.
- N. Yoshida, Y. Miyata, K. Doi, Y. Goto, Y. Nagao, R. Tero and A. Hiraishi, Sci. Rep., 2016, 6, 21867, DOI:10.1038/srep21867.
- H. Cai, J. Wang, Y. Bu and Q. Zhong, J. Chem. Technol. Biotechnol., 2013, 88, 623–628 CrossRef CAS.
- J. Liu, J. Liu, W. He, Y. Qu, N. Ren and Y. Feng, J. Power Sources, 2014, 265, 391–396 CrossRef CAS.
- B. Cercado-Quezada, M. L. Delia and A. Bergel, Electrochem. Commun., 2011, 13, 440–443 CrossRef CAS.
- M. Zhou, M. Chi, H. Wang and T. Jin, Biochem. Eng. J., 2012, 60, 151–155 CrossRef CAS.
- X. Tang, K. Guo, H. Li, Z. Du and J. Tian, Bioresour. Technol., 2010, 102, 3558–3560, DOI:10.1016/j.biortech.2010.09.022.
- M. X. Qiao, Y. Zhang, L. F. Zhai and M. Sun, Chem. Eng. J., 2018, 344, 410–418 CrossRef CAS.
- A. Nurmiyanto, H. Kodera, T. Kindaichi, N. Ozaki, Y. Aoi and A. Ohashi, Microbes Environ., 2017, 32, 260–267 CrossRef PubMed.
- M. Ismaeil, N. Yoshida and A. Katayama, BioMed Res. Int., 2017, 2017, 9191086, DOI:10.1155/2017/9191086.
- Y. Goto and N. Yoshida, Water, 2019, 11, 1803, DOI:10.3390/w11091803.
- M. Sugioka, N. Yoshida and K. Iida, Front. Energy Res., 2019, 7, 91, DOI:10.3389/fenrg.2019.00091.
- Z. He, Environ. Sci. Technol., 2013, 47, 332–333 CrossRef CAS PubMed.
- M. Maktabifard, E. Zaborowska and J. Makinia, Rev. Environ. Sci. Bio/Technol., 2018, 17, 655–689 CrossRef.
Footnote |
| † Electronic supplementary information (ESI) available. See DOI: 10.1039/c9ra07671a |
| This journal is © The Royal Society of Chemistry 2019 |

