 Open Access Article
Corrosion inhibition of mild steel by the hydrolysate of an imidazoline-based inhibitor in CO2-saturated solution
Bin Wang *a,
Min Dub,
Jing Zhangb,
Chengjie Lic,
Jie Liud,
Huanxia Liua,
Rongrong Lia and
Zhuoran Lia
aSchool of Chemistry and Materials Science, Ludong University, Yantai 264025, PR China. E-mail: wb7411@163.com
bCollege of Chemistry and Chemical Engineering, Ocean University of China, Qingdao 266100, PR China
cShandong Peninsula Engineering Research Center of Comprehensive Brine Utilization, Weifang University of Science and Technology, Shouguang 262700, PR China
dCollege of Chemistry and Chemical Engineering, Yantai University, Yantai 264005, PR China
First published on 11th November 2019
Abstract
The synthesized imidazoline phosphate quaternary ammonium salt has low stability, which is spontaneously and rapidly hydrolyzed to the long-chain fatty acid amide (LFA). The hydrolysate (LFA) has been found to be an efficient inhibitor for Q235 steel against CO2 corrosion, which yields a maximum value above 90% at a concentration of 1000 mg L−1. The LFA inhibitor acts as an anodic type inhibitor and its inhibition mechanism is a “negative catalysis effect”. The heteroatoms in the acyl, amine and phosphate groups in the LFA molecule are the active centers to bond with Fe atoms to form a chemisorbed film on the steel surface.
1. Introduction
Carbon steel is used for almost all pipelines and much of the tubing in oil and gas industries, mainly due to its hardness, availability and cost effectiveness.1,2 However, one of the major problems during its usage is the low corrosion resistance in these environments with high concentrations of chlorides and carbon dioxide. CO2 is a naturally occurring component in many oil and gas fields and it could also be present in the oil due to its injection to the reservoir for secondary enhanced oil recovery processes.3,4 In aqueous environments, CO2 dissolves and forms weak carbonic acid. It is well-known that, at a given pH, the weak carbonic acid is significantly more corrosive than strong mineral acids like sulfuric acid and hydrochloric acid, and the acceleration effect can be explained by the increase in electrochemical cathodic reduction generated by H+ and H2CO3.5–7Among different methods to inhibit CO2 corrosion in oil and gas industries, the most-effective and economical option is the injection of corrosion inhibitor, and the major advantage of which is that it can be implemented in situ without disrupting oil and gas production.8–12 Imidazoline and its derivatives are the most frequently used corrosion inhibitors due to their advantages of low toxicity, high-efficiency and easy production.13–17 Despite their wide applications, there is no conclusive answer about the hydrolysis of imidazoline and its derivatives, and there is also doubts about the inhibition effect of the hydrolysate. Butler18 reported that, due to the low stability of the imidazoline ring, up to 80% of the imidazoline has been hydrolyzed after 2–9 days exposure under atmospheric conditions. Martin et al.19 showed that, after brief air exposure and a few weeks of standing, the imidazolines were converted into their amide precursors spontaneously and rapidly. It has also been stated that there is no obvious difference in the inhibition effect of imidazoline and its amide-based products. According to the studies of Watts,20 imidazolines are unstable in the presence of water and more than 90% of which could been hydrolyzed to their amide precursors within 72 hours at ambient temperature. Besides, an increase in pH or temperature can result in the increase in hydrolysis rate.
Take into account the great importance of imidazoline and its derivatives in field applications, it is very necessary to have an in-depth understanding of the actual composition of corrosion inhibitors made from them and the inhibition effect of the hydrolysate. However, only a few studies have been conducted so far. Due to that, it is of great interest to carry out a systematic study. So this work aims at investigation of the effectiveness and mechanism of the hydrolysate of imidazoline-based inhibitor for Q235 steel against CO2 corrosion by using weight-loss method and electrochemical measurements. Besides, Fourier-transform infrared (FT-IR) spectroscopy, X-ray photoelectron spectroscopy (XPS) and scanning electron microscopy (SEM) were also used to characterize the physical and chemical nature of the adsorbed inhibitor film. In addition, several quantum-chemistry calculations were employed to relate the inhibition effect to the molecular properties.
2. Experimental
2.1. Material preparation
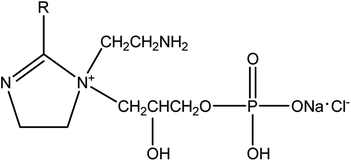
Q235 steel was used as the test material, its composition (wt%) was 0.45 Mn, 0.18 C, 0.02 Si, 0.02 S, 0.01 P, Fe balance. The sample surfaces were abraded with a series of silicon carbide papers up to 1000 grit, and then they were washed with distilled water and degreased in acetone, then dried at room temperature.For increasing the water solubility of imidazoline intermediates, a novel modified imidazoline phosphate quaternary ammonium salt was synthesized in our laboratory following a procedure reported previously.21 The compound was obtained with a yield of 72% and with a purity of 95%, and its structure was shown in Fig. 1.
The test media was 2 wt% NaCl solution, which was prepared using analytical grade reagents with double distilled water. The solution was de-aerated by purging N2 for 2 h and then saturated with CO2 gas, and the pH of the solution was 4.11.
2.2. Weight loss measurement
Three identical specimens (50 × 10 × 3 mm) were used for each test and immersed in 500 mL CO2-saturated solution with the addition of different concentrations of inhibitor at 293 K and 333 K for 72 h. Before and after each test, the coupons were weighed with an analytical balance with a precision of 0.1 mg and the mean weight losses were obtained. The corrosion products on steel surfaces were removed in the descaling liquid.2.3. Electrochemical measurement
The metal samples used as working electrodes for electrochemical measurements were embedded in epoxy resin leaving an exposed surface area of 1 cm2. Electrochemical measurements were carried out on an IM6e electrochemistry workstation (ZAHNER, Germany) and conducted in a conventional three electrode cell, in which the reference electrode was a saturated calomel electrode (SCE) with a Luggin capillary bridge and the counter electrode was made of a platinum foil. Before electrochemical tests, the working electrodes were kept in the electrolyte for 1 h to stabilize the open-circuit potential. Electrochemical impedance spectrum (EIS) tests were performed at different immersion times with perturbation amplitude of 5 mV in the frequency range from 100 kHz to 10 mHz. The scanning range of polarization tests was from −60 mV to 60 mV versus the open-circuit potential with a scanning rate of 1 mV s−1.2.4. Characterization
The samples with dimensions of 10 × 10 × 1 mm were exposed to the CO2-saturated solution in the presence of different concentrations of inhibitor in a closed vessel to form adsorption films on the steel surfaces. The XPS analysis was conducted with a PHI 5300 spectrometer (PerkinElmer, USA) and the specimens were irradiated with AlKα X-rays. All the tests were carried out with a take-off angle of 45° and at a pressure less than 1 × 10⁻⁸ Torr.The corrosion morphologies of the sample surfaces after 72 h immersion in CO2-saturated solution with and without 1000 mg L−1 inhibitor were observed using FE-SEM SU-8010 (Hitachi Ltd., Tokyo, Japan).
FT-IR spectra were performed on a VERTEX 70 FT-IR spectrometer (Bruker Optics, Germany). The spectra were obtained with 64 scans in the spectral region from 4000 to 400 cm−1, and the resolution was 4.0 cm−1.
UV absorption measurements were conducted using a 2450 UV-Vis Spectrophotometer (Shimadzu, Japan) with quartz cell of 1 cm optical path in the spectral region of 190–280 nm. The samples were dispersed in ethanol with ultrasonic, and then the solutions were added into quartz cells. All spectra were determined at 25 °C and corrected for solvent background by calibrating the instrument to the blank solvent.
2.5. Quantum chemical calculations
Chem3D software and Gaussian03 program were used to establish and optimize the molecular structure of inhibitor, respectively. Winmopec2007 program package was used to conduct the quantum chemical calculations through PM6 semi-empirical method.3. Results and discussion
3.1. Hydrolysis of the imidazoline phosphate quaternary ammonium salt
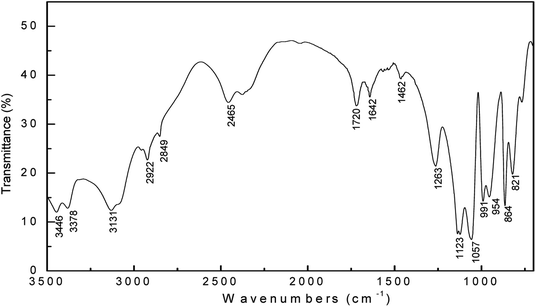
The structural characteristics of the synthesized imidazoline phosphate quaternary ammonium salt after brief air exposure and two weeks of age in the dryer were confirmed by FT-IR spectroscopy, as shown in Fig. 2. The peak at 3378 cm−1 corresponds to N–H stretching vibration. There are peaks at 2922 and 2849 cm−1 due to the characteristic asymmetric and symmetric stretching vibrations of the CH2 groups, respectively.22 The peak at 1642 cm−1 can be assigned to the amide band (−CONH). The P![[double bond, length as m-dash]](https://www.rsc.org/images/entities/char_e001.gif) O stretching vibration absorption peak is at 1263 cm−1, and these peaks at 1123, 1057, 991 and 954 cm−1 are assumed to be for P–O–C bending vibration in the molecule.23,24 It is important to note the absence of the peak of C
O stretching vibration absorption peak is at 1263 cm−1, and these peaks at 1123, 1057, 991 and 954 cm−1 are assumed to be for P–O–C bending vibration in the molecule.23,24 It is important to note the absence of the peak of C![[double bond, length as m-dash]](https://www.rsc.org/images/entities/char_e001.gif) N bond in the spectra, this suggests that the synthesized imidazoline-based inhibitor is hydrolyzed into its amide-based compound.
N bond in the spectra, this suggests that the synthesized imidazoline-based inhibitor is hydrolyzed into its amide-based compound.
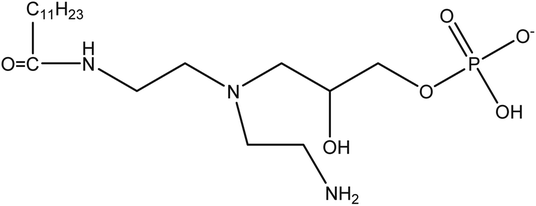
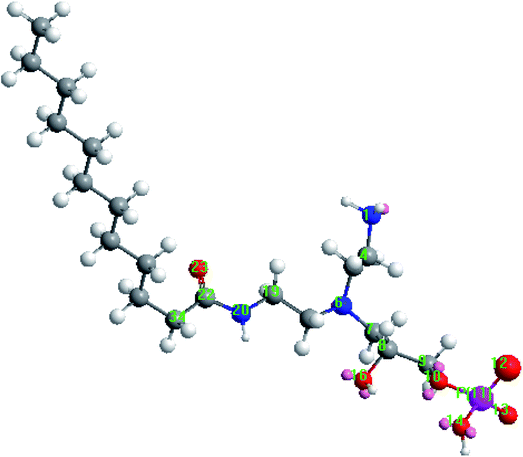
In order to further research the hydrolysis behavior of the synthesized imidazoline-based inhibitor, the UV absorption measurements were conducted. Fig. 3 shows the UV absorption spectrum (190–280 nm) of imidazoline phosphate quaternary ammonium salt before and after aging. The sample before aging exhibits maxima at 226 nm, together with a weak feature at 203 nm. The former represents the characteristic absorption peak of imidazoline, which is attributed to the n → π* transition of nitrogen atom and π → π* transition of the five-membered ring.25,26 The weak peak at 203 nm belongs to the amide.27 However, as to the sample after aging, the characteristic absorption peak of imidazoline disappears, and the curve shows only a higher peak which is assigned to amide. So the result of UV measurements is consistent with that of FT-IR spectroscopy. After brief air exposure and two weeks of age, the synthesized imidazoline-based inhibitor is spontaneously and rapidly hydrolyzed into its amide-based compound, namely the long-chain fatty acid amide (LFA), and the structure of which is shown in Fig. 4.
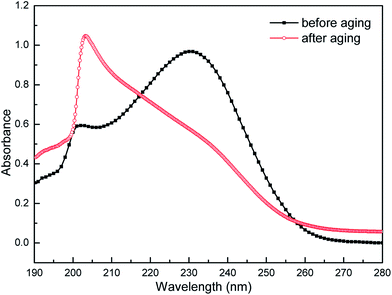 | ||
| Fig. 3 UV absorption spectrum of imidazoline phosphate quaternary ammonium salt before and after aging. | ||
In the presence of water, which is from the imidazoline compound itself under the condition of drying incompletely or from the surrounding air, the hydroxide ion produced by water decomposition is simply attracted to the imidazoline molecule by strong electrostatic forces, and the hydrolysis reaction occurs as show in Fig. 5.28 Therefore, as the results shown in the FT-IR and UV absorption spectrums, after two weeks of age, most of the imidazoline compound is hydrolyzed into its amide-based compound, and which is also the research object in this work.
3.2. Weight loss measurement
The values of corrosion rate (υ) and inhibition efficiency (η) which are obtained by weight loss measurements at 293 K and 333 K after a 72 h immersion period are presented in Table 1. The values of υ and η are calculated based on the following equations:29
 | (1) |
 | (2) |
| Concentration (mg L−1) | 293 K | 333 K | ||
|---|---|---|---|---|
| ν (mm y−1) | η (%) | ν (mm y−1) | η (%) | |
| Blank | 0.3289 | 0.6153 | ||
| 50 | 0.2136 | 35.1 | 0.4250 | 30.9 |
| 100 | 0.1617 | 50.8 | 0.3308 | 46.2 |
| 200 | 0.1168 | 64.5 | 0.2731 | 55.6 |
| 400 | 0.0799 | 75.7 | 0.2374 | 61.4 |
| 700 | 0.0348 | 89.4 | 0.1251 | 79.7 |
| 1000 | 0.0220 | 93.3 | 0.0562 | 90.9 |
The data listed in Table 1 show that the LFA inhibitor can protect Q235 steel from CO2 corrosion efficiently both at 293 K and 333 K. The corrosion rate decreases and inhibition efficiency increases with increasing inhibitor concentration at both temperatures. This trend may be due to the fact that the higher the concentration, the greater the amount of adsorption of LFA molecules on the steel surface and the less the number of the active sites available for corrosion. The maximum η of 1000 mg L−1 LFA are 93.3% at 293 K and 90.9% at 333 K, respectively. Inspection of Table 1 also exhibits that the corrosion rate increases, while the inhibition efficiency decreases with increasing temperature from 293 K to 333 K at the same concentration. The former phenomenon could be explained by the fact that the increase in temperature accelerates all the corrosion processes like transfer process of reactive species from bulk solution to the steel surface and chemical and electrochemical reactions.15 The decreasing inhibition efficiency with temperature could be due to that the increase in temperature shifts the adsorption–desorption equilibrium of LFA adsorption to the desorption process, resulting in a lower surface coverage by LFA molecule, thus decreasing the inhibitive action.30
3.3. Potentiodynamic polarization
The weak polarization curves for Q235 steel after 24 h of immersion in CO2-saturated solution with the addition of varying concentrations of LFA inhibitor at 293 K and 333 K are shown in Fig. 6. The curves are shifted to more positive potential region with the increase in inhibitor concentration, and the maximum shifts of Ecorr values are more than 85 mV at both temperatures. Table 2 shows the values of all kinetic parameters such as corrosion potential (Ecorr), anodic and cathodic Tafel slopes (ba, bc) and corrosion current density (Icorr). The anodic and cathodic interaction coefficients (fa, fc) and inhibition efficiency (η%) are calculated using the following equations based on the electrochemical theory:31
 | (3) |
 | (4) |
 | (5) |
 | (6) |
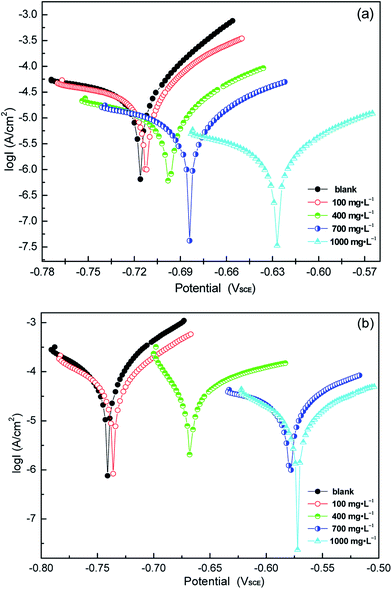 | ||
| Fig. 6 Weak polarization curves of Q235 steel in CO2-saturated solution with varying concentrations of LFA inhibitor at (a) 293 K and (b) 333 K. | ||
| C [mg L−1] | Ecorr [mV SCE] | ba [mV dec−1] | bc [mV dec−1] | icorr [μA cm−2] | fa | fc | η% |
|---|---|---|---|---|---|---|---|
| 293 K | |||||||
| Blank | −716 | 48.4 | 447.9 | 46.5 | |||
| 100 | −712 | 82.2 | 226.1 | 34.8 | 0.6193 | 0.7646 | 25.2 |
| 400 | −697 | 115.2 | 256.4 | 18.5 | 0.1608 | 0.4378 | 60.2 |
| 700 | −683 | 135.8 | 381.8 | 7.1 | 0.0316 | 0.1801 | 84.7 |
| 1000 | −628 | 133.3 | 295.6 | 2.9 | 0.0010 | 0.0981 | 93.8 |
![[thin space (1/6-em)]](https://www.rsc.org/images/entities/char_2009.gif) |
|||||||
| 333 K | |||||||
| Blank | −742 | 57.5 | 443.2 | 126.3 | |||
| 100 | −735 | 90.3 | 193.4 | 98.9 | 0.5915 | 0.8121 | 21.7 |
| 400 | −668 | 121.4 | 214.0 | 65.0 | 0.0266 | 0.7560 | 48.5 |
| 700 | −579 | 98.4 | 348.3 | 32.9 | 0.0004 | 0.6076 | 74.0 |
| 1000 | −573 | 139.7 | 200.5 | 14.5 | 0.0001 | 0.2768 | 88.5 |
| C [mg L−1] | Blank | 100 | 400 | 700 | 1000 |
| Ea [kJ mol−1] | 20.27 | 21.19 | 25.49 | 31.10 | 32.64 |
3.4. Electrochemical impedance spectroscopy (EIS) measurement
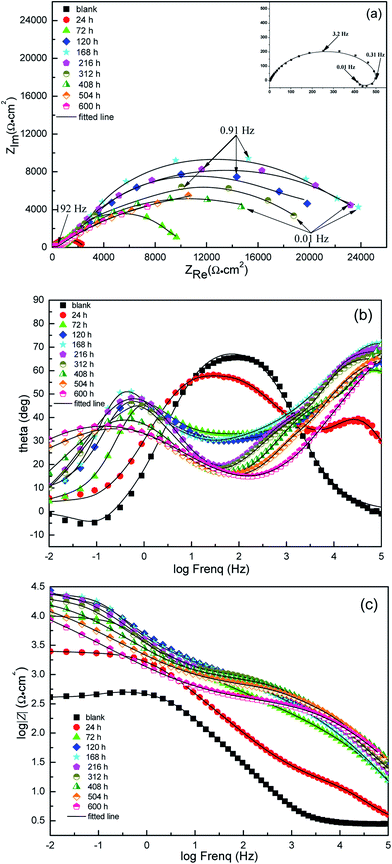
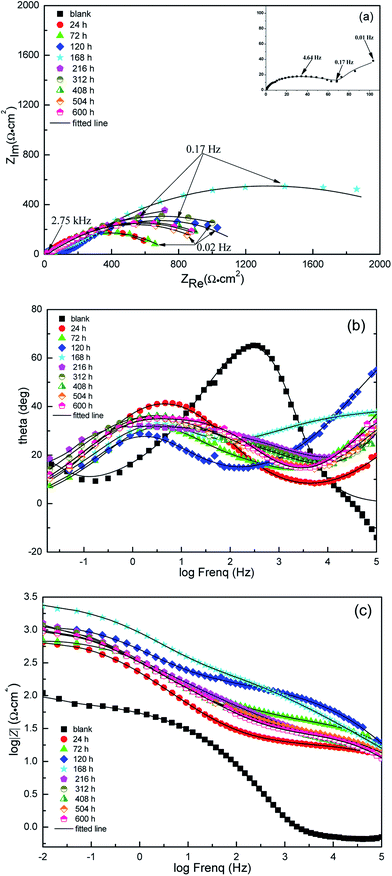
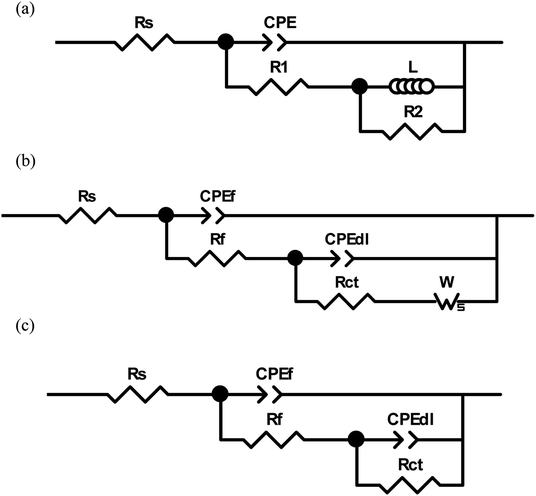
From a practical point of view, it is very necessary to understand the aftereffect of the used corrosion inhibitors. So EIS method was used to study the growth and decay laws of the LFA inhibitor film. Fig. 7 and 8 display the results of EIS test in form of both Nyquist and Bode plots with different immersion times at 293 K and 333 K, respectively. The Nyquist plot in solution without inhibitor at 293 K is characterized by a depressed semicircle and an inductive loop at high and low frequencies, separately. The existence of inductive loop is usually related to the adsorption of an intermediate product (FeOHads) during the active dissolution of carbon steel.34,35 The depressed semicircle forms with the centre under the real axis are characteristic of solid electrodes and are due to geometrical factors such as roughness and inhomogeneities of electrode surface.36,37 The plots for sample steel without LFA inhibitor at 333 K and with the addition of 1000 mg L−1 LFA at the immersion time of 504 and 600 h at 293 K exhibit one depressed semicircle at high frequency region and a long tail with an angle of about 45° to the real-axis at low frequencies. This behavior suggests that the corrosion process is under diffusion control. It also can be seen that, after the addition of LFA inhibitor, the phase angle plots show two peaks, which indicates that there exits two time constants. The existence of time constant at high frequency can be ascribed to the presence of LFA inhibitor film formed on the sample surface.38 Therefore, the corresponding equivalent circuits used for analyzing the EIS spectra are exhibited in Fig. 9. Fig. 9(a) and (b) are employed for the Nyquist plots characterized by an inductive loop and a long tail at low frequency region, respectively. Fig. 9(c) is used for all the other Nyquist plots. In which, Rs represents the solution resistance, R1 + R2 corresponds to the charge transfer resistance Rct, L is the inductance, Zw is the Warburg impedance, and Rf is correlated with the film resistance.CPE is the constant phase element, which is introduced into the circuit to compensate for non-homogeneity in the system. CPE is defined in impedance as follow:
| ZCPE = Y−1 (jω)−n | (7) |
| Cdl = Y(2πfmax)n−1 | (8) |
 | (9) |
| Temperature (K) | Time (h) | Cdl (μF cm−2) (n1) | Rct (kΩ cm2) | Rf (Ω cm2) | Zw (kΩ cm2) | η (%) |
|---|---|---|---|---|---|---|
| 293 | Blank | 75.4(0.76) | 0.384 | — | — | |
| 24 | 17.3(0.78) | 2.782 | 23.7 | — | 86.2 | |
| 72 | 3.8(0.78) | 10.520 | 537.6 | — | 96.3 | |
| 120 | 3.5(0.86) | 23.432 | 844.6 | — | 98.4 | |
| 168 | 2.5(0.93) | 28.436 | 883.4 | — | 98.6 | |
| 216 | 6.9(0.94) | 26.369 | 876.3 | — | 98.5 | |
| 312 | 7.2(0.88) | 20.436 | 667.3 | — | 98.1 | |
| 408 | 12.6(0.89) | 14.961 | 573.4 | — | 97.4 | |
| 504 | 16.8(0.78) | 9.704 | 519.4 | 1.247 | 96.0 | |
| 600 | 19.1(0.77) | 3.987 | 328.6 | 1.362 | 90.4 | |
| 333 | Blank | 447.1(0.82) | 0.097 | 13.4 | 13.23 | |
| 24 | 380.1(0.83) | 0.639 | 15.9 | — | 84.8 | |
| 72 | 149.5(0.84) | 0.758 | 44.7 | — | 87.2 | |
| 120 | 65.9(0.86) | 1.376 | 115.8 | — | 93.0 | |
| 168 | 32.8(0.89) | 2.606 | 313.1 | — | 96.3 | |
| 216 | 39.8(0.91) | 1.724 | 217.3 | — | 94.4 | |
| 312 | 87.9(0.88) | 1.443 | 97.1 | — | 93.3 | |
| 408 | 120.6(0.85) | 1.094 | 37.4 | — | 91.1 | |
| 504 | 119.5(0.82) | 1.086 | 24.6 | — | 91.0 | |
| 600 | 128.7(0.82) | 0.986 | 21.4 | — | 90.2 |
The Rct values decrease sharply from 293 K to 333 K at the same immersion time, leading to a decrease in inhibition efficiency. Furthermore, the Cdl values increase with the increase in temperature which suggests that less LFA molecules are adsorbed on Q235 sample surface at higher temperature.40 It is also observed from Table 4 that, after the addition of LFA inhibitor, the Rf and Rct values increase significantly at both studied temperatures from 24 to 168 h, suggesting the increase in inhibition efficiencies within 168 h, and which reach the maximum values of 98.6% at 293 K and 96.3% at 333 K, respectively. However, the change trend of the Cdl values is opposite to that of Rct. The increase in inhibition efficiencies and the decrease in Cdl values can be ascribed to the adsorption of LFA molecules at metal/solution interface by replacing of water molecules to form an inhibitor film,41 and the film is further enhanced by the increase in LFA adsorption to the steel surface with immersion time. After 168 h, the Rct values decrease and Cdl values increase slightly with further increasing immersion time, this suggests that the desorption of the adsorbed LFA molecules on the steel surface occurs until reaching the dynamic equilibrium of adsorption and desorption. But even after 600 h of immersion time, the inhibition efficiencies at both temperatures are still above 90%, which confirms again that LFA is an effective corrosion inhibitor for Q235 steel against CO2 corrosion and the inhibitor has long active period which is very beneficial and necessary for field applications.
3.5. SEM analysis
The surface morphologies of Q235 specimens after immersion for 72 h in the test solution at 293 K and 333 K were examined using SEM, as exhibited in Fig. 10 and 11. In the absence of inhibitor, the surfaces are seriously damaged and roughened because of the rapid and aggressive corrosion attack and which results in the formation of large numbers of corrosion products. The corrosion products with different morphologies cover the specimen surfaces completely at 293 K and 333 K, respectively. In the case of adding 1000 mg L−1 LFA into the solution, the thin inhibitor films are observed clearly to be present on the sample surfaces as shown in Fig. 11, and the sample surfaces are well protected, even some original grinding scratches are observed. Furthermore, the inhibitor film formed at 293 K seems to be more continuous and compacted than that at 333 K, which may be also the reason for the higher inhibition efficiencies at 293 K.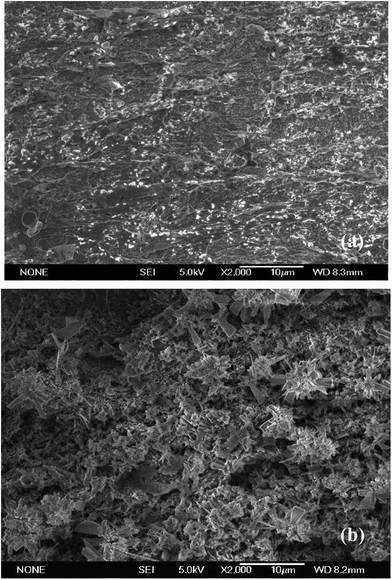 | ||
| Fig. 10 SEM images for Q235 steel after being corroded in CO2-saturated 2% NaCl solution for 72 h at (a) 293 K and (b) 333 K. | ||
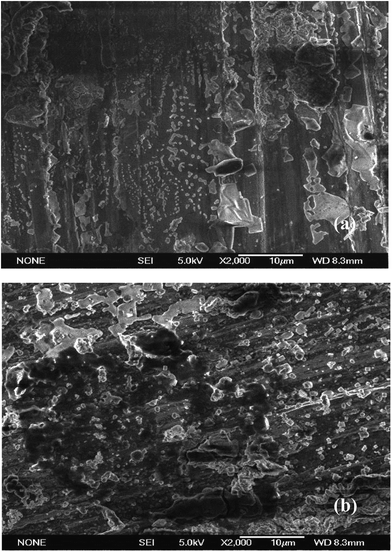 | ||
| Fig. 11 SEM images for Q235 steel after being corroded in CO2-saturated 2% NaCl solution in the presence of 1000 mg L−1 LFA inhibitor for 72 h at (a) 293 K and (b) 333 K. | ||
3.6. XPS analysis
XPS technique was employed in order to study the composition of the adsorbed layer on the sample surface after addition of 1000 mg L−1 LFA inhibitor. The results of XPS analysis were presented in Fig. 12. The Wide-scan XPS spectra provides evidence of the presence of C, O, N and Fe, among which, the signals of C and O are detected with higher intensities. The presence of C and N peaks at both temperatures are due to that they are the basic component of the LFA inhibitor structure, and which is also the possible reason why the P element is not detected.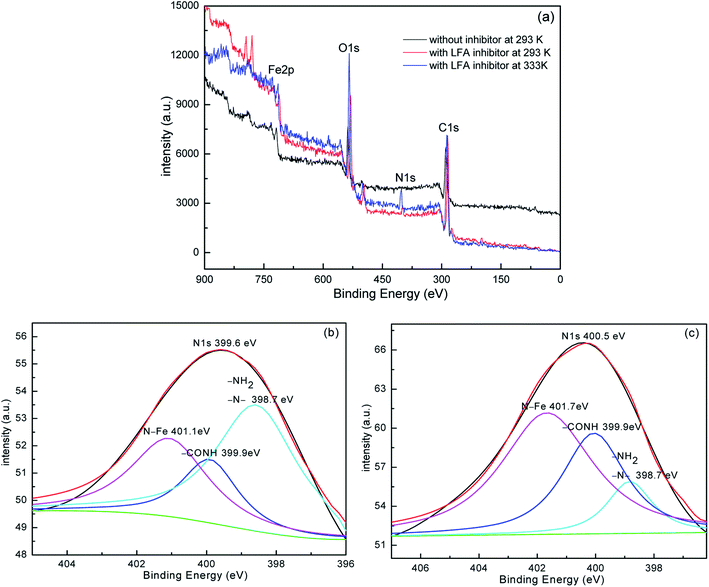 | ||
| Fig. 12 XPS spectra of Q235 steel after 24 h immersion in CO2-saturated solution: (a) Wide-scan XPS spectra, (b) High-resolution spectra of N1s at 293 K and (c) 333 K. | ||
The results of bonding energies are listed in Table 5. The peaks of C1s at 284.6 eV are used to correct for the charge effects. The presence of N1s peaks at 399.6 and 400.5 eV provide clear evidence that the LFA molecules have been chemically adsorbed on the sample surface, since the physically adsorbed LFA molecules have been already rinsed off by triply distilled water when the samples are taken out of the test solution. It can also be observed that the bonding energies of N1s at both temperatures are higher than that of N1s in pure imidazoline molecule,42 whereas the binding energies of Fe2p for the inhibited sample are smaller than that for the uninhibited sample. Therefore, it can be deduced that the Fe atoms on the steel surface and N atoms in the LFA molecular occur chemical coordination. Thus the N1s peaks can be fitted into three peaks as shown in Fig. 12(b) and (c) at 293 K and 333 K, respectively. The lower binding energy at 398.7 eV can be ascribed to the presence of –NH2 and tertiary N atom in the LFA molecule, whereas the peak at 399.9 eV is assigned to the –CONH group.43,44 Besides, the peak at 401.1 eV at 293 K and 401.7 eV at 333 K correspond to the N atoms interacted with the Fe surface.45,46 The binding energies of Fe2p peaks suggest that the rust layer on the steel surface is composed of a mixture of FeO, FeCO3, Fe3O4, Fe2O3 and FeOH.43,44,47 During the process of preparing specimens, it is inevitable for Fe to be oxidized because of its activity. Besides, the main ingredient of corrosion products for steel exposed to the CO2-saturated solution is FeCO3, and FeCO3 can be hydrolysed and oxidized to FeO/FeOOH when exposure to the air.48 The binding energies of O1s for the inhibited specimen could correspond to O in the rust layer, O in the LFA inhibitor and O in the LFA molecule which interacts with Fe surface, thus the peaks of O1s for the inhibited specimen are more intense than that for the uninhibited sample, as shown in Fig. 12(a).
| Specimen | Elements | C1s | N1s | O1s | Fe2p3/2, Fe2p1/2 |
|---|---|---|---|---|---|
| Without inhibitor at 293 K | Binding energy (eV) | 284.6 | — | 532.3 | 713.5, 727.4 |
| With inhibitor at 293 K | Binding energy (eV) | 284.6 | 399.6 | 530.8 | 709.9, 723.9 |
| With inhibitor at 333 K | Binding energy (eV) | 284.6 | 400.5 | 531.5 | 713.0, 726.3 |
3.7. Quantum chemical analysis
Quantum chemical calculations were performed to characterize the relationship between the molecular structure and the inhibition performance of LFA inhibitor. Fig. 13 displays the optimized equilibrium configuration of the LFA molecular. It shows that the groups in which the active heteroatoms N, P, and O are located are in one plane approximately, and this is beneficial for the formation of stable inhibitor film on the steel surface. Moreover, the hydrocarbon chain is approximately perpendicular to the above plane, which plays an important effect on separating the sample surface from corrosion solution.The local electron densities of charges have been proven to be very important for physicochemical properties of compounds as well as many chemical reactions.49 Table 6 lists the natural atomic charges of optimized equilibrium configuration of LFA. In LFA, N1, N6, N20 and all O atoms carry more negative charges which suggest that they prefer to offer electrons to the Fe atoms for forming coordinate bonds. While the atoms of C8, C22 and especially P11 are the positive charge centers to accept electrons from the 3d orbital of Fe atoms for forming feedback bonds.
| Atomic | Charge (C) | Atomic | Charge (C) |
|---|---|---|---|
| N1 | −0.516643 | O12 | −0.305350 |
| C4 | −0.206201 | O13 | −0.742107 |
| C5 | −0.145469 | O14 | −0.684905 |
| N6 | −0.313026 | O16 | −0.562347 |
| C7 | −0.178418 | C18 | −0.169664 |
| C8 | 0.105354 | C19 | −0.096805 |
| C9 | −0.053696 | N20 | −0.515365 |
| O10 | −0.680919 | C22 | 0.617164 |
| P11 | 1.722593 | O23 | −0.573802 |
Frontier orbital electron densities of atoms are known to be useful for characterizing the donor–acceptor interactions. The HOMO (highest occupied molecular orbital) and LOMO (lowest occupied molecular orbital) densities are critical to the electrophilic electron density (fEr) in a donor molecule and the nucleophilic electron density (fNr) in an acceptor molecule, respectively. However, strictly speaking, frontier orbital electron densities can be only used to characterize the activity of various atoms in the same molecule. So the values of Fukui index are needed in order to compare the activities between different molecules, and which can be obtained by normalizing the frontier orbital electron densities through the energy of the corresponding frontier molecule orbitals: FEr = fEr/EHOMO, FNr = fEr/ELOMO.50 The larger the values of Fukui index, the easier for the atoms to accept electrons or to provide electrons during a chemical reaction. Besides, the sum of orbital coefficients's square of participants (in percentage) is used to characterize their contribution to some molecular orbitals.
As shown in Table 7, the HOMO of LFA molecule is distributed over the acyl and amine groups and is mainly constitute by N1, C4, C5, N6, C7, C8, C18, N20 and O23, which suggests that they facilitate to denote electrons to Fe atoms and form coordinate bonds. The LOMO of LFA is mainly located on the phosphate group and is constitute by C9, O10, P11, O12, O13, O14 and C22, which indicates that they prefer to accept electrons from Fe atoms and form back-donating bonds.51 Therefore, the LFA molecule can interact with the steel surface through the acyl, amine and phosphate groups to form multi-adsorption centers for providing excellent inhibition performance.
| Atom | fEr | FNr | fNr | FNr | HOMO (%) | LOMO (%) |
|---|---|---|---|---|---|---|
| N1 | 0.0734022 | −0.2229978 | 0.0000038 | 0.0008992 | 7.34 | 0 |
| C2 | 0.0604661 | −0.1836976 | 0.0001016 | 0.0240409 | 6.05 | 0.01 |
| C3 | 0.0444501 | −0.1350406 | 0.0000199 | 0.0047088 | 4.45 | 0 |
| N4 | 0.3005192 | −0.9129852 | 0.0020181 | 0.4775281 | 30.05 | 0.20 |
| C5 | 0.0282455 | −0.0858106 | 0.0139339 | 3.2970758 | 2.82 | 1.39 |
| C6 | 0.0467243 | −0.1419496 | 0.0078646 | 1.8609422 | 4.67 | 0.79 |
| C7 | 0.0070495 | −0.0214166 | 0.2633235 | 62.3082935 | 0.70 | 26.33 |
| O8 | 0.0024715 | −0.0075085 | 0.0922819 | 21.8359839 | 0.25 | 9.23 |
| P9 | 0.0006133 | −0.0018632 | 0.2977164 | 70.4464312 | 0.06 | 29.77 |
| O10 | 0.0001272 | −0.0003864 | 0.0471406 | 11.1545317 | 0.01 | 4.71 |
| O11 | 0.0002476 | −0.0007522 | 0.0245162 | 5.8010872 | 0.02 | 2.45 |
| O12 | 0.0006963 | −0.0021154 | 0.1214809 | 28.7451275 | 0.07 | 12.15 |
| O13 | 0.0024275 | −0.0073748 | 0.0038550 | 0.9121802 | 0.24 | 0.39 |
| C14 | 0.0467708 | −0.1420909 | 0.0000180 | 0.0042592 | 4.68 | 0 |
| C15 | 0.0094130 | −0.0285969 | 0.0000295 | 0.0069804 | 0.94 | 0 |
| N16 | 0.1021873 | −0.3104477 | 0.0065069 | 1.5396797 | 10.22 | 0.65 |
| C17 | 0.0002199 | −0.0006681 | 0.1003134 | 23.7364184 | 0.02 | 10.03 |
| O18 | 0.1909700 | −0.5801718 | 0.0098052 | 2.3201320 | 19.10 | 0.98 |
4. Conclusions
(1) The synthesized imidazoline phosphate quaternary ammonium salt is spontaneously and rapidly hydrolyzed into its amide-based compound (LFA) after brief air exposure and two weeks of age.(2) The present work shows that the hydrolysate (LFA) of imidazoline-based inhibitor can efficiently protect Q235 steel against CO2 corrosion. It offers very long-lasting effective corrosion inhibition efficiencies. The inhibition efficiencies increase with increasing inhibitor concentration but decrease with the increase in temperature.
(3) The LFA inhibitor acts as an anodic type inhibitor and the mechanism of its inhibition is “negative catalysis effect”.
(4) The formation of stable adsorption film of LFA inhibitor on the steel surface is mainly through the chemical bonds between the heteroatoms in the acyl, amine and phosphate groups in the LFA molecule and Fe atoms on the metallic surface to form multi-adsorption centers, as it was demonstrated by the SEM, XPS and quantum chemical analysis in this work.
Conflicts of interest
There are no conflicts to declare.Acknowledgements
This work was supported by National Natural Science Foundation of China (No. 51901096 & 51971192), the National Defense Technology Foundation of China (No. JSHS2015209B001, No. JSHS2017209B001), and the Project of Shandong Province Higher Educational Science and Technology Program (No. 2018LS004).References
- F. Farelas, M. Galicia, B. Brown, S. Nesic and H. Castaneda, Corros. Sci., 2010, 152, 509–517 CrossRef.
- X. F. Yang, F. Li and W. W. Zhang, RSC Adv., 2019, 9, 10454–10464 RSC.
- P. C. Okafor, C. B. Liu, Y. J. Zhu and Y. G. Zheng, Ind. Eng. Chem. Res, 2011, 5, 7273–7281 CrossRef.
- N. D. Nam, Q. V. Bui, M. Mathesh, M. Y. J. Tan and M. Forsyth, Corros. Sci., 2013, 76, 257–266 CrossRef CAS.
- U. Eduok, E. Ohaeri and J. Szpunar, Ind. Eng. Chem. Res., 2019, 58, 7179–7192 CrossRef CAS.
- M. Finsgar and J. Jackson, Corros. Sci., 2014, 86, 17–41 CrossRef CAS.
- J. Zhang, J. Wang, F. M. Zhu and M. Du, Ind. Eng. Chem. Res., 2015, 54, 5197–5203 CrossRef CAS.
- N. D. Nam, P. V. Hien, N. T. Hoai and V. T. H. Thu, J. Taiwan Inst. Chem. Eng., 2018, 91, 556–569 CrossRef CAS.
- N. M. EL Basiony, A. Elgendy, H. Nady, M. A. Migahed and E. G. Zaki, RSC Adv., 2019, 9, 10473–10485 RSC.
- H. H. Zhang, X. L. Pang and K. W. Gao, Appl. Surf. Sci., 2018, 442, 446–460 CrossRef CAS.
- B. Lin and Y. Zuo, RSC Adv., 2019, 9, 7065–7077 RSC.
- E. E. El-Katori and A. S. Abousalem, RSC Adv., 2019, 9, 20760–20777 RSC.
- H. H. Zhang, X. L. Pang, M. Zhou, C. Liu, L. Wei and K. W. Gao, Appl. Surf. Sci., 2015, 356, 63–72 CrossRef CAS.
- I. Jevremovic, M. Singer, S. Nesic and V. Msikovic-Stankovic, Corros. Sci., 2013, 77, 265–272 CrossRef CAS.
- M. P. Desimone, G. Gordillo and S. N. Simison, Corros. Sci., 2011, 53, 4033–4043 CrossRef CAS.
- M. E. O. Martinez, J. M. Flores and J. Genesca, J. Loss Prev. Process Ind., 2015, 35, 19–28 CrossRef.
- Y. He, Y. Q. Zhou, R. R. Yang, L. Ma and Z. Chen, Russ. J. Appl. Chem., 2015, 88, 1192–1200 CrossRef CAS.
- R. N. Butler, J. D. Thornton and P. Moynihan, J. Chem. Res., Synop., 1981, 3, 84–85 Search PubMed.
- J. A. Martin and F. W. Valone, Corrosion, 1985, 41, 281–287 CrossRef CAS.
- M. M. Watts, J. Am. Oil Chem. Soc., 1990, 67, 993–995 CrossRef CAS.
- H. H. Yu, Synthesis of imidazoline phosphate and study on inhibitory performance, M.S. thesis, Ocean University of China, Qingdao, 2010 Search PubMed.
- A. Jakubowicz, H. Jia, R. M. Wallace and B. E. Gnade, Langmuir, 2005, 21, 950–955 CrossRef CAS.
- X. Y. Liu, S. H. Chen, H. Y. Ma, G. Z. Liu and L. X. Shen, Appl. Surf. Sci., 2006, 253, 814–820 CrossRef CAS.
- M. P. Desimone, G. Grundmeier, G. Gordillo and S. N. Simison, Electrochim. Acta, 2011, 56, 2990–2998 CrossRef CAS.
- S. Ahmet, A. Cemil, K. Ali and U. Orhan, Sol. Energy, 2009, 83, 1757–1763 CrossRef.
- P. S. Chinthamanipeta, S. Kobukata, H. Nakata and D. A. Shipp, Polymer, 2008, 49, 5636–5642 CrossRef CAS.
- X. M. Huang and T. Xie, Material analysis and test method, National Defense Industry Press, Beijing, 2006 Search PubMed.
- B. G. Harnsberger and J. L. Riebsomer, J. Org. Chem., 1964, 1, 229–232 CAS.
- Y. Meng, W. B. Ning, B. Xu, W. Z. Yang, K. G. Zhang, Y. Chen, L. H. Li, X. Liu, J. H. Zheng and Y. M. Zhang, RSC Adv., 2017, 7, 43014–43029 RSC.
- A. Popova, M. Christov and A. Vasilev, Corros. Sci., 2007, 49, 3290–3302 CrossRef CAS.
- Y. Lu, H. X. Liu and J. M. Zhao, Electrochemisty, 2017, 13, 243–248 Search PubMed.
- P. C. Okafor, X. Liu and Y. G. Zheng, Corros. Sci., 2009, 51, 761–768 CrossRef CAS.
- C. N. Cao, Principles of Electrochemistry of Corrosion, Chemical Industry Press, Beijing, 3rd edn, 2008 Search PubMed.
- A. Singh, Y. H. Lin, K. Ansari, M. A. Quraishi, E. Ebenso, S. S. Chen and W. Y. Liu, Appl. Surf. Sci., 2015, 359, 331–339 CrossRef CAS.
- J. A. Calderon, F. A. Vasquez and J. A. Carreno, Mater. Chem. Phys., 2017, 185, 218–226 CrossRef CAS.
- M. A. Deyab, M. M. Osman, A. E. Elkholy and F. El-Taib Heakal, RSC Adv., 2017, 7, 45241–45251 RSC.
- B. Wang, L. W. Zhang, H. Jiang, X. B. Li and X. L. Mu, Mater. Corros., 2018, 69, 1516–1525 CrossRef CAS.
- W. R. Osorio, E. S. Freitas and A. Garcia, Electrochim. Acta, 2013, 102, 436–445 CrossRef CAS.
- B. Wang, X. B. Li, J. Liu and H. Jiang, Mater. Corros., 2018, 69, 888–897 CrossRef CAS.
- N. Asadi, M. Ramezanzadeh, G. Bahlakeh and B. Ramezanzadeh, J. Taiwan Inst. Chem. Eng., 2019, 95, 252–272 CrossRef CAS.
- P. Kannan, T. S. Rao and N. Rajendran, J. Colloid Interface Sci., 2018, 512, 618–628 CrossRef CAS.
- J. M. Zhao, H. X. Liu, W. Di and Y. Zuo, Electrochemistry, 2004, 10, 440–445 CAS.
- J. F. Moulder, W. F. Stickle, P. E. Sobol and K. D. Bomben, Handbook of X-ray photoelectron spectroscopy, Perkin-Elmer Corporation, Norwalk, CT, 1992 Search PubMed.
- C. D. Wagner, A. V. Naumkin, A. Kraut-Vass, J. W. Allison, C. J. Powell and J. R. Rumble, NIST X-ray photoelectron spectroscopy database, NIST Standard Reference Database 20. Version3.5, http://srdata.nist.gov/xps/ Search PubMed.
- D. Q. Zhang, L. X. Gao and G. D. Zhou, Surf. Coat. Technol., 2010, 204, 1646–1650 CrossRef CAS.
- F. Bentiss, M. Lagrenee, M. Traisnel and J. C. Hornez, Corros. Sci., 1999, 41, 789–803 CrossRef CAS.
- N. D. Nam, A. Somers, M. Mathesh, M. Seter, B. Hinton, M. Forsyth and M. Y. J. Tan, Corros. Sci., 2014, 80, 128–138 CrossRef CAS.
- J. K. Heuer and J. F. Stubbins, Corros. Sci., 1999, 41, 1231–1243 CrossRef CAS.
- Q. B. Zhang and Y. X. Hua, Electrochim. Acta, 2009, 54, 1881–1887 CrossRef CAS.
- M. Karelson and V. S. Lobanov, Chem. Rev., 1996, 96, 1027–1043 CrossRef CAS.
- J. X. Liu, W. Z. Yu, J. Zhang, S. Q. Hu, L. You and G. M. Qiao, Appl. Surf. Sci., 2010, 256, 4729–4733 CrossRef CAS.
| This journal is © The Royal Society of Chemistry 2019 |

