
 Open Access Article
 This Open Access Article is licensed under a Creative Commons Attribution-Non Commercial 3.0 Unported Licence
Screening of multi-class antibiotics in pork meat by LC-Orbitrap-MS with modified QuEChERS extraction
Qing Chen,
Xiao-Dong Pan *,
Bai-Fen Huang,
Jian-Long Han and
Biao Zhou
*,
Bai-Fen Huang,
Jian-Long Han and
Biao Zhou
Zhejiang Provincial Center for Disease Control and Prevention, Institute of Physical-Chemistry and Toxicity, Room No. 401, Bin-Sheng Road No. 3399, Binjiang District, Hangzhou, 310051, China. E-mail: zjupanxiaodong@hotmail.com; Fax: +86 571 87115261; Tel: +86 571 87115274
First published on 6th September 2019
Abstract
The quantification capability of high resolution mass spectrometry is of great interest to analysts. We described a method for analysis of multi-class antibiotics in pork meat by UPLC-quadrupole (Q)-Orbitrap-MS. The QuEChERS approach with a clean-up step using a sorbent of primary-secondary amine (PSA) and C18 was adopted for sample preparation, and 37 antibiotics including beta-lactams, tetracyclines, sulfonamides, fluoroquinolones and macrolides were analyzed. The Q-Orbitrap method showed high sensitivity with limits of detection (LODs) ranging from 0.8 μg kg−1 to 2.9 μg kg−1. The method was further validated by intra and inter-day tests with fortified samples. Recovery (85–105.6%) and precision values (RSDs < 15%) for all analytes were obtained. The result indicates that UPLC-Q-Orbitrap-MS coupled with QuEChERS preparation can serve as a routine method for multi-class antibiotic analysis in pork meat.
Introduction
In recent years, fast increases in meat production have occurred in developing countries and this will continue, especially for poultry and pork. China alone produces and consumes roughly half the world's pigs.1 Meanwhile, the use of veterinary antibiotics as feed additives for growth promotion has reached approximately 8000 tons annually in China.2 Considering the negative effect of antibiotic usage, potential health risks for pork consumption become a public concern. Actually, some studies have shown that some antibiotics such as sulphonamides, tetracyclines and fluoroquinolones are found in waterways and manure from Chinese pig farms2,3The abuse of antibiotics has two major adverse impacts on human, bacterial resistance and toxicological effects resulting from their residues. A recent study based on research in East China finds evidence that exposure to different antibiotics is a possible cause for obesity in children.4 From the legal perspective, European Community Regulation (EU) no 470/2009 established antibiotic maximum residue limits (MRLs) in foodstuff of animal origin, considering toxicological risks and pharmacological effects of residues.5 Chinese Ministry of Agriculture also published announcement (no. 235) for MRLs. Furthermore, the Chinese government has recently launched a pilot program that aims to eliminate the use of antibiotics in livestock feed by 2020.
Besides establishing regulation for antibiotic addition, comprehensive surveillance of targeted antibiotics in pork muscle is necessary. Accordingly, methods for antibiotics determination are required with satisfactory qualitative and quantitative results at trace level in muscle matrix. Recently, a growing number of reports have focused on separation and detection of antibiotics with liquid chromatography tandem mass spectrometry (LC-MS/MS), which have been widely applied in quantitative target analysis.6–8 Some new kinds of mass spectrometry have also been used for screening and confirmation of drug residues, such as time-of-flight (TOF), Orbitrap, and hybrid mass spectrometer of quadrupole-time-of-flight (Q-TOF) or Q-Orbitrap.9–15 Comparing to triple-quadrupole MS, these MS with high resolution has more precise criteria for mass accuracy and mass resolution.
In our previous work,9 Orbitrap MS technology was proven to be selective and sensitive for the qualitative analysis of some β-lactams in chicken muscle. The limits of detection (LOD) of β-lactam (methicillin) can reach 0.01 μg kg−1. However, we usually cannot suspect certain kind of antibiotic residue in routine test. Accordingly, methods for multi-class antibiotics determination are of great interests for the analysts.
This paper aims to develop a multi-residue analysis method using LC-quadrupole-Orbitrap and QuEChERS pre-treatment. Thirty-seven antibiotics including beta-lactams, tetracyclines, sulfonamides, fluoroquinolones and macrolides were determined in pork meat. Modified QuEChERS-based preparation was chosen as a best compromise in terms of analytes recoveries and quantification limits achieved. Stable-isotope-labeled antibiotics were adopted as internal standards to compensate the loss of sample preparation and matrix effect.
Materials and methods
Materials and reagents
Penicillin G, ampicillin, penicillin V, amoxicillin, oxacillin, cloxacillin, tetracycline, doxycycline, oxytetracycline, chlortetracycline, sulfadiazine, sulfadoxine, sulfadimidine, sulfamerazine, sulfamonomethoxine, sulfamethoxazole, sulfamethoxypyridazine, sulfapyridine, sulfathiazole, sulfadimethoxin, enoxacin, enrofloxacin, fleroxacin, flumequine, gatifloxacin, lomefloxacin, marbofloxacin, norfloxacin, ofloxacin, oxolinic acid, sparfoxacin, tilmicocin, rosamicin, roxithromycin, clarithromycin, eprinomectin, tylosin were all purchased from Dr Ehrenstorfer GmbH (Augsburg, Germany). Roxithromycin-d7 and tetracycline-d6 were purchased from J&K Chemistry (Beijing, China). Penicillin G-d7, Enrofloxacin-d5, and Sulfadoxine-d3 were obtained from Dr Ehrenstorfer GmbH (Augsburg, Germany). Acetonitrile, methanol, and formic acid and acetic acid were HPLC gradient grade and purchased from Merck (Darmstadt, Germany). Ethylenedinitrilotetra-acetic acid disodium salt (EDTA) from were obtained from Merck. Double-deionized water was obtained with a Milli-Q Gradient water system (Millipore, Bedford, MA).Stock standard solutions of all analytes were prepared at 100 mg L−1 by dissolving the compounds in methanol. These standard solutions were stored at −20 °C in dark glass bottles during the three-month validity period and diluted with acetonitrile or methanol to prepare working solutions. The working solutions were kept at −20 °C in dark glass bottles for a month, after which they were replaced with fresh solutions.
Sample preparation
![[thin space (1/6-em)]](https://www.rsc.org/images/entities/char_2009.gif) :90, v/v). The final solution was filtered through a 0.22 μm nylon membrane for LC-HRMS analysis.
:90, v/v). The final solution was filtered through a 0.22 μm nylon membrane for LC-HRMS analysis.| Antibiotics | Analyte | Formula | Theoretical precursor (m/z) | Retention (min) | Confirmation fragment (m/z) |
|---|---|---|---|---|---|
| a The Δ ppm between the exact precursor and theoretical was no more than 2; the two fragment irons were used for quantification. | |||||
| Beta-lactams | Penicillin G | C16H17N2O4S | 334.0982 | 2.53 | 160.0430/176.0710 |
| Penicillin G-d7 | C16H17D7N2O4S | 341.1530 | 2.54 | 160.0430/183.1120 | |
| Ampicillin | C16H19N3O4S | 350.1169 | 3.20 | 106.0723/160.0428 | |
| Penicillin V | C16H17O5N2S | 350.0931 | 3.20 | 106.07/114.00/160.0428 | |
| Amoxicillin | C16H19N3O5S | 366.1118 | 3.05 | 114.0429/160.0428 | |
| Oxacillin | C19H19N3O5S | 402.1118 | 3.39 | 144.0415/160.0428 | |
| Cloxacillin | C19H18ClN3O5S | 436.0729 | 4.36 | 160.0430/178.01/277.04 | |
| Tetracyclines | Tetracycline | C22H24N2O8 | 445.1605 | 2.48 | 410.1242/154.0502 |
| Tetracycline-d6 | C22H18D6N2O8 | 451.1982 | 2.47 | 416.1541 | |
| Doxycycline | C22H24N2O8 | 445.1605 | 3.01 | 428.1349/154.0502 | |
| Oxytetracycline | C22H24N2O9 | 461.1555 | 2.54 | 426.1190/201.0550 | |
| Chlortetracycline | C22H23ClN2O8 | 479.1216 | 3.51 | 444.0849/462.0954/154.0502 | |
| Sulfonamids | Sulfadiazine | C10H10N4O2S | 251.0597 | 1.87 | 156.0116/108.0450 |
| Sulfadoxine | C12H14N4O4S | 311.0809 | 3.29 | 156.0116/108.0450 | |
| Sulfadoxine-d3 | C12H11D3N4O4S | 314.0997 | 3.20 | 159.0295 | |
| Sulfadimidine | C12H14N4O2S | 279.0910 | 1.70 | 156.0116/108.0450 | |
| Sulfamerazine | C11H12N4O2S | 265.0754 | 2.23 | 156.0116/108.0450 | |
| Sulfamonomethoxine | C11H12N4O3S | 281.0703 | 2.77 | 156.0116/126.0666 | |
| Sulfamethoxazole | C10H11N3O3S | 254.0594 | 3.49 | 156.0116/108.0450 | |
| Sulfamethoxypyridazine | C11H12N4O3S | 281.0703 | 3.13 | 156.0116/126.0666 | |
| Sulfapyridine | C11H11N3O2S | 250.0645 | 2.08 | 156.0116/108.0450 | |
| Sulfathiazole | C9H9O2N3S2 | 256.0209 | 2.09 | 156.0116/108.0450 | |
| Sulfadimethoxin | C12H14N4O4S | 311.0809 | 4.00 | 156.0116/108.0450 | |
| Fluoroquinolones | Enoxacin | C15H17FN4O3 | 321.1358 | 2.4 | 234.1041/206.0729 |
| Enrofloxacin | C19H22FN3O3 | 360.1718 | 2.77 | 316.1825/245.1089 | |
| Enrofloxacin-d5 | C19H17D5FN3O3 | 365.2032 | 2.72 | 365.2321/347.2537 | |
| Fleroxacin | C17H18F3N3O3 | 370.1373 | 2.60 | 326.1480/269.0901 | |
| Flumequine | C14H12FNO3 | 262.0874 | 4.81 | 238.0515/244.0766 | |
| Gatifloxacin | C19H22FN3O4 | 376.1667 | 2.97 | 332.1771/261.1037 | |
| Lomefloxacin | C17H19F2N3O3 | 352.1467 | 2.79 | 265.1152/308.1576 | |
| Marbofloxacin | C17H19FN4O4 | 363.1463 | 2.43 | 319.1653/261.1039 | |
| Norfloxacin | C16H18FN3O3 | 320.1405 | 2.44 | 276.1511/233.1089 | |
| Ofloxacin | C18H20FN3O4 | 362.1511 | 2.44 | 261.1039/318.1618 | |
| Oxolinic acid | C13H11NO5 | 262.0710 | 3.87 | 234.0401/244.0602 | |
| Sparfoxacin | C19H22F2N4O3 | 393.1733 | 3.18 | 349.1840/292.1260 | |
| Macrolides | Tilmicocin | C46H80N2O13 | 869.5733 | 3.95 | 174.1126/696.4690 |
| Rosamicin | C31H51NO9 | 582.3637 | 4.81 | 158.1178/116.0711 | |
| Roxithromycin | C41H76N2O15 | 837.5319 | 5.34 | 158.1179/679.4365 | |
| Roxithromycin-d7 | C41H70D7N2O15 | 844.5758 | 5.32 | 686.5002/158.1179 | |
| Clarithromycini | C38H69NO13 | 748.4842 | 5.12 | 158.1182/495.9654 | |
| Eprinomectin | C50H75NO14 | 914.5260 | 8.97 | 186.1130/199.1122 | |
| Tylosin | C46H77NO17 | 916.5264 | 8.90 | 154.0866/186.1130 | |
The MS parameters of PRM were: default charge 1, inclusion on, ms2 resolution 17500, maximum IT 100 ms, AGC target 2.0 × 10⁶, isolation window 2.0 m/z, and NCE/stepped 25, 35, 55. For the method development and data evaluation, operational software of Xcalibur and TraceFinder was used (Thermo Scientific, San Jose, CA, USA). As an additional criterion for confirmation of the presence of particular analytes in positive samples, spectral library of target analytes MS/MS fragments was created using Thermo Library Manager application (Thermo Scientific, San Jose, CA, USA).
Results and discussion
Optimization of the extraction procedure
The selected solvent used for extraction must recover all analytes from the matrix and preserve co-elution of interfering compounds. In terms of the solubility of these antibiotics, the acetonitrile was used for extraction. However, when the concentration of acetonitrile in solvent was too high, it was difficult to extract some highly polar components, such as β-lactams. So, 10% water was added to extraction solvent. Furthermore, Na2EDTA was used to prevent chelation complexes of multivalent cations with antibiotics, especially tetracyclines and fluoroquinolones.16,17 The chelation can interfere in the protonation of target compounds for MS analysis. Considering tetracyclines, macrolides and β-lactams are stable in neutral or low alkaline solution, while quinolones and sulfonamides are less affected by pH, we do not change the pH value of extraction solvent.In the clean-up step of QuEChERS preparation, various sorbents are used for co-extractives removal depending on the different sample type. Previous reports evaluated more than 50 sorbents in the terms of their selectivity and applicability.18–20 Among these kind of sorbents the most commonly used in the QuEChERS methods is PSA with main function to remove co-extracted constituents such as NH2–organic acids, fatty acids, sugars and ionic-lipids. Moreover, octadecyl silica (C18) provides good results in the purification of samples with significant fat. Accordingly, we selected both PSA and C18 as sorbents, and optimized the ratio using five isotope-labeled standards. The results were obtained by the external standard calibration. It showed that supplement with ratio of 1:1 had the high recovery (Table 2).
| Sorbent for clean-up | Recovery% (spiking 100 μg kg−1, n = 3) | Average recovery (%) | ||||
|---|---|---|---|---|---|---|
| Penicillin G-d7 | Tetracycline-d6 | Sulfadiazine-d4 | Enrofloxacine-d5 | Roxithromycin-d7 | ||
| PSA (100 mg) | 71.5 | 66.2 | 75.2 | 69.4 | 65.7 | 69.6 |
| C18 (100 mg) | 55.6 | 65.2 | 66.4 | 70.2 | 58.5 | 63.2 |
| PSA/C18 (50 mg:50 mg) |
88.7 | 85.2 | 84.2 | 83.6 | 84.5 | 85.2 |
| PSA/C18 (80 mg/20 mg) | 74.2 | 69.5 | 75.5 | 72 | 78.7 | 74.0 |
| PSA/C18 (20 mg/80 mg) | 72.2 | 67.5 | 70.5 | 68.5 | 69.8 | 69.7 |
Optimization of LC-Orbitrap-MS conditions
In the chromatographic separation, formic acid was added into mobile phase to protonate antibiotics between mobile phase composition and MS response for selected xx antibiotics. Regarding the organic solvent, acetonitrile showed better sensitivity (S/N) and peak shape than methanol. We adopt water and acetonitrile containing 0.1% formic acid as the mobile phase. The separation was performed over a run time of 30 min with gradient elution (Fig. 1). The initial mobile phase with high water phase content was used to elute hydrophilic compounds causing matrix interference and, therefore, avoid co-elution with targeted analytes. Later, a high percentage of organic reagents (95–100%) at the end of the gradient and relatively long washing intervals avoided carry-over phenomena.21 In addition, we investigated the performance of different columns (BEH C18 column 1.7 μm, 2.1 mm × 100 mm; CSH C18 column 1.7 μm, 2.1 mm × 100 mm; HSS T3 column 1.8 μm, 2.1 mm × 100 mm) for the separation of selected antibiotics. HSS T3 column provided satisfactory separation and peak shapes for selected antibiotics. For example, enrofloxacin can be fully separated in HSS T3 column (Fig. 2).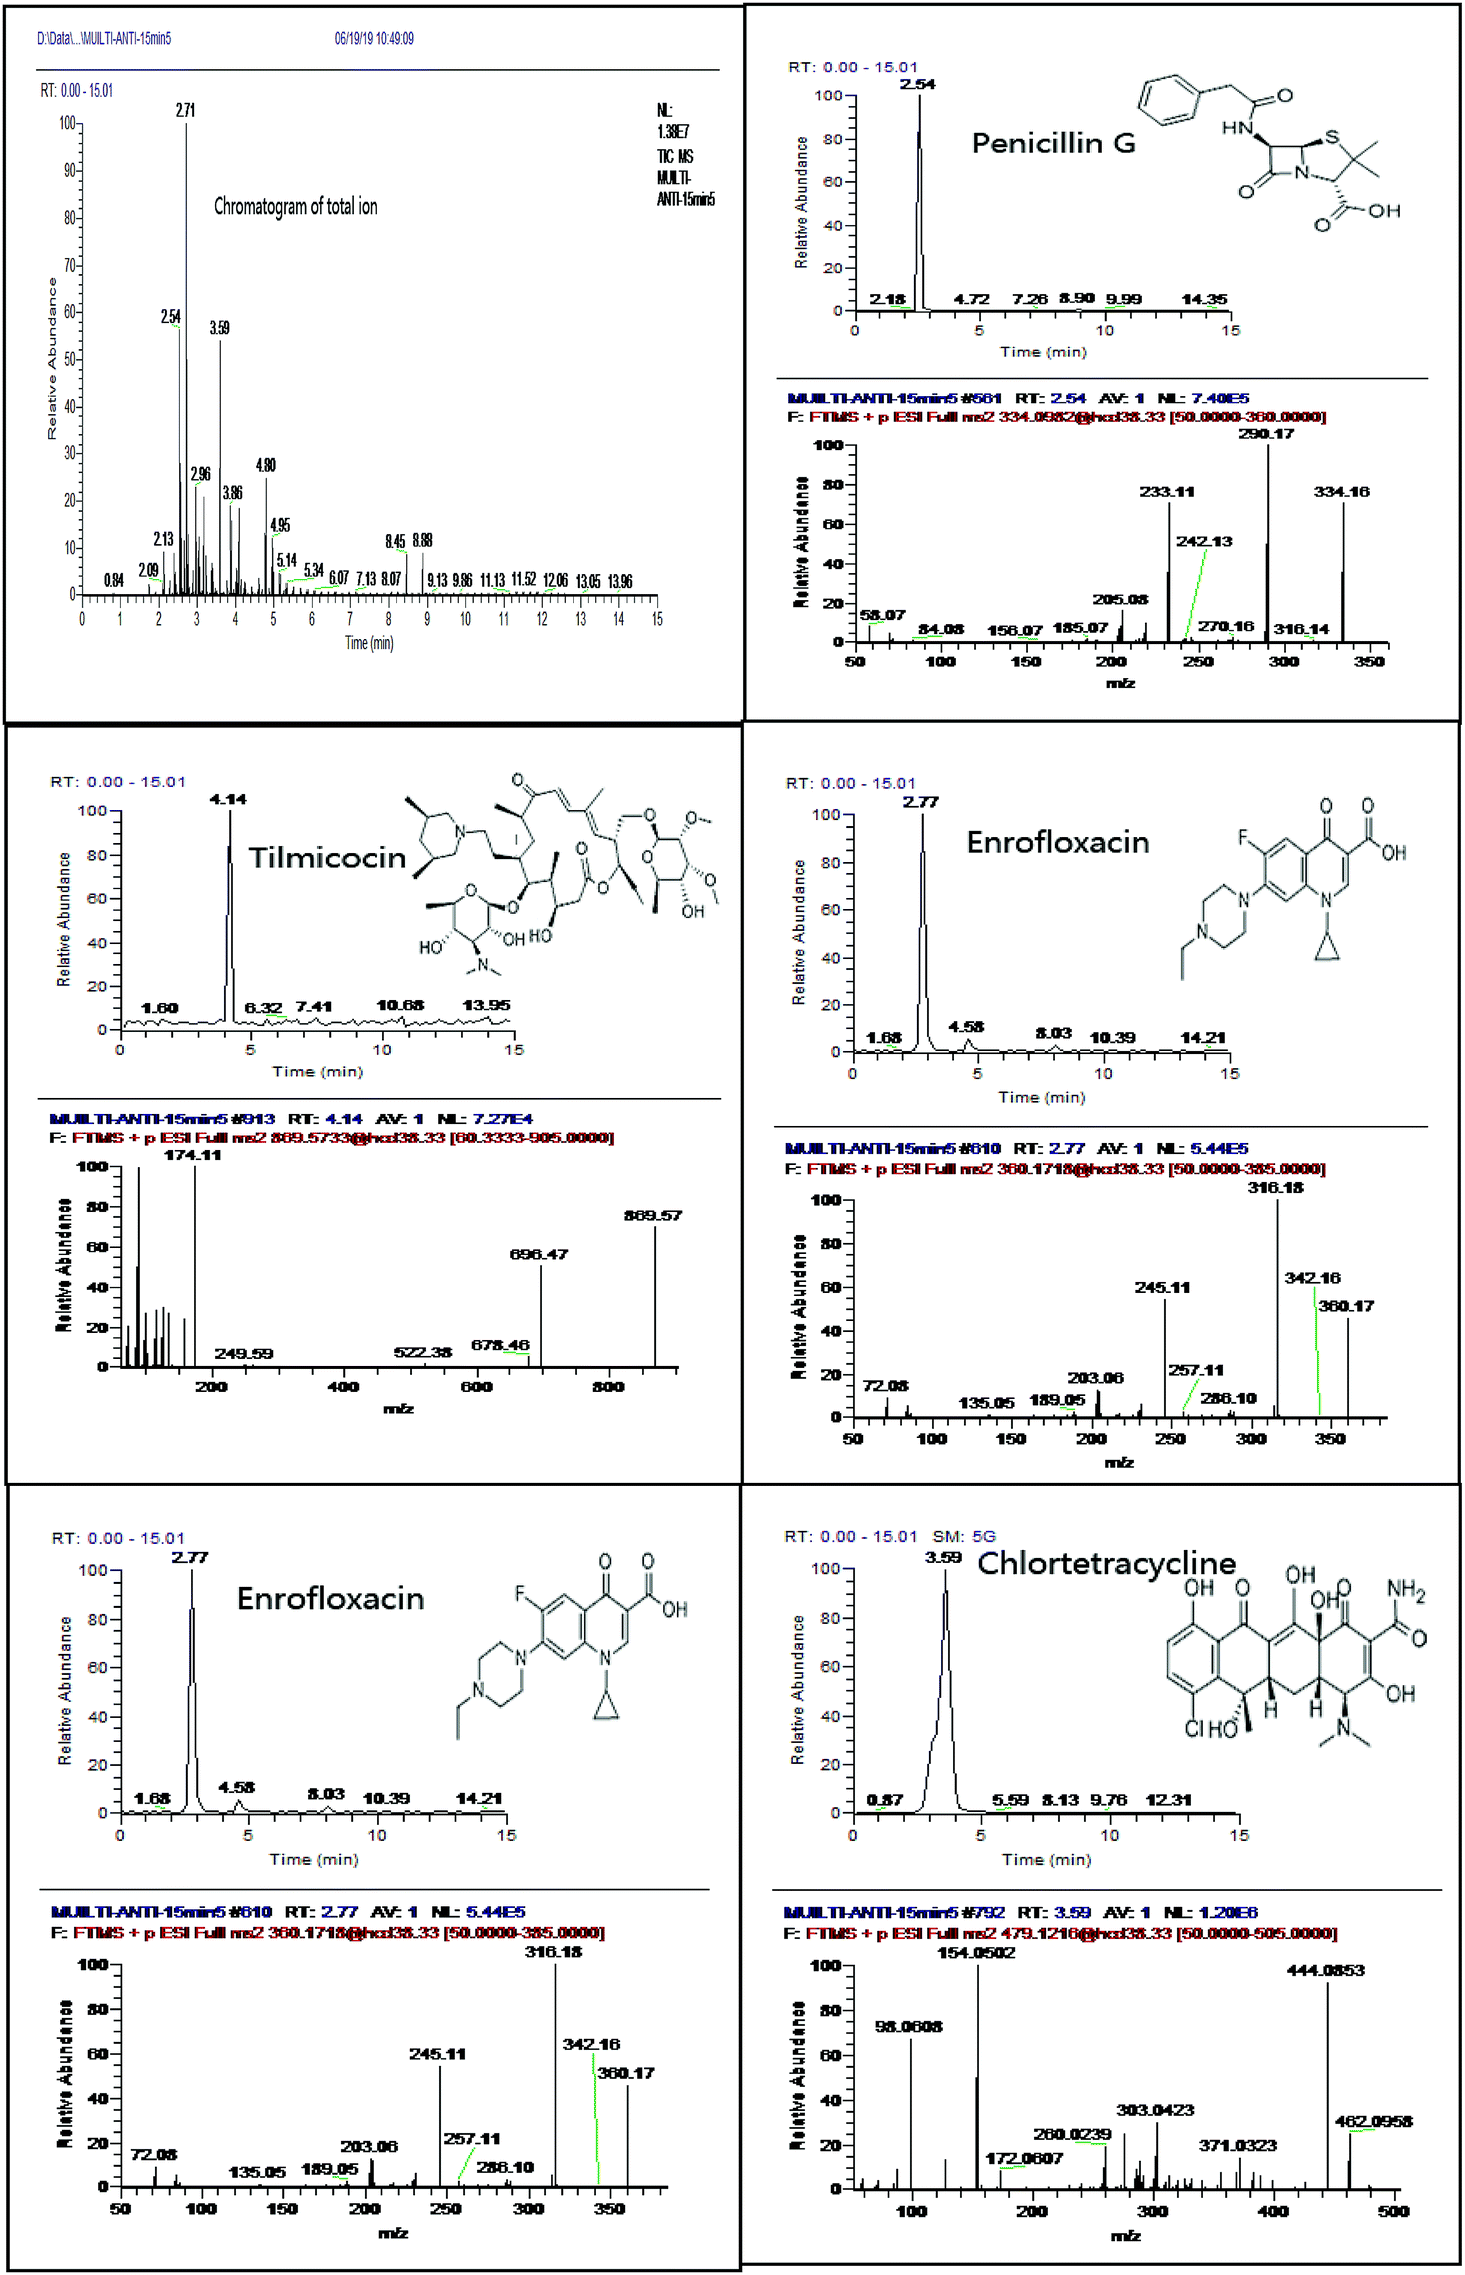 | ||
| Fig. 1 Chromatogram of total ion with PRM scan mode and five typical extracted ion chromatogram and their spectrum of fragments in spiked sample (10 μg kg−1). | ||
 | ||
| Fig. 2 Extracted ion chromatogram of enrofloxacin performed in different columns in spiked sample (10 μg kg−1). | ||
Using hybrid quadrupole-Orbitrap mass spectrometry, qualification and quantification of complicated compounds can be performed in one analysis. For confirmation of targeted analytes, four identification points must be obtained and, therefore, at least two ions must be included in the high-resolution mass spectrometric method. In present study, we adopted parallel reaction monitoring (PRM) scan mode for selected antibiotics. PRM, basically similar with MRM or SRM in triple quadrupole MS is novel scan strategy that can be utilized on high-resolution MS platforms.22 In this scan mode, targeted precursor ion is isolated in Q1, and then all generated MS/MS fragment ions are recorded in parallel with characteristics of full scan, accurate mass and high-resolution.23 One of the well-known drawbacks of the LC-Orbitrap methodology is co-elution matrix signals may suppress analyses at very low concentrations. This problem was resolved successfully in our method by using PRM scan mode, which only monitored targeted precursor ion (Fig. 1).
In Q-Exactive Orbitrap, the resolving power of is divided to four different levels as medium (17500), enhanced (35000), high (70000) and ultra-high (140000), but increased resolution decreased the scanning speed. Consequently, the choice of this parameter was balanced against the quality of peak shapes where insufficient numbers of scans are plotted, resulting in reduced quantitative capacity.24 For the fragmentation purposes, the relative high dynamic range C-trap setting (1 × 10⁶) and an injection time of 150 ms were selected to combine high detection sensitivity with an extended linear range for quantification. These parameters controlled the capacity of the ion trap to regulate the ion population within it. Sensitivity can be improved by increasing either the C-trap dynamic range value or injection time. Three-step NCE (values adjusted on 25, 35, and 45 eV) was applied in MS2 acquisition mode, which meant the center energy was 35 eV (plus 10 above and below). Most of fragments of selected antibiotics can be obtained with three-step NCE. All fragments created in these steps were collected sequentially in the HCD and sent to the Orbitrap analyser.
Method validation
The validation was carried out with the purpose to ensure the adequate identification and quantification of the analytes. Matrix effect was evaluated by the response comparison of analytes in initial mobile phase and matrix extraction. The ratios of mass response for analytes in matrix extraction to those in mobile phase were all less than 90%. Hence, stable-isotope labeled-antibiotics were used as internal standards for compensation of the matrix effect. Additionally, the mass spectrometry only scans the targeted precursors in PRM scan mode, which reduces related interfering ions, and no interfering peaks appeared in our results. Sensitivity was evaluated by limits of detection (LODs) and limits of quantification (LOQs). LOD were then calculated based on a minimal accepted value of the signal to-noise ratio (S/N) of 3, and LOQ for S/N = 10. The LODs of all antibiotic were ranged from 0.8 μg kg−1 to 2.9 μg kg−1. The calibration curves showed good linearity with regression coefficients (r2) of each analytes greater than 0.99 in the range of 2–250 μg L−1. As shown in Table 3, average recoveries of analytes at three spiking levels ranged from 85% to 105.6%. There was no significant deviation in intra and inter-day test, where relative standard deviations (RSDs) were all less than 15%. It is obvious that the high selectivity and sensitivity of Q-Orbitrap mass detection provides an excellent method for complex sample analysis.| Analyte | LODs (μg kg−1) | LOQs (μg kg−1) | Spiking recovery (RSD, %, n = 6) | Inter-day (%, n = 6) | ||
|---|---|---|---|---|---|---|
| 10 μg kg−1 | 50 μg kg−1 | 150 μg kg−1 | ||||
| Penicillin G | 0.8 | 2.4 | 94.5 (3.5) | 99.6 (4.1) | 100.1 (4.2) | 7.2 |
| Ampicillin | 1.0 | 3 | 98.4 (7.1) | 100.1 (5.4) | 96.8 (5.6) | 9.4 |
| Penicillin V | 1.1 | 3.3 | 96.3 (4.3) | 96.6 (4.9) | 97.5 (5.1) | 6.9 |
| Amoxicillin | 1.5 | 4.5 | 97.2 (3.9) | 97.6 (4.1) | 96.5 (3.4) | 5.2 |
| Oxacillin | 0.9 | 2.7 | 89.5 (8.9) | 96.2 (9.5) | 95.1 (8.5) | 12.7 |
| Cloxacillin | 1.2 | 3.6 | 96.6 (4.5) | 97.3 (4.3) | 95.2 (4.1) | 6.9 |
| Tetracycline | 1.6 | 4.8 | 94.8 (2.9) | 99.2 (2.5) | 95.8 (2.0) | 2.2 |
| Doxycycline | 1.5 | 4.5 | 96.7 (3.9) | 105.5 (3.1) | 97.2 (1.5) | 7.2 |
| Oxytetracycline | 1.8 | 5.4 | 97.6 (4.8) | 99.6 (4.2) | 96.9 (7.1) | 9.5 |
| Chlortetracycline | 1.7 | 5.1 | 93.2 (6.2) | 98.5 (6.1) | 95.8 (3.9) | 5.8 |
| Sulfadiazine | 0.8 | 2.4 | 88.7 (3.4) | 97.9 (3.0) | 97.1 (2.9) | 5.1 |
| Sulfadoxine | 1.1 | 3.3 | 92.6 (4.5) | 96.5 (4.1) | 94.8 (7.1) | 4.1 |
| Sulfadimidine | 0.8 | 2.4 | 93.6 (1.9) | 98.6 (1.6) | 96.2 (2.4) | 3.6 |
| Sulfamerazine | 0.9 | 2.7 | 92.4 (6.4) | 95.9 (6.1) | 95.6 (3.5) | 6.2 |
| Sulfamonomethoxine | 1.3 | 3.9 | 96.1 (5.5) | 94.9 (4.3) | 92.4 (2.4) | 7.1 |
| Sulfamethoxazole | 1.4 | 4.2 | 87.6 (8.8) | 96.3 (4.7) | 95.5 (4.6) | 11.2 |
| Sulfamethoxypyridazine | 1.5 | 4.5 | 94.8 (5.7) | 95.9 (2.5) | 96.8 (3.4) | 5.9 |
| Sulfapyridine | 0.9 | 2.7 | 96.2 (4.1) | 98.8 (3.5) | 94.8 (2.6) | 3.6 |
| Sulfathiazole | 1.0 | 3.0 | 94.3 (8.6) | 99.5 (6.7) | 100.5 (6.1) | 7.8 |
| Sulfadimethoxin | 1.2 | 3.6 | 96.8 (2.5) | 97.9 (2.8) | 95.2 (3.2) | 8.2 |
| Enoxacin | 1.8 | 5.4 | 99.3 (1.7) | 102.5 (1.9) | 99.8 (2.1) | 3.2 |
| Enrofloxacin | 1.6 | 4.8 | 93.5 (5.4) | 97.8 (3.7) | 95.7 (4.1) | 6.9 |
| Fleroxacin | 2.1 | 6.3 | 90.5 (4.7) | 96.9 (4.6) | 95.8 (4.9) | 8.5 |
| Flumequine | 2.4 | 7.2 | 97.7 (4.6) | 99.9 (5.1) | 96.4 (4.6) | 9.7 |
| Gatifloxacin | 2.6 | 7.8 | 97.5 (3.2) | 98.5 (3.4) | 96.2 (3.9) | 9.1 |
| Lomefloxacin | 2.2 | 6.6 | 96.6 (2.9) | 99.2 (3.2) | 105.6 (4.1) | 4.5 |
| Marbofloxacin | 2.8 | 8.4 | 94.6 (7.6) | 96.8 (4.4) | 96.4 (5.2) | 11.3 |
| Norfloxacin | 2.0 | 6.0 | 98.2 (4.5) | 97.4 (4.1) | 99.8 (3.7) | 10.5 |
| Ofloxacin | 2.3 | 6.9 | 96.1 (2.2) | 99.1 (2.6) | 94.9 (2.0) | 6.3 |
| Oxolinic acid | 1.5 | 4.5 | 95.3 (6.1) | 102.5 (5.4) | 96.8 (7.1) | 5.2 |
| Sparfoxacin | 1.6 | 4.8 | 86.8 (5.8) | 101.3 (3.6) | 96.7 (3.6) | 8.4 |
| Tilmicocin | 2.9 | 8.7 | 93.1 (4.3) | 99.4 (4.1) | 95.9 (3.4) | 7.5 |
| Rosamicin | 2.5 | 7.5 | 94.2 (4.6) | 96.8 (5.2) | 96.8 (5.9) | 10.2 |
| Roxithromycin | 2.4 | 7.2 | 91.5 (5.7) | 95.5 (6.6) | 96.1 (8.2) | 9.2 |
| Clarithromycin | 3.5 | 10.5 | 85 (7.5) | 94.1 (4.1) | 97.7 (2.9) | 11.5 |
| Eprinomectin | 2.6 | 7.8 | 91.6 (9.6) | 95.8 (3.8) | 98.5 (5.4) | 10.7 |
| Tylosin | 2.4 | 7.2 | 93.2 (6.7) | 96.2 (4.7) | 96.5 (3.2) | 9.7 |
Application to real samples
To our knowledge, there are few reports about multi-class antibiotic residues in pork from China. A report from Shanghai, China investigated antibiotic residues in meat, milk and aquatic products by LC-Q-TOF-MS. It revealed that some samples contained 27.0 μg kg−1 norfloxacin, 3.4 μg kg−1 roxithromycin, 4.0 μg kg−1 chlortetracycline in pork.25 In this study, we applied the established LC-Q-Orbitrap-MS method to analysis 15 pork samples collected from the Chinese market in Hangzhou. Two samples were detected with 45.6 μg kg−1 norfloxacin and 12.56 μg kg−1 chlortetracycline, separately (Fig. 3). According to the guideline of Chinese Ministry of Agriculture, norfloxacin is not allowed to use in animals, and the maximum residue limit of chlortetracycline is 100 μg kg−1. | ||
| Fig. 3 Extracted ion chromatogram and spectrum of fragments of norfloxacin (45.6 μg kg−1) and chlortetracycline (12.56 μg kg−1) from two real pork samples. | ||
Conclusion
Multi-residue determination of antibiotics in pork meat has been successfully established based on LC-Q-Orbitrap-MS with QuEChERS pretreatment. The compromise in analytical conditions obtained satisfied recoveries, sensitivities and linear dynamic ranges for the vast majority of the antibiotics. All fragment ions resulting from the precursor ions recorded in the mode of PRM workflow served as an indispensable tool for analysis in line with the official requirements.26Author contributions statement
X.-D. P. and Q. C. conceived the experiment(s), X.-D. P. and Q. C. conducted the experiment(s), X.-D. P., B. Z., J.-L. H. and B.-F. H. analyzed the results. All authors reviewed the manuscript.Conflicts of interest
The authors declare no competing financial interests.Acknowledgements
This work was supported by Zhejiang Science and Technology Project (2019316301), and Zhejiang Health Bureau Fund (2018C37018), Zhejiang Science and Technology Project (WKJ-zj-1917).References
- P. Collignon and A. Voss, Antimicrob Resist Infect Control., 2015, 4, 16 CrossRef.
- L. Zhao, Y. H. Dong and H. Wang, Sci. Total Environ., 2010, 408, 1069–1075 CrossRef CAS.
- R. Wei, F. Ge, S. Huang, M. Chen and R. Wang, Chemosphere, 2011, 82, 1408–1414 CrossRef CAS.
- H. Wang, B. Wang, Q. Zhao, Y. Zhao, C. Fu, X. Feng, N. Wang, M. Su, C. Tang, F. Jiang, Y. Zhou, Y. Chen and Q. Jiang, Environ. Sci. Technol., 2015, 49, 5070–5079 CrossRef CAS.
- E. Community, Off. J. Eur. Communities: Legis., 2009, 152, 11–22 Search PubMed.
- X.-D. Pan, P.-G. Wu, W. Jiang and B.-j. Ma, Food Control, 2015, 52, 34–38 CrossRef CAS.
- X. D. Pan, W. Jiang and P. G. Wu, Analyst, 2015, 140, 366–370 RSC.
- Z. Huang, X.-D. Pan, B.-f. Huang, J.-J. Xu, M.-L. Wang and Y.-P. Ren, Food control, 2016, 66, 145–150 CrossRef CAS.
- Q. Chen, X.-D. Pan, B.-F. Huang and J.-L. Han, J. Pharm. Biomed. Anal., 2017, 145, 525–530 CrossRef CAS.
- M. A. Asghar, Q. Zhu, S. Sun, Y. Peng and Q. Shuai, Sci. Total Environ., 2018, 635, 828–837 CrossRef CAS.
- C. Kong, Y. Wang, Y. Huang and H. Yu, Anal. Bioanal. Chem., 2018, 410, 5545–5553 CrossRef CAS.
- J. Wang, D. Leung, W. Chow, J. Chang and J. W. Wong, Anal. Bioanal. Chem., 2018, 410, 5373–5389 CrossRef CAS.
- J. X. Li, X. Y. Li, Q. Y. Chang, Y. Li, L. H. Jin, G. F. Pang and C. L. Fan, J. AOAC Int., 2018, 101, 1631–1638 CrossRef CAS.
- J. Alcántara-Durán, D. Moreno-González, B. Gilbert-López, A. Molina-Díaz and J. F. García-Reyes, Food Chem., 2018, 245, 29–38 CrossRef.
- C. Aydoğan and Z. El Rassi, Anal. Methods, 2019, 11, 21–28 RSC.
- Z. Li, P. H. Chang, J. S. Jean, W. T. Jiang and C. J. Wang, J. Colloid Interface Sci., 2010, 341, 311–319 CrossRef CAS.
- L. Tong, H. Liu, C. Xie and M. Li, J. Chromatogr. A, 2016, 1452, 58–66 CrossRef CAS.
- T. Rejczak and T. Tuzimski, Open Chem., 2015, 13, 980–1010 Search PubMed.
- J. L. O. Arias, A. Schneider, J. A. Batista-Andrade, A. A. Vieira, S. S. Caldas and E. G. Primel, Food Chem., 2018, 240, 1243–1253 CrossRef CAS.
- M. C. Bruzzoniti, L. Checchini, R. M. De Carlo, S. Orlandini, L. Rivoira and M. Del Bubba, Anal. Bioanal. Chem., 2014, 406, 4089–4116 CrossRef CAS.
- L. Chiesa, S. Panseri, E. Pasquale, R. Malandra, R. Pavlovic and F. Arioli, Food Chem., 2018, 258, 222–230 CrossRef CAS.
- B. Grund, L. Marvin and B. Rochat, J. Pharm. Biomed. Anal., 2016, 124, 48–56 CrossRef CAS.
- J. Zhou, H. Liu, Y. Liu, J. Liu, X. Zhao and Y. Yin, Anal. Chem., 2016, 88, 4478–4486 CrossRef CAS.
- G. Cepurnieks, J. Rjabova, D. Zacs and V. Bartkevics, J. Pharm. Biomed. Anal., 2015, 102, 184–192 CrossRef CAS.
- H. Wang, L. Ren, X. Yu, J. Hu, Y. Chen, G. He and Q. Jiang, Food control, 2017, 80, 217–225 CrossRef CAS.
- E. Community, Off. J. Eur. Communities: Legis., 2010, 15, 1–72 Search PubMed.
| This journal is © The Royal Society of Chemistry 2019 |