 Open Access Article
Mechanistic study on NO reduction by sludge reburning in a pilot scale cement precalciner with different CO2 concentrations
Xiang Xiao ab,
Ping Fang*ab,
Jian-Hang Huangab,
Zi-Jun Tangab,
Xiong-Bo Chenab,
Hai-Wen Wuab,
Chao-Ping Cenab and
Zhi-Xiong Tangab
aSouth China Institute of Environmental Science, Ministry of Ecological Environment of P. R. China, Guangzhou 510655, Guangdong, China. E-mail: fangping@scies.org
bThe Key Laboratory of Water and Air Pollution Control of Guangdong Province, Guangzhou 510655, Guangdong, China
First published on 24th July 2019
Abstract
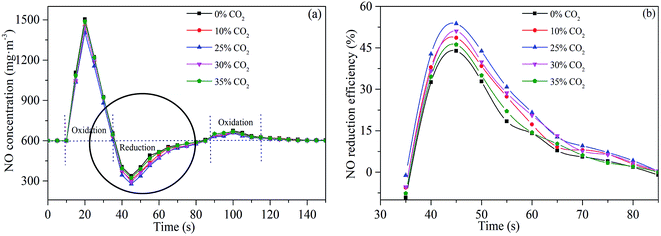
An experimental study on the effects of CO2 concentration on the release of reducing gases and the NO reduction efficiency by sludge reburning was carried out in a pilot scale cement precalciner. The results indicate that sludge reburning shows an ideal NO reduction activity. The best NO reduction efficiency of 54% is reached when the CO2 concentration is 25 vol%. Characteristic analysis of the sludge shows that the main types of reducing gases generated by sludge reburning are HCN, NH3, CO and CH4. Among them, CO2 concentration plays a crucial role in the release of HCN, CO and CH4. The mechanistic study indicates that NO reduction is dominated by homogeneous reduction during the sludge reburning process, in particular the reducing gases of CO and NH3 have significant influences on the NO reduction. Meanwhile, the effect of CO2 concentration on NO reduction is mainly due to the difference in CO release. The results of the present study not only provide insight into the mechanism of NO reduction by sludge reburning, but could also contribute to the development of NOX removal technology in the cement industry.
1 Introduction
As a byproduct of municipal sewage treatment, the rapid growth of sewage sludge production causes severe environmental problems.1–3 It is worth noting that the calorific value of sewage sludge exceeds the minimum requirement for alternative fuels in the cement industry (>6250 J g−1). Meanwhile, sewage sludge contains inorganics (CaO, SiO2, Al2O3, Fe2O3, MgO) and other components of cement.4–6 Therefore, considering the technical difficulties of sewage sludge treatment and the soaring price of fossil fuels and cement raw meal, the co-processing of sewage sludge in cement kilns has gained extensive attention in recent years,7–9 and has been considered a cost-effective and environment-friendly route for energy recovery and sludge disposal.10–12The production of cement consumes large quantity of original materials (clay, limestone, and fuel), which produces lots of air pollutants such as particles, SO2 and NOX. The cement industry has become the third largest industrial NOX emission source in China.13 Several NOX emission control technologies, such as low-NOX burners, staged combustion (air and fuel staged) and selective non-catalytic reduction (SNCR), have been developed. Among them, low-NOX burners and staged combustion technologies have been widely applied to control NOX emission due to the advantages of relatively low investment and operation costs. However, their removal efficiency is only roughly 30%. SNCR is also regarded as a proper technology in considering the temperature range of cement precalciner (850–1200 °C).14,15 Its NOX removal efficiency is approximately 40%. Nevertheless, the SNCR technology will consume a large amount of ammonia and cause the ammonia escape. Therefore, more efforts should be put into the development of more efficient and cost-effective NOX removal technology for cement industry in view of energy conservation and environmental protection.
With the gradual increase of sludge treatment in cement kiln, some researchers have found that co-processing sludge in cement kiln contributes to the decrease of NOX emission.16 For instance, Fang et al.14 discovered that combustion temperature, O2 concentration, sludge dosage and feed point influenced the NO reduction substantially. Lv et al.17 found that co-processing of sludge in cement kiln was beneficial to NO reduction, and the yield of NH3 released from sludge affected NO reduction remarkably. During sludge reburning under hypoxic conditions, various reducing species, such as short-chain hydrocarbon (mainly CH4), CO, HCN and NH3, are generated. These reducing species can effectively reduce NO to N2 by producing a large number of C-containing (CHi) and nitrogenous (NHi) radicals.15,18 It is worth noting that CH4 is firstly decomposed into CHi radicals, which react with NO to form HCN, and then HCN can reduce NO again by forming NHi radicals. Of course, due to the limitation of residence time, HCN may also be a precursor to generate NO.14,19 Although it has been reported that co-processing of sludge in cement kiln has synergistic denitration effect, the reaction mechanism between reducing gases released and NO reduction has not been well studied. In particular, the working conditions of the cement precalciner are relatively complicated, especially the CO2 concentration can be higher than 30 vol%.20 Besides, there existing coupling effects between the decomposition of cement raw meal and the combustion of sludge.21 Therefore, in order to elucidate the influence of CO2 concentration on NO reduction and its mechanism during sludge reburning in cement kiln in the presence of cement raw meal, the characteristics of reducing gases (HCN, NH3, CO, CH4) released and the properties of NO reduction should be researched in detail.
In this study, the types and sources of reducing gases released during sludge combustion were analyzed, and the influences of CO2 concentration on the release of reducing gases were systematically investigated. Meanwhile, the influences of CO2 concentration on the dynamic variation process of NO reduction by sludge reburning were researched. Furthermore, the relationship between homogeneous and heterogeneous NO reduction was also explored. On the basis of the above discussions, the results are expected to disclose the mechanism of NO reduction by sludge reburning in a pilot scale cement precalciner, which can provide theoretical references for improving the technology of industrial application and realizing the efficient disposal of sludge.
2 Materials and methods
2.1 Materials
| Sample | Proximate analysis (wt%) | Ultimate analysis (wt%) | ||||||
|---|---|---|---|---|---|---|---|---|
| Mad | Vad | Aad | FCad | C | H | N | S | |
| Sludge | 6.71 | 30.42 | 58.82 | 4.05 | 27.11 | 3.13 | 3.62 | 0.76 |
| Sludge char | 1.24 | 1.85 | 92.57 | 4.34 | 2.58 | 0.18 | 0.21 | 0.43 |
2.2 Experimental methods
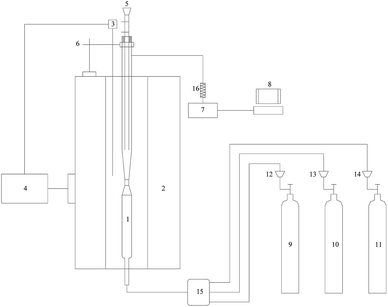
The experimental platform (Fig. 1) was a high temperature gas–solid suspension system which was established to simulate the suspension state of cement precalciner. A gas–solid suspension quartz tube was adopted to simulate the suspension and spurt effects. The quartz tube was composed of three parts, namely, the conical zone (40 mm height), the upper of conical zone (20 mm ID) and the lower of conical zone (4 mm ID). The quartz tube was placed in a vertical electric furnace to simulate the reburning zone of the cement precalciner. The electric furnace can provide a relatively constant temperature with a length of about 60 mm. The flow rate of the flue gas was maintained at 500 mL min−1. The residence time of flue gas through the conical zone of quartz tube was approximately 1 s, and 1.5 s for the constant temperature area of the electric furnace.In order to maintain the constant temperature in the reaction tube and reduce the metrical deviation of gaseous products concentration, the added amounts of sludge/char and cement raw meal were 0.1 g and 1 g, respectively. Each experiment was repeated to ensure the reliability of the experimental data. The data deviation of repeated experiments was not more than 5% and the variation trend was consistent. In addition, the cement raw meal used in this experiment was prepared according to the saturation ratio, the silicic acid ratio and the aluminum oxygen ratio. The main components of cement raw meal were shown in Table 2.
| Composition (w/g) | ||||||
|---|---|---|---|---|---|---|
| CaCO3 | SiO2 | Al2O3 | Fe2O3 | MgO | K2CO3 | Na2SO4 |
| 77.46 | 13.47 | 3.01 | 1.98 | 2.48 | 0.264 | 0.186 |
The O2 concentration was 3 vol%, the CO2 concentration was set as 0, 10, 25, 30 and 35 vol%, respectively, and N2 provided the balance. When the experiment of NO reduction was conducted, the initial concentrations of NO and SO2 at reactor inlet were designed as 600 and 200 mg m−3 respectively based on the atmospheric composition in cement precalciner. Other atmospheric conditions were consistent with the experiment condition of reducing gases released. Meanwhile, the reaction temperature of the conical zone was controlled as 900 °C.
2.3 Characterization method
Elemental compositions of the samples were determined by elemental analyzer equipped with a TCD detector (EuroVector-EA3000, Italy). The weight loss of the samples with temperature during the conventional combustion was characterized by thermogravimetric analysis (TGA: Netzsch-STA449F3, Germany). The gaseous products released from the thermochemical process were detected on Fourier transform infrared spectroscopy (FTIR: Thermo Fisher Scientific, America). The surface atomic states of the samples were analyzed by X-ray photoelectron spectroscopy (XPS: Thermo Escalab 250Xi, America). The morphology of the samples were characterized by transmission electron microscopy (TEM: JEM-2010, Japan). The surface areas of the samples were calculated by the Brunauer–Emmett–Teller (BET: ASAP 2020, USA) method, with the samples degassed at 100 °C for 12 h prior to measurements. The concentrations of the main gaseous products during NO reduction by sludge reburning were analyzed by Gasmet analyzer (Gasmet technologies-DX4000, Finland). The interval time of Gasmet online sampling was set as 5 s.3 Results and discussion
3.1 Characteristics of sewage sludge
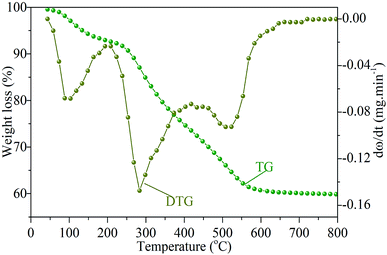
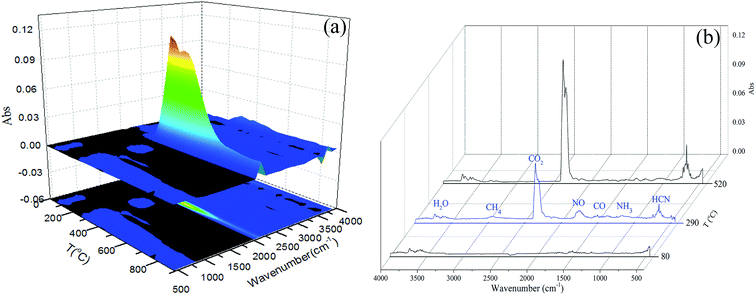
The combustion process of sludge under air atmosphere was depicted by thermogravimetry (TG) and differential thermogravimetry (DTG) curves, as shown in Fig. 2. Three individual peaks can be detached from DTG curve, indicating that the combustion of sludge can be grouped into three different stages, corresponding to the release of moisture, the release and combustion of light organic volatile and the combustion of heavy molecular weight components and fixed carbon. The maximum weight loss rates are reached at 80, 290, 520 °C, respectively.22,23FTIR spectrometer coupled with TGA can provide useful online observation of gaseous products released from the combustion process of sewage sludge. The three-dimensional FTIR absorbance spectra of gaseous products released from the combustion of the sewage sludge is shown in Fig. 3(a). Regions of strong IR absorbance can be identified, which is the absorption peak generated by CO2 anti-symmetric stretching vibration (2400–2240 cm−1). Fig. 3(b) shows FTIR absorbance stack spectra of gaseous products at 80, 290 and 520 °C, which are respectively screened from the maximum loss rates of three stages from DTG. At 80 °C, the broad band at 4000–3400 cm−1 corresponding to the vibration (O–H) of H2O. The decomposition of C![[double bond, length as m-dash]](https://www.rsc.org/images/entities/char_e001.gif) O bonds at around 1780–1600 cm−1 led to the yield of CO. With the temperature rising to 290 °C, it is evident that there exist more gaseous products in addition to H2O and CO. The C–H bonds at around 3200–2700 cm−1 revealed that the compounds of alkyl and aliphatic hydrocarbons exist. The decomposition of C–H bonds led to the yields of CH4, C2H4, C2H6 and other light hydrocarbons. The C–N bonds at around 1340–1020 cm−1 attribute to the presence of amides, which can be decomposed to generate NH3. Furthermore, a strong HCN absorption peak appears at 748 cm−1.22,24 When the temperature is 520 °C, the gaseous products contain H2O, CO2, CO, HCN and hydrocarbons. The above results further indicate that the reducing gas of NH3 is mainly derived from low-volatility components and can be completely released at the initial stage of combustion, while CO, HCN and hydrocarbons are slowly converted from thermally unstable and stable functional groups.25
O bonds at around 1780–1600 cm−1 led to the yield of CO. With the temperature rising to 290 °C, it is evident that there exist more gaseous products in addition to H2O and CO. The C–H bonds at around 3200–2700 cm−1 revealed that the compounds of alkyl and aliphatic hydrocarbons exist. The decomposition of C–H bonds led to the yields of CH4, C2H4, C2H6 and other light hydrocarbons. The C–N bonds at around 1340–1020 cm−1 attribute to the presence of amides, which can be decomposed to generate NH3. Furthermore, a strong HCN absorption peak appears at 748 cm−1.22,24 When the temperature is 520 °C, the gaseous products contain H2O, CO2, CO, HCN and hydrocarbons. The above results further indicate that the reducing gas of NH3 is mainly derived from low-volatility components and can be completely released at the initial stage of combustion, while CO, HCN and hydrocarbons are slowly converted from thermally unstable and stable functional groups.25
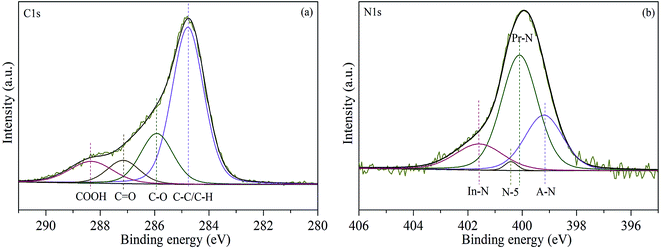
XPS measurement is carried out to investigate the chemical state of sewage sludge. As shown in Fig. 4(a), the C 1s spectra can be fitted with four characteristic peaks corresponding to COOH (288.3 eV), C![[double bond, length as m-dash]](https://www.rsc.org/images/entities/char_e001.gif) O (287.2 eV), C–O (285.9 eV) and C–C/C–H (284.8 eV). The C–C/C–H is the major carbon functional group of sewage sludge, which accounts for about 60% of total carbon in sewage sludge. The contents of other functional groups (C–O, COOH, and C
O (287.2 eV), C–O (285.9 eV) and C–C/C–H (284.8 eV). The C–C/C–H is the major carbon functional group of sewage sludge, which accounts for about 60% of total carbon in sewage sludge. The contents of other functional groups (C–O, COOH, and C![[double bond, length as m-dash]](https://www.rsc.org/images/entities/char_e001.gif) O) are 20%, 11%, and 9%. Fig. 4(b) shows that the nitrogen functionalities in sewage sludge are mainly presented as protein-N (53.73%), amine-N (33.65%), inorganic-N (11.54%), and pyrrole-N (1.08%), the corresponding electron binding energies of which are 400, 399.1, 401.7, and 400.6 eV, respectively.26 It is worth noting that the relative surface content of protein-N is much higher than that of other nitrogen functionalities.
O) are 20%, 11%, and 9%. Fig. 4(b) shows that the nitrogen functionalities in sewage sludge are mainly presented as protein-N (53.73%), amine-N (33.65%), inorganic-N (11.54%), and pyrrole-N (1.08%), the corresponding electron binding energies of which are 400, 399.1, 401.7, and 400.6 eV, respectively.26 It is worth noting that the relative surface content of protein-N is much higher than that of other nitrogen functionalities.
In combination with the FTIR observation (Fig. 3), it is inferred that the CH4 release is due to the secondary cleavage of long fatty chain (C–C/C–H) and fracture of aliphatic chain attached to oxygen atom (COOH, C![[double bond, length as m-dash]](https://www.rsc.org/images/entities/char_e001.gif) O, C–O). The thermal cracking of ether bond, hydroxyl group and oxygen-containing heterocycles is the main route for CO formation. NH3 is derived from the decomposition of inorganic-N and the deammoniation of amine-N which is produced by the protein pyrolysis. HCN is generated from the cracking of pyrrole-N, nitrile-N and heterocyclic-N, while the nitrile-N and heterocyclic-N are produced by the pyrolysis of protein.27,28
O, C–O). The thermal cracking of ether bond, hydroxyl group and oxygen-containing heterocycles is the main route for CO formation. NH3 is derived from the decomposition of inorganic-N and the deammoniation of amine-N which is produced by the protein pyrolysis. HCN is generated from the cracking of pyrrole-N, nitrile-N and heterocyclic-N, while the nitrile-N and heterocyclic-N are produced by the pyrolysis of protein.27,28
3.2 Effects of CO2 concentration on the release of reducing gases
Fig. 5 shows the releasing characteristic curves of HCN during sludge combustion under different CO2 concentrations. There is a negative correlation between CO2 concentration and HCN releasing rate. The effect of CO2 concentration on HCN released is attributed to the combined action of suppression and gasification.29 On the one hand, CO2 could be absorbed on the surface of sludge/char to directly react with HCN and form nitrogen oxides; on the other hand, the nitrogen-containing functional groups in char may also directly react with CO2 before the conversion to HCN by hydrogenation, which reduces the possibility of HCN release.30 Furthermore, the release of HCN decreased significantly when the CO2 concentration is higher than 25 vol%. Excessive CO2 (25–35 vol%) will reduce the local reaction temperature due to the strong radiation absorption of CO2,14,31 resulting in the weakness of gasification rate, which subsequently lowers the exfoliation of H-radical in char. Also, the reaction of –CN with H-radical to form HCN is limited greatly. It can been speculated that the dominant factor affecting the HCN release is the gasification instead of suppression at a relatively higher CO2 concentration (25–35 vol%).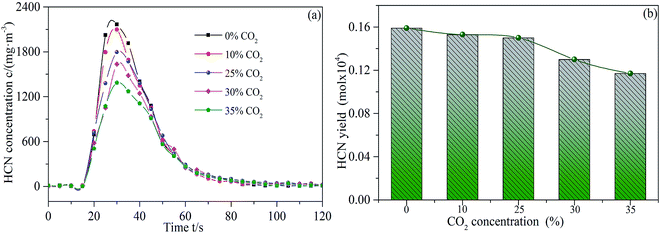 | ||
| Fig. 5 Releasing rates (a) and yields (b) of HCN during sludge combustion under different CO2 concentrations. | ||
It is well-known that CO can be generated by the gasification reaction between CO2 and char.32 It can be speculated that the gasification rate is the main factor affecting the CO release under different CO2 concentrations. The releasing characteristic curves of CO are depicted in Fig. 6. The gasification rate gradually increased because the increase of CO2 concentration (0–25 vol%). The promoting effect is stronger when the CO2 concentration is higher due to a larger peak value and more CO released. However, when the concentration of CO2 further increased (25–35 vol%), the CO yield decreased. In combination with the influence of relatively higher CO2 concentration (25–35 vol%) on HCN release in Fig. 5, the excessive CO2 can reduce the local reaction temperature, which decreases the gasification rate between CO2 and char. Therefore, the inhibition effect of local reaction temperature decreased is obviously greater than the promotion effect of reactant concentration increased, which leads to the gradual decline of CO released at a relatively higher CO2 concentration (25–35 vol%). The above results indicate that an appropriate concentration of CO2 plays a key role in enhancing the CO release during sludge combustion.
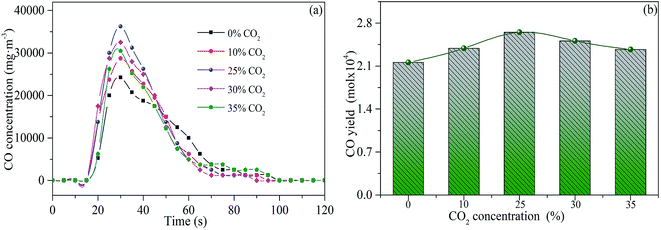 | ||
| Fig. 6 Releasing rates (a) and yields (b) of CO during sludge combustion under different CO2 concentrations. | ||
Fig. 7 illustrates the influence of CO2 concentration on CH4 release. The release of CH4 gradually decreases with the concentration of CO2 increasing from 0 to 25 vol%. This may be attributed to the gasification effect, which results in the promotion of condensation polymerization reaction between semi-char and tar. Then, the methyl functional group is more likely to participate in the condensation polymerization reaction, preventing the release of CH4 from sludge reburning. In addition, the increasing gasification rate probably increases the specific surface area of the activated char, enhancing the catalytic cracking reaction of CH4, which further reduces the release of CH4.27 However, the release of CH4 increased when the concentration of CO2 raised to 35 vol%. This phenomenon may be attributed to the fact that excessive CO2 may weaken the gasification rate, which decreases the surface area of the char. Thus, the effective contact area between CH4 and activated char is fewer, which results in the weakening of the catalytic cracking reaction of CH4.33
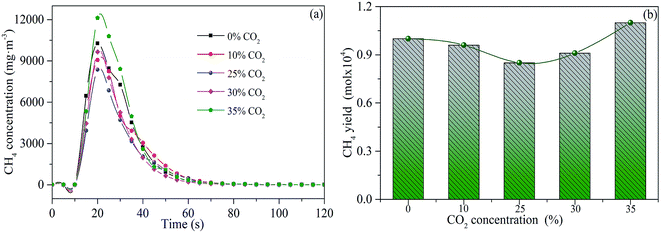 | ||
| Fig. 7 Releasing rates (a) and yields (b) of CH4 during sludge combustion under different CO2 concentrations. | ||
The releasing characteristic curves of NH3 at different CO2 concentrations are shown in Fig. 8. The releasing peak value and amount of NH3 decrease with the increase of CO2 concentration from 0 to 25 vol%. This may be attributed to the suppression effect of CO2 through the consumption of H-radical and nitrogen-containing functional groups.34 When the CO2 concentration further increases to 35 vol%, the amount of NH3 released is relatively stable. Although a comparatively higher CO2 concentration weakens the gasification rate and reduces the exfoliation of H radical of char. In combination with the previous analysis of sludge characteristic in Fig. 3, the release of NH3 mainly occurred at the initial stage of combustion. NH3 formation is not at the same stage as the gasification reaction. So, the weakening of gasification reaction does not affect the release of NH3. Moreover, a relatively higher concentration of CO2 reduces the local reaction temperature, which may reduce the suppression effect that unstable nitrogen-containing functional groups are consumed by CO2. Thus, NH3 release is relatively stable with a considerably higher CO2 concentration (25–35 vol%).
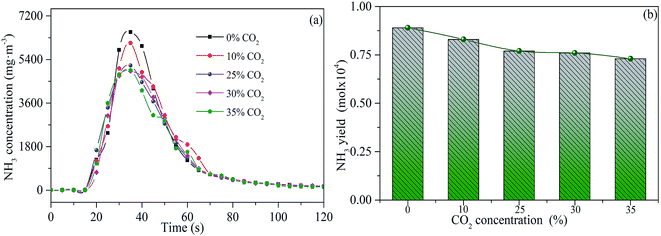 | ||
| Fig. 8 Releasing rates (a) and yields (b) of NH3 during sludge combustion under different CO2 concentrations. | ||
The ratio of the amount of the nitrogen-containing gases released to the nitrogen content in sludge is defined as the yield. The N2 yield is calculated by eqn (1). The yields of the N-containing gaseous products are shown in Fig. 9.
 | (1) |
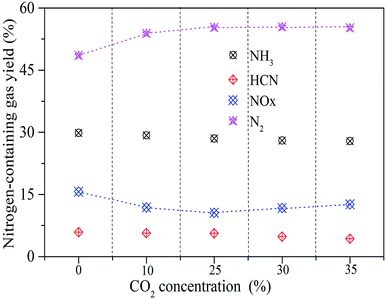 | ||
| Fig. 9 The conversion ratio of nitrogen-containing gaseous products under different CO2 concentrations. | ||
With the increase of CO2 concentration from 0 to 25 vol%, the yield of N2 increases significantly from 47% to 55%. When the CO2 concentration further increases to 35 vol%, the yield of N2 is stable, while the release of NOX somewhat increases. When combustion temperature and O2 concentration do not change, NOX release is mainly affected by the reduction reaction of NO, which preliminarily indicates that a higher CO2 concentration (25–35%) leads to the decline of the reduction of NO.
3.3 Effects of CO2 concentration on NO reduction
NO reduction efficiency is calculated by eqn (2)
 | (2) |
Fig. 10(a) shows the variation of NO concentration during NO reduction by sludge reburning under different CO2 concentrations. There are three stages in the reaction between sludge and NO with oxygen concentration of 3%. The first stage is that the NO concentration increase and exceeds 600 mg m−3. When sludge is added to the reaction tube at one time (completed in 2 s), volatiles and fixed carbon are burned to generate large amounts of NO under well-oxygenated conditions. The amount of NO generated exceeds the amount that of reduced by reducing gas and nascent char. Therefore, the initial stage is dominated by the NO oxidation. At the second stage, with the gradual release of reducing gases (HCN, CO, CH4 and NH3), O2 in atmosphere is depleted quickly and is correspondingly insufficient surrounding the reducing species. Therefore, the amount of NO reduced by reducing gases and char is more than the amount of NO generated. This stage is dominated by the NO reduction, which decreases the NO concentration to less than 600 mg m−3 at the reactor outlet. At the last stage, as the reaction continues, the residual volatiles and char gradually decreased. The rate of O2 consumption becomes correspondingly lower, and O2 is sufficient to oxidize the reducing gases and char. Thus, the rate of NO reduction by reducing gases and char is lower than that of NO formation. The NO concentration at the reactor outlet is more than 600 mg m−3 again. This stage is dominated by NO oxidation.35
NO reduction efficiency at the reduction stage (second stage) is displayed in Fig. 10(b). It is observed that CO2 concentration affects NO reduction. NO reduction efficiency follows a pattern of first increasing and then decreasing with the increase of CO2 concentration. When the CO2 concentration increased from 0 to 25 vol%, NO reduction efficiency showed a slightly increasing trend. As the CO2 concentration further increased (25–35 vol%), the NO reduction clearly decreased. The optimal NO reduction efficiency is 54% at a CO2 concentration of 25 vol% during sludge reburning. Results suggest that a comparatively higher NO reduction efficiency (more than 50%) could be acquired during sludge reburning with a CO2 concentration of 10–30 vol%.
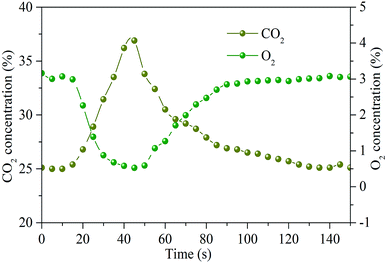
As presented in Fig. 11, variation of O2 and CO2 concentrations during sludge combustion also have some effects on NO reduction. When the sludge is added downward into the reaction tube, O2 in the atmosphere is consumed quickly, and a large amount of CO2 is generated during the combustion process. Compared with Fig. 10, there is a valley value for O2 consumption and a peak value for CO2 generation when the NO reduction efficiency reaches the maximum value. At the same time, the combustion reaction of sludge is the most severe, which is consistent with the variation of NO concentration.
3.4 Homogeneous and heterogeneous mechanisms of NO reduction
TEM investigations give information on the morphology and structural characteristics of sludge char. Fig. 12(a) and (b), show that sludge char has two-dimensional sheet-like nanostructure. The structure is compact with some clearly visible cracks. The crystal at different orientations can be observed (Fig. 12(c)), suggesting that the char nanosheets are composed of numerous crystalline subunits with various orientations. The nitrogen adsorption–desorption isotherms and corresponding pore size distribution curves of sludge char are shown in Fig. 12(d). The specific surface area of char is 70 m2 g−1, which offers lots of active sites and increases the adsorption of reactants. The isotherm of char is type V with an H3-type hysteresis loop within a relative pressure range of 0.4 to 1.0. A narrow distribution range of pore size from 1 to 10 nm can also been found, indicating a mesoporous feature (2–50 nm). The specific surface areas, pore volume, and pore size of char are provided in Table 3.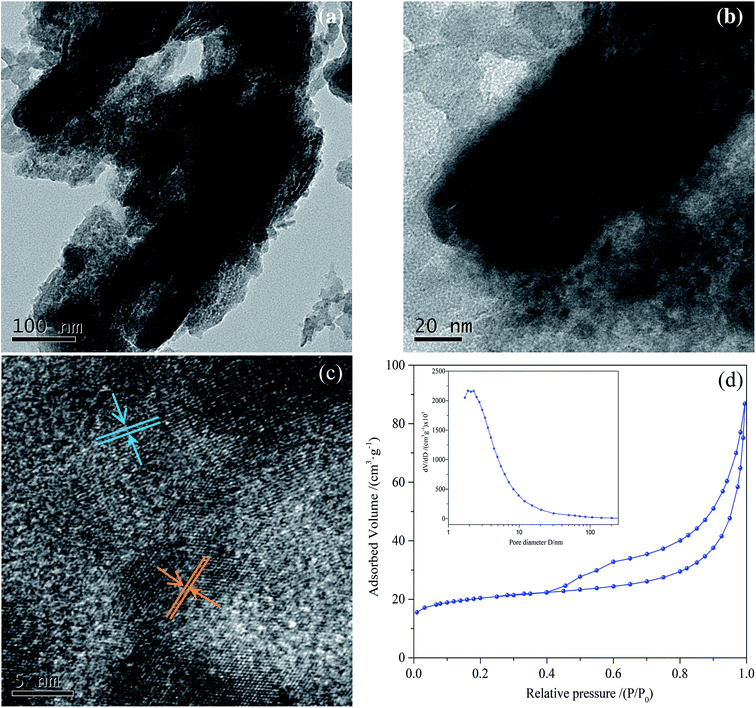 | ||
| Fig. 12 TEM (a–c) images, nitrogen adsorption–desorption isotherms and the corresponding size distribution curves (inset) of (d) sludge char. | ||
| Sample | SBET (m2 g−1) | Total volume (cm3 g−1) | Peak pore size (nm) | Optimal NO reduction ratio |
|---|---|---|---|---|
| Sludge char | 70.12 | 0.12 | 6.63 | 11% |
Dynamic properties of NO reduction by sludge char are shown in Fig. 13. The optimum NO reduction efficiency by char reburning is 11%. The reducing capacity of char may be associated with the specific surface area and the distribution of active sites. On the basis of the previous discussion, the reduction efficiency of NO by sludge reburning can reach 54% under the same conditions, which implies that the reducing gases have an important influence on the NO reduction efficiency. The results indicate that NO reduction is dominated by the gas–gas homogeneous reduction reactions during sludge reburning.
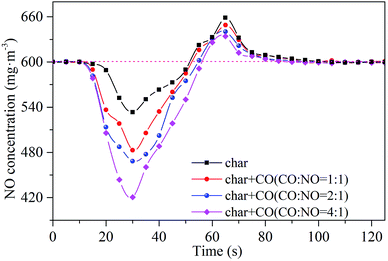 | ||
| Fig. 13 Dynamic properties of NO reduction by CO in the presence of sludge char. Reaction conditions: 600 mg m−3 of NO, 25 vol% of CO2, 3 vol% of O2, and balanced N2, temperature = 900 °C. | ||
In order to characterize the gas–gas homogeneous reduction reactions, the dynamic processes of NO reduction by CO are investigated. CO exhibited negligible activity on the reduction of NO from the result of blank experiment. The addition of CO can improve NO reduction efficiency in the presence of char, which confirm that the NO reduction by CO requires the presence of catalysts.36 Compared with the case without CO, the NO reduction increased about 8.5% and 19% corresponding to the CO concentration of 600 and 2400 mg m−3, respectively. The increase of NO reduction efficiency over sludge char is attributed to the enhancement of solid–gas reaction between NO and char and its surface-catalyzed reaction of NO with CO.36 The results indicate that the reactions between CO, NO and char play an important role in NO reduction, especially under a relatively higher concentration ratio of CO to NO. The highest reduction ratio of 30% is achieved when the concentration ratio of CO to NO is 4![[thin space (1/6-em)]](https://www.rsc.org/images/entities/char_2009.gif) :
:![[thin space (1/6-em)]](https://www.rsc.org/images/entities/char_2009.gif) 1.
1.
NO can react with NH3 to produce the final product N2, which involves three reactions presented as eqn (3)–(5):14,18,37
| NH3 + ˙O → ˙NH2 + ˙OH | (3) |
| NH3 + ˙OH → ˙NH2 + H2O | (4) |
| ˙NH2 + NO → N2 + H2O | (5) |
When the moisture content of 0%, the gas–gas homogeneous phase reaction between NO and NH3 does not occur without moisture. Thus, it is reasonable to deduce that ˙OH and ˙O radicals involved in these reactions initially come from the thermal decomposition of H2O.14,15 To investigate the gas–gas homogeneous reduction reactions of NH3 to NO, a certain amount of water vapor needs to be added. The influence of NH3 concentration on NO reduction with an H2O concentration of 3 vol% is shown in Fig. 14(a). The NO reduction efficiency (52.3%) under a NH3 concentration of 1200 mg m−3 is much higher than that under a NH3 concentration of 300 mg m−3 (29.6%). The significantly improved NO reduction can be ascribed to the increase of molecular weight of NH3 in unit gas and the more sufficient reaction contact areas. When the concentration ratio of NH3 to NO continually increases to 4![[thin space (1/6-em)]](https://www.rsc.org/images/entities/char_2009.gif) :
:![[thin space (1/6-em)]](https://www.rsc.org/images/entities/char_2009.gif) 1, the NO reduction efficiency only increases to 56%. Besides, the influence of CH4 concentration on NO reduction is presented in Fig. 14(b). When the concentration ratio of CH4 to NO is 4
1, the NO reduction efficiency only increases to 56%. Besides, the influence of CH4 concentration on NO reduction is presented in Fig. 14(b). When the concentration ratio of CH4 to NO is 4![[thin space (1/6-em)]](https://www.rsc.org/images/entities/char_2009.gif) :
:![[thin space (1/6-em)]](https://www.rsc.org/images/entities/char_2009.gif) 1, the NO reduction efficiency is only 6%, which shows that CH4 exhibits negligible effect on NO reduction compared with CO and NH3. CH4 can be decomposed into CHi radicals, which react with NO to form HCN.14,19 Theoretically, the reduction of NO by CH4 will show high efficiency. However, the actual results are opposite. It is reasonable to deduce that when CHi radicals react with NO to form HCN. The generated HCN will be oxidized to NO as a precursor under the condition of a certain residence time (approximately 1.5 s), reaching a balance between the reduction and oxidation of NO.
1, the NO reduction efficiency is only 6%, which shows that CH4 exhibits negligible effect on NO reduction compared with CO and NH3. CH4 can be decomposed into CHi radicals, which react with NO to form HCN.14,19 Theoretically, the reduction of NO by CH4 will show high efficiency. However, the actual results are opposite. It is reasonable to deduce that when CHi radicals react with NO to form HCN. The generated HCN will be oxidized to NO as a precursor under the condition of a certain residence time (approximately 1.5 s), reaching a balance between the reduction and oxidation of NO.
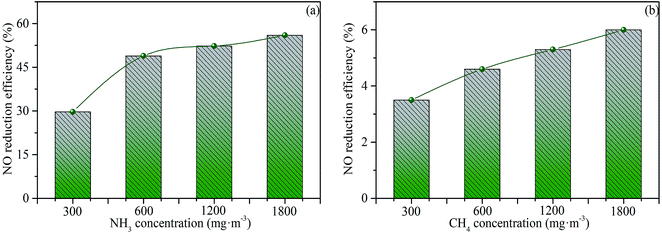 | ||
| Fig. 14 Efficiency of NO reduction by NH3 (a) and CH4 (b). Reaction conditions: 600 mg m−3 of NO, 3 vol% of O2, 25 vol% of CO2, 3 vol% of H2O, and balanced N2, temperature = 900 °C. | ||
3.5 The mechanism of the effect of CO2 concentration on NO reduction
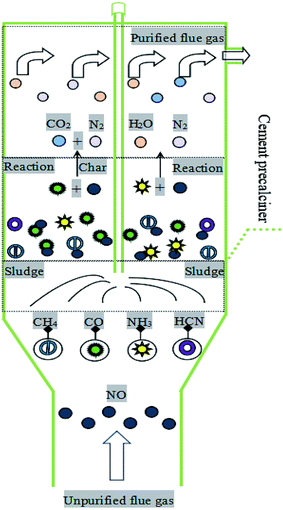
The mechanistic study on the effects of CO2 concentration on NO reduction by sludge reburning is carried out in a pilot scale cement precalciner. In combination with the above results, the mechanism of the effect of CO2 concentration on NO reduction is proposed, as shown in Fig. 15. The CO2 promotes the CO release significantly and inhibits the release of HCN, NH3 and CH4 when CO2 concentration increase from 0 to 25 vol%. The CO is confirmed to be one of the dominant reactive species during NO reduction.36 Hence, the increase of CO release counteracts the negative effect of the decrease of NH3, HCN, and CH4 release on the NO reduction, which leads to the significant increase of NO reduction efficiency from 44% to 54%. When CO2 concentration continuously increases to 35 vol%, the local reaction temperature decreases due to the strong radiation absorption of CO2, which results in the weakening of gasification rate.14,31 Thus, the releases of CO and HCN decrease slightly and obviously accordingly. NH3 released is relatively stable. Besides, CH4 released increases significantly, while CH4 play a negligible role in the reduction of NO. As a result, there is an optimum CO2 concentration of 25 vol% for the NO reduction. Lower or higher than this concentration will result in the decrease of NO reduction efficiency.4 Conclusion
The effects of CO2 concentration on the release of reducing gases and NO reduction during sewage reburning are investigated. The main conclusions are summarized as follows:(1) CO2 concentration plays an important role on NO reduction during sludge reburning. The maximum NO reduction efficiency of 54% can be achieved with a CO2 concentration of 25 vol%. It is feasible to use sludge as a reducing agent for NO reduction in the cement industry.
(2) The homogeneous and heterogeneous reduction reactions of NO occur simultaneously during sludge reburning. According to the reduction performance of NO by NH3, CO, CH4 and sludge char, CO and NH3 make greater contributions to the NO reduction than sludge char. So NO reduction is dominated by homogeneous reduction reactions.
(3) The main types of reducing gases produced during sludge reburning are HCN, NH3, CO and CH4. Among them, NH3 is mainly derived from low volatility components combustion, while HCN, CO and CH4 are produced from thermally unstable and stable functional groups. Meanwhile, CO2 concentration plays an important role in the release of HCN, CO and CH4. The influence of CO2 concentration on NO reduction is mainly attributed to the CO released.
Conflicts of interest
The authors declare that they have no conflicts of interest regarding the publication of this paper.Acknowledgements
This work was supported by the National Natural Science Foundation of China (NSFC-51778264), the Youth Top-notch Talent Special Support Program of Guangdong Province (2016TQ03Z576), the Project of Science and Technology Program of Guangdong Province (2017B020237002 and 2018B020208002), the Central-Level Nonprofit Scientific Institutes for Basic R&D Operations (PM-zx703-201904-080), the Pearl River S&T Nova Program of Guangzhou (201610010150 and 201710010133).References
- J. L. Yang, W. J. Xu, C. He, Y. J. Huang, Z. L. Zhang, Y. C. Wang, L. L. Hu, D. H. Xia and D. Shu, One-step synthesis of silicon carbide foams supported hierarchical porous sludge-derived activated carbon as efficient odor gas adsorbent, J. Hazard. Mater., 2018, 344, 33–41, DOI:10.1016/j.jhazmat.2017.09.056.
- X. Zhang, H. Cai, J. Shen and H. Zhang, Effects of potassium permanganate conditioning on dewatering and rheological behavior of pulping activated sludge: mechanism and feasibility, RSC Adv., 2018, 8, 41172–41180, 10.1039/c8ra07822j.
- A. Ronda, A. Gómez-Barea, P. Haro, V. F. de Almeida and J. Salinero, Elements partitioning during thermal conversion of sewage sludge, Fuel Process. Technol., 2018, 186, 156–166, DOI:10.1016/j.fuproc.2019.01.001.
- S. Bouregaya, L. Kacimi, C. Patapy and P. Clastres, Synthesis of alite cement with low environmental impact by using sludge from a dam reservoir and zinc sulphate as a mineralizer, Constr. Build. Mater., 2018, 190, 752–764, DOI:10.1016/j.conbuildmat.2018.09.012.
- S. Naamane, Z. Rais and M. Taleb, The effectiveness of the incineration of sewage sludge on the evolution of physicochemical and mechanical properties of Portland cement, Constr. Build. Mater., 2016, 112, 783–789, DOI:10.1016/j.conbuildmat.2016.02.121.
- M. Horttanainen, J. Kaikko, R. Bergman, M. Pasila-Lehtinen and J. Nerg, Performance analysis of power generating sludge combustion plant and comparison against other sludge treatment technologies, Appl. Therm. Eng., 2010, 30(2–3), 110–118, DOI:10.1016/j.applthermaleng.2009.07.005.
- Y. Z. Zhao, Q. Q. Ren and Y. J. Na, Influence of operating parameters on arsenic transformation during municipal sewage sludge incineration with cotton stalk, Chemosphere, 2018, 193, 951–957, DOI:10.1016/j.chemosphere.2017.11.126.
- W. L. Y. Lin, W. C. Ng, B. S. E. Wong, S. L. M. Teo, G. Sivananthan, G. H. Baeg, Y. S. Ok and C. H. Wang, Evaluation of sewage sludge incineration ash as a potential land reclamation material, J. Hazard. Mater., 2018, 357, 63–72, DOI:10.1016/j.jhazmat.2018.05.047.
- A. Raheem, V. S. Sikarwar, J. He, W. Dastyar, D. D. Dionysiou, W. Wang and M. Zhao, Opportunities and challenges in sustainable treatment and resource reuse of sewage sludge: A review, Chem. Eng. J., 2018, 337, 616–641, DOI:10.1016/j.cej.2017.12.149.
- Z. Pavlík, J. Fort, M. Zaleska, M. Pavlíkova, A. Trník, I. Medved, M. Keppert, P. G. Koutsoukos and R. Cerný, Energy-efficient thermal treatment of sewage sludge for its application in blended cements, J. Cleaner Prod., 2016, 112, 409–419, DOI:10.1016/j.jclepro.2015.09.072.
- Y. Y. Huang, H. X. Li, Z. W. Jiang, X. J. Yang and Q. Chen, Migration and transformation of sulfur in the municipal sewage sludge during disposal in cement kiln, Waste Manage., 2018, 77, 537–544, DOI:10.1016/j.wasman.2018.05.001.
- M. Georgiopoulou and G. Lyberatos, Life cycle assessment of the use of alternative fuels in cement kilns: a case study, J. Environ. Manage., 2018, 216, 224–234, DOI:10.1016/j.jenvman.2017.07.017.
- S. L. Fu, Q. Song and Q. Yao, Study on the catalysis of CaCO3 in the SNCR deNOX process for cement kilns, Chem. Eng. J., 2015, 262, 9–17, DOI:10.1016/j.cej.2014.09.048.
- P. Fang, Z. J. Tang, X. Xiao, J. H. Huang, X. B. Chen, P. Y. Zhong, Z. X. Tang and C. P. Cen, Using sewage sludge as a flue gas denitration agent for the cement industry:Factor assessment and feasibility, J. Cleaner Prod., 2019, 224, 292–303, DOI:10.1016/j.jclepro.2019.03.175.
- W. Y. Fan, T. L. Zhu, Y. F. Sun and D. Lv, Effects of gas compositions on NOX reduction by selective non-catalytic reduction with ammonia in a simulated cement precalciner atmosphere, Chemosphere, 2014, 113, 182–187, DOI:10.1016/j.chemosphere.2014.05.034.
- S. Werle, Possibility of NOX emission reduction from combustion process using sewage sludge gasification gas as an additional fuel, Arch. Environ. Prot., 2012, 38(3), 81–89, DOI:10.2478/v10265-012-0027-3.
- D. Lv, T. L. Zhu, R. W. Liu, Q. Z. Lv, Y. Sun, H. M. Wang, Y. Liu and F. Zhang, Effects of co-processing sewage sludge in cement kiln on NOx, NH3 and PAHs emissions, Chemosphere, 2016, 159, 595–601, DOI:10.1016/j.chemosphere.2016.06.062.
- Y. Shu, F. Zhang, H. C. Wang, J. W. Zhu, G. Tian, C. Zhang, Y. T. Cui and J. Y. Huang, An experimental study of NO reduction by biomass reburning and the characterization of its pyrolysis gases, Fuel, 2015, 139, 321–327, DOI:10.1016/j.fuel.2014.08.071.
- R. A. Zhang, C. Y. Liu, R. H. Yin, J. Duan and Y. H. Luo, Experimental and kinetic study of the NO-reduction by tar formed from biomass gasification using benzene as a tar model component, Fuel Process. Technol., 2011, 92, 132–138, DOI:10.1016/j.fuproc.2010.09.016.
- E. Benhelal, G. Zahedi, E. Shamsaei and A. Bahadori, Global strategies and potentials to curb CO2 emissions in cement industry, J. Cleaner Prod., 2013, 51, 142–161, DOI:10.1016/j.jclepro.2012.10.049.
- U. Kääntee, R. Zevenhoven, R. Backman and M. Hupa, Cement manufacturing using alternative fuels and the advantages of process modelling, Fuel Process. Technol., 2004, 85(4), 293–301, DOI:10.1016/s0378-3820(03)00203-0.
- J. B. Chen, L. Mu, B. Jiang, H. C. Yin, X. G. Song and A. M. Li, TG/DSC-FTIR and Py-GC investigation on pyrolysis characteristics of petrochemical wastewater sludge, Bioresour. Technol., 2015, 192, 1–10, DOI:10.1016/j.biortech.2015.05.031.
- H. M. Xiao, X. Q. Ma and K. Liu, Co-combustion kinetics of sewage sludge with coal and coal gangue under different atmospheres, Energy Convers. Manage., 2010, 51(10), 1976–1980, DOI:10.1016/j.enconman.2010.02.030.
- Y. Y. Du, X. G. Jiang, G. J. Lv, X. J. Ma, Y. Q. Jin, F. Wang, Y. Chi and J. H. Yan, Thermal behavior and kinetics of bio-ferment residue/coal blends during co-pyrolysis, Energy Convers. Manage., 2014, 88, 459–463, DOI:10.1016/j.enconman.2014.08.068.
- Z. X. Xu, L. Xu, J. H. Cheng, Z. X. He, Q. Wang and X. Hu, Investigation of pathways for transformation of N-heterocycle compounds during sewage sludge pyrolysis process, Fuel Process. Technol., 2018, 182, 37–44, DOI:10.1016/j.fuproc.2018.10.020.
- H. Liu, Q. Zhang, H. Y. Hu, P. Liu, X. W. Hu, A. J. Li and H. Yao, Catalytic role of conditioner CaO in nitrogen transformation during sewage sludge pyrolysis, Proc. Combust. Inst., 2015, 35(3), 2759–2766, DOI:10.1016/j.proci.2014.06.034.
- X. P. Li, S. H. Zhang, W. Yang, Y. Liu, H. P. Yang and H. P. Chen, Evolution of NOx Precursors during Rapid Pyrolysis of Coals in CO2 Atmospheres, Energy Fuels, 2015, 29(11), 7474–7482, DOI:10.1021/acs.energyfuels.5b01509.
- Y. Tian, J. Zhang, W. Zuo, L. Chen, Y. N. Cui and T. Tan, Nitrogen Conversion in Relation to NH3 and HCN during Microwave Pyrolysis of Sewage Sludge, Environ. Sci. Technol., 2013, 47(7), 3498–3505, DOI:10.1021/es304248j.
- Q. L. Sun, W. Li, H. K. Chen and B. Q. Li, The CO2-gasification and kinetics of Shenmu maceral chars with and without catalyst, Fuel, 2004, 83(13), 1787–1793, DOI:10.1016/j.fuel.2004.02.020.
- F. S. Liu, H. S. Guo and G. J. Smallwood, The chemical effect of CO2 replacement of N2 in air on the burning velocity of CH4 and H2 premixed flames, Combust. Flame, 2003, 133(4), 495–497, DOI:10.1016/S0010-2180(03)00019-1.
- Y. Hu, S. Naito, N. Kobayashi and M. Hasatani, CO2, NOx and SO2 emissions from the combustion of coal with high oxygen concentration gases, Fuel, 2000, 79(15), 1925–1932, DOI:10.1016/s0016-2361(00)00047-8.
- S. P. Gao, J. T. Zhao, Z. Q. Wang, J. F. Wang, Y. T. Fang and J. J. Huang, Effect of CO2 on pyrolysis behaviors of lignite, J. Fuel Chem. Technol., 2013, 41(13), 257–264, DOI:10.1016/s1872-5813(13)60017-1.
- Z. Q. Bai, H. K. Chen, W. Li and B. Q. Li, Study on the thermal performance of metallurgical coke under methane ba TG-MS, J. Fuel Chem. Technol., 2005, 33(4), 426–430 CAS.
- C. Z. Li and L. L. Tan, Formation of NOx and SOx precursors during the pyrolysis of coal and biomass. Part III. Further discussion on the formation of HCN and NH3 during pyrolysis, Fuel, 2000, 79(15), 1899–1906, DOI:10.1016/s0016-2361(00)00008-9.
- G. Lv, J. D. Lu, L. Q. Cai, X. H. Xie and Z. X. Liu, Experimental Study on the Dynamic Process of NO Reduction in a Precalciner, Ind. Eng. Chem. Res., 2011, 50(8), 4366–4372, DOI:10.1021/ie102118c.
- L. Dong, S. Q. Gao, W. L. Song and G. W. Xu, Experimental study of NO reduction over biomass char, Fuel Process. Technol., 2007, 88, 707–715, DOI:10.1016/j.fuproc.2007.02.005.
- P. Fang, Z. J. Tang, J. H. Huang, C. P. Cen, Z. X. Tang and X. B. Chen, Using sewage sludge as a denitration agent and secondary fuel in a cement plant: A case study, Fuel Process. Technol., 2015, 137, 1–7, DOI:10.1016/j.fuproc.2015.03.014.
| This journal is © The Royal Society of Chemistry 2019 |

