 Open Access Article
PdO/SnO2 heterostructure for low-temperature detection of CO with fast response and recovery†
Pengjian Wang‡
 ab,
Tingbiao Yuan‡b,
Huifang Yuana,
Xiaoyan Zheng*a,
Hamza Ijazb,
Junfeng Huia,
Daidi Fan
 a,
Yuxin Zhao
 *c and
Shi Hu
 *b
*b
aShaanxi Key Laboratory of Degradable Biomedical Materials, Shanxi R&D Center of Biomaterials and Fermentation Engineering, School of Chemical and Engineering, Northwest University, Xian, Shaanxi 710069, China. E-mail: zy129@126.com
bDepartment of Chemistry, School of Science, Tianjin Key Laboratory of Molecular Optoelectronic Science, Tianjin University, Tianjin 300072, China. E-mail: rychushi@gmail.com
cXi'an Jiaotong University, School of Chemical Engineering and Technology, Xian, Shannxi 710049, China. E-mail: zhaoyuxin1@yeah.net
First published on 24th July 2019
Abstract
In this paper, we developed a simple two-step route to prepare a PdO/SnO2 heterostructure with the diameter of the SnO2 and PdO nanoparticles at about 15 nm and 3 nm, respectively. In the evaluation temperature window between 80 °C and 340 °C, PdO/SnO2 shows the best response to 100 ppm of CO at 100 °C with fast response time (14 s) and recovery time (8 s). Furthermore, the PdO/SnO2 nanoparticles exhibit a low detection limit and good selectivity to CO against interfering gases as well as rarely-seen low-temperature stability and reversibility. Such enhanced gas sensing performance could be attributed to both the ultrafine structure of PdO and the synergy between PdO and SnO2. The results clearly indicate the application of PdO/SnO2 as a pratical low-temperature sensing material for CO.
1. Introduction
Carbon monoxide (CO) is a colorless, odorless and toxic gas, which is mostly produced by the incomplete combustion of fossil fuels as well as biomass and commonly found in the emission of automobile exhaust. CO is highly poisonous as it competitively binds to the hemoglobin in place of oxygen within the blood of many animals, interfering with the respiratory function.1 Exposure to high concentrations of CO for 5 minutes (at 5000 ppm) can be fatal while excessive exposure to lower concentrations could lead to symptoms including headache, nausea, vomiting and dizziness. Injury and death caused by excessive CO exposure has been one of the most common types of poisoning in many countries and the occupational safety and health administration sets a limit of 50 ppm for the long-term workplace exposure of CO.2 In addition, it is a temporary atmospheric pollutant in many urban areas, giving rise to the formation of photochemical smog. Therefore, effective CO sensors with high sensitivity, reliability, and rapid detection for household, industrial and environmental monitoring are in great demand.To date, various gas sensors have been applied in CO gas monitoring, such as optical sensors,3 metal oxide semiconductor sensors,4,5 conducting polymeric sensors,6 thermoelectric sensors,7 etc. Among these CO gas sensors, metal oxide semiconductor sensors present huge advantages because of their simple implementation, convenience and efficiency, low cost and good reliability.8,9 Among all metal oxide semiconductors in gas sensing, SnO2 is the most widely used material because it is stable and can be used for various applications including detection of CO.10–12 At present, there are many possible ways to improve the sensing performance of gas sensors, including doping, surface modification, heterojunction formation, etc.13,14 One effective method is the decoration or doping of the sensing materials with noble metals like Au, Ag, Pt and Pd. Because of their special catalytic activity when analytes (such as CO and H2) are adsorbed on the sensor surface, they can effectively improve the sensing performance.15–18 For example, SnO2 nanoparticles decorated with 3 nm platinum exhibit 30 fold of response enhancement for NH3 detection as well as increased linearity and faster response and recovery.19 Highly sensitive and selective gas sensor using sputtering-decorated Pd/MnO2 nanowalls provide fast response/recovery for H2 within the concentration of 10–10![[thin space (1/6-em)]](https://www.rsc.org/images/entities/char_2009.gif) 000 ppm.20 Furthermore, several kinds of carbon monoxide sensors doped with palladium based on SnO2 have been reported in the literature. For instance, Pan et al. reported that PdO modification on SnO2 prepared by RF reactive sputtering improved the response of carbon monoxide compared with the pure SnO2.21 Chen et al. found that the composite of Pd and SnO2 with different valence states had great influence on CO gas sensing properties.22
000 ppm.20 Furthermore, several kinds of carbon monoxide sensors doped with palladium based on SnO2 have been reported in the literature. For instance, Pan et al. reported that PdO modification on SnO2 prepared by RF reactive sputtering improved the response of carbon monoxide compared with the pure SnO2.21 Chen et al. found that the composite of Pd and SnO2 with different valence states had great influence on CO gas sensing properties.22
Although gas sensors of CO have been well commercialized, there are still many problems regarding power consumption, safety, and detection efficiency for industrial and daily life. Many researchers have reported CO sensor with high response, fast response and recovery time at high temperature which requires high power consumption to operate.23–25 In addition, CO is a flammable and explosive gas, and hence high detection temperature will impose additional risks of explosion. Meanwhile, many researchers have reported the detection of CO at room temperature, which is typically compromised by the low sensitivity, long response and recovery time, and poor long-term stability issue.10,11,26 Therefore, it is necessary to develop a method for better and faster response and recovery to CO at low temperature.
Herein we report a simple hydrothermal and ultrasonication process followed by calcination route to synthesize PdO-loaded SnO2 nanoparticles, with diameter of ca. 3 nm and 15 nm, respectively. The ultrathin structure will provide more adsorption sites for oxygen species. The ultrathin structure will provide more oxygen species adsorbed sites that would greatly enhance the performance of the gas sensor. The PdO/SnO2 sensors exhibit fast response time and recovery time to 100 ppm of CO at a temperature of 100 °C. Furthermore, PdO/SnO2 sensors have achieved excellent repeatability, selectivity and long-term stability at low temperature.
2. Experimental procedure
2.1 Chemicals
Tin(II) chloride dihydrate (SnCl2·2H2O), absolute ethanol were purchased from Sinopharm Chemical Reagent Co. Ltd. Urea was purchased from Shanghai Aladdin Co. Ltd. Palladium acetate (Pd(OAc)2), polyvinyl pyrrolidone (PVP, MW = 24![[thin space (1/6-em)]](https://www.rsc.org/images/entities/char_2009.gif) 000), ethylene glycol (EG) were purchased from Shanghai Macklin Biochemical Co. Ltd. All chemicals were used as received without further purification. Deionized water was used throughout the experiments.
000), ethylene glycol (EG) were purchased from Shanghai Macklin Biochemical Co. Ltd. All chemicals were used as received without further purification. Deionized water was used throughout the experiments.
2.2 Synthesis of materials
![[thin space (1/6-em)]](https://www.rsc.org/images/entities/char_2009.gif) 800 rpm, 5 min) and finally dried at 60 °C for 12 h. The products were further calcined at 500 °C for 2 h with a heating rate 5 °C min−1 to obtain the final product of PdO/SnO2.27
800 rpm, 5 min) and finally dried at 60 °C for 12 h. The products were further calcined at 500 °C for 2 h with a heating rate 5 °C min−1 to obtain the final product of PdO/SnO2.272.3 Materials characterization
Scanning electron microscopy (SEM) images of the samples were performed on FEI Nova Nano 230. The morphology and EDX-mapping of PdO NPs loaded on SnO2 were characterized by high resolution transmission electron microscope (HRTEM, FEI Tecnai G2 F20 S-Twin). The crystal structure of the samples were probed using X-ray diffraction (XRD, Cu Kα radiation, λ = 0.15406 nm, PANalytical) at 40 kV and 40 mA. The surface information was obtained from X-ray photoelectron spectroscope (XPS, Thermo Escalab 250Xi).2.4 Fabrication and measurement of gas sensors
To fabricate the gas sensors, the PdO/SnO2 powder was mixed with terpineol at a weight ratio of 46![[thin space (1/6-em)]](https://www.rsc.org/images/entities/char_2009.gif) :
:![[thin space (1/6-em)]](https://www.rsc.org/images/entities/char_2009.gif) 1 to form a paste. Then, the resulting paste was coated on the surface of a ceramic tube (1.2 mm in diameter and 4 mm in length), on which a pair of Au electrodes (distance: 1.0 mm) attached with Pt wires were printed at each end. A small Ni–Cr alloy heating coil was inserted into the middle of the ceramic tube. A pair of gold electrodes were printed at each end of the ceramic tube before it was coated with the paste as shown in Fig. S1.† The ceramic tube was welded to the hexagonal base after the material was dried naturally in the air. Next, the sensing material was aged on state (Weisheng Electronics Co. Ltd. Zhengzhou, China) at 440 °C for 24 h continuously. The whole test environment was in the air atmosphere with a humidity level controlled at 35–45%. The purpose was to remove the terpineol and to generate a dense oxide film on the surface of the gas sensor.28
1 to form a paste. Then, the resulting paste was coated on the surface of a ceramic tube (1.2 mm in diameter and 4 mm in length), on which a pair of Au electrodes (distance: 1.0 mm) attached with Pt wires were printed at each end. A small Ni–Cr alloy heating coil was inserted into the middle of the ceramic tube. A pair of gold electrodes were printed at each end of the ceramic tube before it was coated with the paste as shown in Fig. S1.† The ceramic tube was welded to the hexagonal base after the material was dried naturally in the air. Next, the sensing material was aged on state (Weisheng Electronics Co. Ltd. Zhengzhou, China) at 440 °C for 24 h continuously. The whole test environment was in the air atmosphere with a humidity level controlled at 35–45%. The purpose was to remove the terpineol and to generate a dense oxide film on the surface of the gas sensor.28
The electrical properties of the sensor were determined using a gas sensing analysis system (WS-30A, Zhengzhou Weisheng Tech Co, Ltd). During the test, a given amount of target gases mixed with dry air were injected into an 18 l chamber to obtain the desired concentration. The sensor response was defined as the ratio (S = Ra/Rg) of the resistance of the sensor in air (Ra) to that in target gases (Rg). The operating temperature of the sensor was varied between 80 °C to 340 °C. The response and recovery time (tres and trec) were defined as the time taken by the sensor to achieve 90% of the total resistance change in the case of adsorption and desorption, respectively.
3. Results and discussion
3.1 Morphology and structure
The PdO/SnO2 heterostructure was obtained from a two-step synthesis. The host NPs of SnO2 were obtained through hydrothermal hydrolysis of SnCl2 followed by calcination. The crystal structure of the as-obtained SnO2 and PdO/SnO2 NPs were characterized by X-ray diffraction (XRD). As shown in Fig. 1, all the diffraction peaks of the final product can be indexed to cassiterite, the tetragonal phase of SnO2 (JCPDS no. 41-1445), which is the same as the intermediate sample. According to Scherrer equation, the full width at half maximum (FWHM) of the (110) peak of the pattern corresponds to a crystal size of 15.6 nm and that of (101) peaks yields a crystal size of 14.8 nm. The peaks of palladium oxide are too weak to be identified in the product and the absence is attributed to the low loading amount of palladium and smaller size of the oxide nanoparticles, which can be identified through the following TEM observation.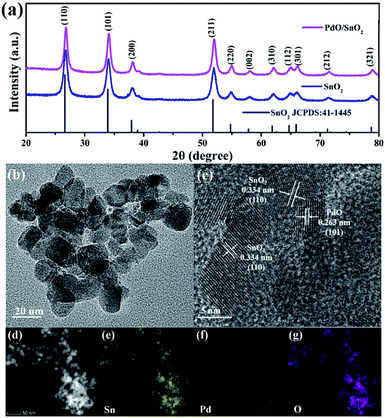 | ||
| Fig. 1 (a) XRD pattern of the PdO/SnO2 heterostructure and TEM images of SnO2 and PdO/SnO2; (b and c) TEM and HRTEM images of PdO/SnO2; (d) STEM and (e–g) EDX-mapping of PdO/SnO2. | ||
The morphology of the samples were examined by HRTEM and EDX-mapping. As can be seen from the HRTEM images of the pristine SnO2 and PdO/SnO2 in Fig. S2† and 1a and b, no clear difference can be identified on the size and shape of SnO2 nanoparticles with and without Pd loading. The diameter of the SnO2 nanoparticles generally sits between 10 and 20 nm and clear lattice fringes can be identified with layer spacing of 0.334 nm and 0.262 nm, corresponding to the (110) and (101) crystal planes of cassiterite SnO2. As shown in Fig. 1e, heterostructure is formed between the SnO2 nanoparticles and even smaller nanoparticles with a diameter of 3 nm, which are attributed to PdO with the lattice spacing of 0.263 nm corresponding to its (101) planes. The STEM and EDS-mapping in Fig. 1c and f indicates that Pd and Sn are uniformly distributed in the structure. To further verify the elemental contents of the as-prepared deposit, EDS characterization is conducted, as is shown in Fig. S3.† It clearly shows the presence of palladium and tin, with a quantitative elemental composition of 2.07 wt% Pd and 72.79 wt% Sn, respectively.
XPS was used to characterize the chemical environment at the surface of the catalyst. As shown in the full XPS survey of the PdO/SnO2 structure in Fig. 2, the presence of Pd, Sn and O elements in the sample are consistent with EDS-mapping result. More detailed information on chemical state of these elements can be obtained from the high-resolution XPS spectra of Pd 3d, O 1s and Sn 3d, as shown in Fig. 2b–d. The Pd 3d spectrum exhibited a doublet feature.29 The presence of Pd species on the PdO/SnO2 is evident from the Pd 3d5/2 peaks at 337.2 eV and 337.8 eV and Pd 3d3/2 peaks at 342.4 and 343.4 eV, which can be related to the presence of Pd(II) and Pd(IV) with a ratio of 2 to 1. Based on the above data, we believe that PdO/SnO2 sensing materials represents SnO2 nanocrystals containing PdO nanoparticle (i.e. PdO/PdO2). The O 1s peaks at 530.5 eV, 531.7 eV and 533.1 eV in PdO/SnO2, the three peaks at 530.2 eV, 531.4 eV and 532.9 eV belong to pristine SnO2. PdO/SnO2 shifts toward higher binding energy, which may be attributed to the heterostructure-induced charge transfer. The Sn 3d XPS spectra of both pristine SnO2 and PdO/SnO2 can be assigned to Sn4+ in SnO2. However, the peaks of Sn 3d in the heterostructure show a shift to a higher binding energy, i.e. from 494.7 eV to 495.0 eV for 3d3/2 and from 486.3 eV to 486.5 eV for 3d5/2, respectively, which can be ascribed to the interface-induced charge transfer. The Pd atoms distributed on the surface of SnO2 nanoparticles are tightly bound to the surface oxygen, forming Pd–O–Sn heterojunction structure. As the noble metal Pd has a stronger affinity to electrons as compared to Sn, the electron density at the reaction sites will be altered and the gas sensing performance enhanced.
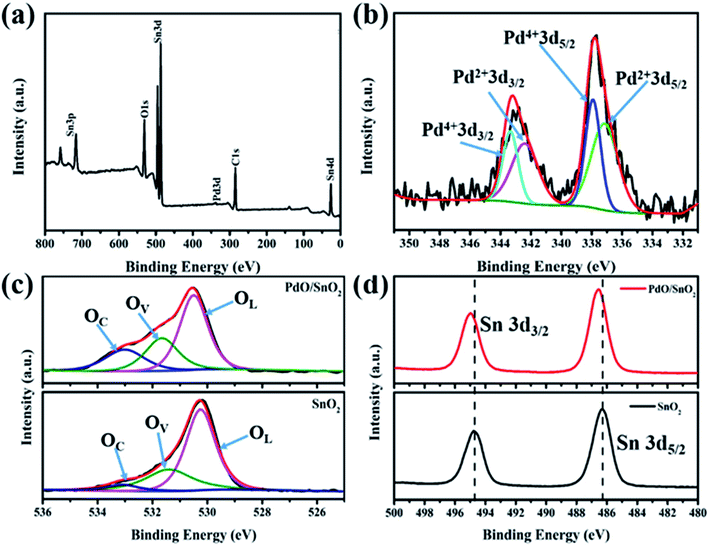 | ||
| Fig. 2 (a) The full XPS survey graph of PdO/SnO2; (b) Pd 3d XPS and (c) O 1s spectra of PdO/SnO2; (d) Sn 3d spectra of pristine SnO2 and PdO/SnO2. | ||
3.2 Gas sensing properties
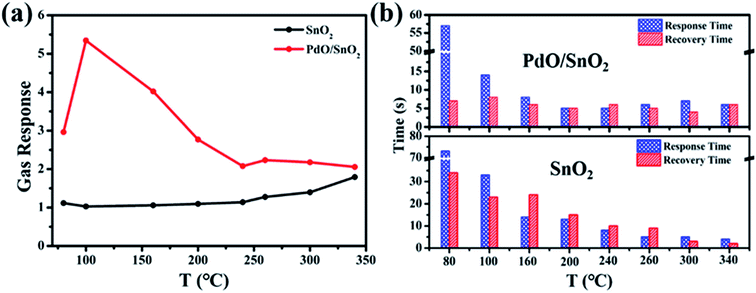
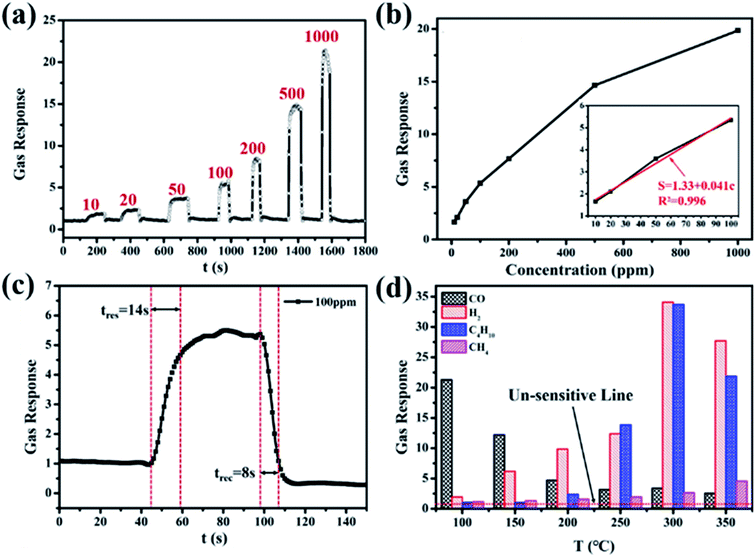
The gas sensing properties of SnO2 and PdO/SnO2 were evaluated on a chemoresistive gas-sensing workstation. Fig. 3a shows the response of pristine SnO2 and PdO/SnO2 to 100 ppm CO at different temperatures from 80 °C to 340 °C. The intrinsic SnO2 shows monotonically increasing response with the increase of temperature but the response is rather limited even at temperature above 300 °C. In contrast, PdO/SnO2 shows a maximum response to CO at 100 °C and the response to 100 ppm of CO is 5.4. Within the temperature range for evaluation, PdO/SnO2 exhibits much higher response compared with the intrinsic SnO2 with all the baseline resistance and recovery resistance of PdO/SnO2 and SnO2 shown in Table S1.† Besides sensitivity, the response time and recovery time are also important parameters for the evaluation of the gas sensor. Reduced power consumption afforded by low temperature usually come at the compromise of long response and recovery time. As shown in Fig. 3b, PdO/SnO2 shows a similar trend of decreasing response and recovery time with increasing temperature and the response time to CO at 80 °C is 57 seconds. However, it quickly drops at elevated temperatures, plateau at the temperature of 160 °C with a response time below 8 s. Meanwhile, the recovery time is within 8 seconds throughout the tested temperature range. To strike a balance between the reduced power at low temperature and reduced response–recovery time at high temperature, 100 °C was chosen as the optimum operating temperature for the further evaluation of PdO/SnO2.The response curve of the PdO/SnO2 to various concentrations of CO is evaluated at 100 °C, as shown in Fig. 4a. Resistance curve of PdO/SnO2 to various concentrations of CO gas ranging from 10 ppm to 1000 ppm can be seen in Fig. S4.† The response to a minimum concentration of 10 ppm is very obvious and a linear fitting can be obtained between the gas response and the CO concentration from 10 to 100 ppm, as shown in Fig. 4b. The response curve of PdO/SnO2 sensor to 100 ppm of CO at 100 °C is shown in Fig. 4c which yields a response time of 14 s and a recovery time of 8 s, which is good enough for most situations. The time is reduced to only 7 s and 6 s in the response to 1000 ppm of CO, and the response is 21, as is shown in Fig. S5.† For practical applications, gas sensors not only requires the materials to have highly sensitive response, but also demand good selectivity to the target gas. The response of PdO/SnO2 to several types of interfering gases are evaluated at the same operating temperature, including H2 (1000 ppm), CH4 (1000 ppm) and C4H10 (2000 ppm), as shown in Fig. 4d and S6.† Excellent selectivity to CO gas against H2, CH4 and C4H10 is shown in the response at 100 °C. Meanwhile, the selectivity of PdO/SnO2 to these gases are temperature-dependent, with obviously different selectivity at 200 and 300 °C.
The performance of PdO/SnO2 is compared to some of the previously reports on the composite of PdO and SnO2, as summarized in Table 1. Although some of them show even higher sensitivity to CO than that in this work, they come at the cost of higher operating temperature and higher power consumption. Beomseok Kim reported the material has a response of 1.9 to 18 ppm at 60 °C, but the response and recovery time is more than 60 s, which limits its application in daily life.11 In this work, we used PdO load on SnO2 and the response can achieve be 5.4 for 100 ppm of CO at 100 °C. The response time and recovery time are very short at 14 s and 8 s, which meets the requirement for practical applications.
Partical applications of gas-sensing materials require not only high response but also good reversibility and stability towards the target gases. The cyclic response curve of the sensor based on PdO/SnO2 is evaluated at 100 °C, as shown in Fig. 5a. Four reversible responses and recovery towards 100 ppm of CO can be identified in the figure, the same response value was detected for each cycle, which shows the excellent stability and reversibility of the sample used in the sensor. And four periods of resistance curve of the sensor to 100 ppm CO at 100 °C can be seen in Fig. S7.† In addition, the stability of the as-prepared PdO/SnO2 to 100 ppm CO gas at 100 °C was also investigated for a period of 20 days. As can be seen in Fig. 5b, the sensor demonstrates an excellent day-to-day consistency for the detection of CO, and there is no trend of degradation during the period of 20 days.
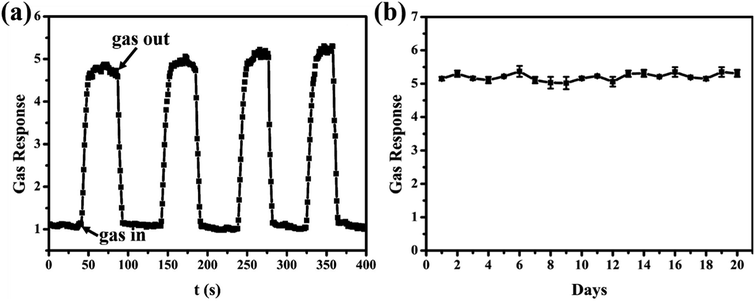 | ||
| Fig. 5 (a) Four periods of response curve of the sensor to 100 ppm CO at 100 °C; (b) long-term stability of the sensor based on PdO/SnO2 to 100 ppm CO at 100 °C. | ||
3.3 The gas sensing mechanism
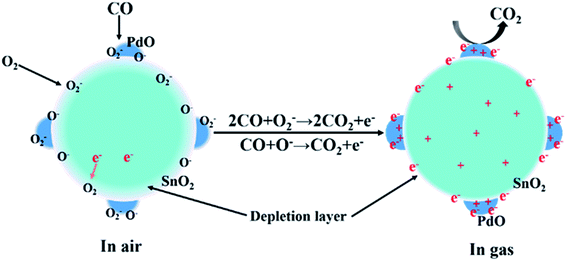
The interface of the hetero-junctioned materials has great influence on the performance of the gas sensor. As compared with the pristine SnO2, the PdO-loaded SnO2 nanoparticles are covered by uniform nanoparticles of PdO with a size of about 3 nm. This may lead to an increase of adsorption of CO, and ultimately lead to an improvement in the gas sensitivity.34 In addition, according to the XPS spectra of PdO/SnO2, the binding energy of O 1s and Sn 3d in PdO/SnO2 moves towards a higher binding energy than the pristine SnO2. This may be related to the charge transfer across the interface between PdO and SnO2 which modifies the electronic structure of SnO2 and improves the sensitivity to CO and overall gas-sensing performance.The gas-sensing mechanism is based on the resistance change of the sensing material accompanied by the adsorption and desorption of O2 on the surface of PdO/SnO2, as shown in Scheme 1. When the sensing material is exposed to the air, the surface of the materials will be covered by oxygen molecules in the form of O−, O2− and O2− by withdrawing electrons from the sensing materials. An electron-depletion layer will be formed and the resistance of the materials will increase due to the lack of charge carriers near the surface of the materials.35,36 The effective species vary at different temperature range, with O2− below 100 °C, O− between 100 and 300 °C, and O2− above 300 °C.37 At a low temperature of 100 °C, O2− or O− plays a major role in the catalytic oxidation of CO. When the sensor was exposed to the CO gas, these adsorbed oxygen species would react with CO molecules rapidly to form CO2 and the trapped electrons will be released to the sensing materials, thus decreasing the potential barrier and achieving a near steady state, the gas will be diffusing through the PdO/SnO2 and occupying the remaining surface reaction sites. As a result, the electron depletion layer and the resistance of PdO/SnO2 will decrease. In the presence of noble metal addition, attachment of ultrafine particles of PdO to the surface of SnO2, providing an elevated active surface area significantly promotes the adsorption and chemical reactions of CO on the surface of the oxide. In addition, the strong adsorption of noble metals to electrons cause the electrons to accumulate on the PdO surface, improving the response to CO and which results in high rates of gas adsorption and desorption thus enhancing the performance at low temperature.30,38
4. Conclusions
In summary, we have demonstrated that the PdO/SnO2 nanoparticles can be successfully synthesized through a simple hydrothermal and ultrasonic immersing process followed by calcination. The formation of PdO/SnO2 heterostructure was found to enhance the gas response of pristine SnO2 with decreased response and recovery time and enhanced selectivity at a low operation temperature of 100 °C. The excellent reversibility and long-term stability demonstrated at this low temperature strike a balance between the low power consumption and high reliability, which outruns most of the previous reports in a similar system and could pave the way for their applications in the commercial devices.Conflicts of interest
There are no conflicts to declare.Acknowledgements
This work was financially supported by the National Science Foundation of China under No. 21601133 and 21676215, China Postdoctoral Science Foundation (2018M633556) and Sinopec Innovation Scheme under A-381, and the Shaanxi Provincial Science Foundation (2017SF-201 and 2018JQ2052).Notes and references
- H. Gong, J. Q. Hu, J. H. Wang, C. H. Ong and F. R. Zhu, Sens. Actuators, B, 2006, 115, 247–251 CAS.
- S. T. Omaye, Toxicology, 2002, 180, 139–150 CAS.
- A. Paliwal, A. Sharma, M. Tomar and V. Gupta, Sens. Actuators, B, 2017, 250, 679–685 CAS.
- N. H. Ha, D. D. Thinh, N. T. Huong, N. H. Phuong, P. D. Thach and H. S. Hong, Appl. Surf. Sci., 2018, 434, 1048–1054 Search PubMed.
- A. Kumar, A. Sanger, A. Kumar and R. Chandra, RSC Adv., 2016, 6, 47178–47184 CAS.
- S. Radhakrishnan and S. Paul, Sens. Actuators, B, 2007, 125, 60–65 CAS.
- D. Nagai, T. Nakashima, M. Nishibori, T. Itoh, N. Izu and W. Shin, Sens. Actuators, B, 2013, 182, 789–794 CAS.
- Y. Wang, B. Liu, S. Xiao, X. Wang, L. Sun, H. Li, W. Xie, Q. Li, Q. Zhang and T. Wang, ACS Appl. Mater. Interfaces, 2016, 8, 9674–9683 CAS.
- D. R. Miller, S. A. Akbar and P. A. Morris, Sens. Actuators, B, 2014, 204, 250–272 CAS.
- P. Manjula, S. Arunkumar and S. V. Manorama, Sens. Actuators, B, 2011, 152, 168–175 CAS.
- B. Kim, Y. Lu, A. Hannon, M. Meyyappan and J. Li, Sens. Actuators, B, 2013, 177, 770–775 CAS.
- A. V. Marikutsa, M. N. Rumyantseva, L. V. Yashina and A. M. Gaskov, J. Solid State Chem., 2010, 183, 2389–2399 CAS.
- S. Tang, W. Chen, L. Xu and T. Gao, Nanosci. Nanotechnol. Lett., 2017, 9, 214–219 Search PubMed.
- D. Zhang, J. Wu and Y. Cao, J. Alloys Compd., 2019, 777, 443–453 CAS.
- S. Ren, G. Fan, S. Qu and Q. Wang, J. Appl. Phys., 2011, 110, 084312 Search PubMed.
- F. Li, S. Guo, J. Shen, L. Shen, D. Sun, B. Wang, Y. Chen and S. Ruan, Sens. Actuators, B, 2017, 238, 364–373 CAS.
- M. S. Barbosa, P. H. Suman, J. J. Kim, H. L. Tuller, J. A. Varela and M. O. Orlandi, Sens. Actuators, B, 2017, 239, 253–261 CAS.
- Y. Y. Xue, J. L. Wang, S. N. Li, Y. C. Jiang, M. C. Hu and Q. G. Zhai, J. Solid State Chem., 2017, 251, 170–175 CAS.
- X. Liu, N. Chen, B. Han, X. Xiao, G. Chen, I. Djerdj and Y. Wang, Nanoscale, 2015, 7, 14872–14880 CAS.
- A. Sanger, A. Kumar, A. Kumar and R. Chandra, Sens. Actuators, B, 2016, 234, 8–14 CAS.
- K.-C. Lee, Y.-J. Chiang, Y.-C. Lin and F.-M. Pan, Sens. Actuators, B, 2016, 226, 457–464 CAS.
- S. Zhu, Y. Liu, G. Wu, L. Fei, S. Zhang, Y. Hu, Z. Yan, Y. Wang, H. Gu and W. Chen, Sens. Actuators, B, 2019, 285, 49–55 CAS.
- C. Li, M. Lv, J. Zuo and X. Huang, Sensors, 2015, 15, 3789–3800 CAS.
- N. D. Cuong, D. Q. Khieu, T. T. Hoa, D. T. Quang, P. H. Viet, T. D. Lam, N. D. Hoa and N. V. Hieu, Mater. Res. Bull., 2015, 68, 302–307 CAS.
- Q. Zhou, W. Chen, L. Xu, R. Kumar, Y. Gui, Z. Zhao, C. Tang and S. Zhu, Ceram. Int., 2018, 44, 4392–4399 CAS.
- K. K. Bhargav, S. Ram and S. B. Majumder, J. Mater. Sci., 2015, 50, 644–651 CAS.
- F. Raza, D. Yim, J. H. Park, H. I. Kim, S. J. Jeon and J. H. Kim, J. Am. Chem. Soc., 2017, 139, 14767–14774 CAS.
- X. Hu, Z. Zhu, Z. Li, L. Xie, Y. Wu and L. Zheng, Sens. Actuators, B, 2018, 264, 139–149 CAS.
- Y. Chen, H. Qin and J. Hu, Appl. Surf. Sci., 2018, 428, 207–217 CAS.
- Q. Wang, C. Wang, H. Sun, P. Sun, Y. Wang, J. Lin and G. Lu, Sens. Actuators, B, 2016, 222, 257–263 CAS.
- D. D. Trung, N. D. Hoa, P. V. Tong, N. V. Duy, T. D. Dao, H. V. Chung, T. Nagao and N. V. Hieu, J. Hazard. Mater., 2014, 265, 124–132 CAS.
- X.-T. Yin and X.-M. Guo, Sens. Actuators, B, 2014, 200, 213–218 CAS.
- Q. Wang, L. Xu, F. Liu, L. Chang and G. Lu, RSC Adv., 2016, 6, 80455–80461 CAS.
- T. Zhang, L. Liu, Q. Qi, S. Li and G. Lu, Sens. Actuators, B, 2009, 139, 287–291 CAS.
- G. Wang, X. Gou, J. Horvat and J. Park, J. Phys. Chem. C, 2008, 112, 15220–15225 CAS.
- J. Hu, T. Wang, Y. Wang, D. Huang, G. He, Y. Han, N. Hu, Y. Su, Z. Zhou, Y. Zhang and Z. Yang, Sens. Actuators, B, 2018, 263, 120–128 CAS.
- M. Takata, D. Tsubone and H. Yanagida, J. Am. Ceram. Soc., 2010, 59, 4–8 Search PubMed.
- L. Xiao, S. Xu, G. Yu and S. Liu, Sens. Actuators, B, 2018, 255, 2002–2010 CAS.
Footnotes |
| † Electronic supplementary information (ESI) available. See DOI: 10.1039/c9ra03171e |
| ‡ These authors contribute equally to this work. |
| This journal is © The Royal Society of Chemistry 2019 |

