
 Open Access Article
 This Open Access Article is licensed under a Creative Commons Attribution-Non Commercial 3.0 Unported Licence
Microstructural analysis, magnetic properties, magnetocaloric effect, and critical behaviors of Ni0.6Cd0.2Cu0.2Fe2O4 ferrites prepared using the sol–gel method under different sintering temperatures
Noura Koukiab,
Sobhi Hcini *c,
Michel Boudardd,
Reema Aldawasa and
Abdessalem Dhahrie
*c,
Michel Boudardd,
Reema Aldawasa and
Abdessalem Dhahrie
aDepartment of Chemistry, College of Science and Arts, Qassim University, Buraydah, Saudi Arabia
bLaboratory of Water, Membranes and Environment Biotechnology (EMBE), Technopole of Borj Cedria (CERTE), 2050 Hammam Lif, Tunisia
cFaculty of Science and Technology of Sidi Bouzid, Research Unit of Valorization and Optimization of Exploitation of Resources, University Campus Agricultural City, University of Kairouan, 9100 Sidi Bouzid, Tunisia. E-mail: hcini_sobhi@yahoo.fr
dLMGP, University of Grenoble Aples, CNRS, 38000 Grenoble, France
eDepartment of Physics, Laboratory of Physical Chemistry of Materials, Faculty of Science of Monastir, University of Monastir, 5019, Monastir, Tunisia
First published on 15th January 2019
Abstract
This work focuses on the microstructural analysis, magnetic properties, magnetocaloric effect, and critical exponents of Ni0.6Cd0.2Cu0.2Fe2O4 ferrites. These samples, denoted as S1000 and S1200, were prepared using the sol–gel method and sintered separately at 1000 °C and 1200 °C, respectively. XRD patterns confirmed the formation of cubic spinel structures and the Rietveld method was used to estimate the different structural parameters. The higher sintering temperature led to an increased lattice constant (a), crystallite size (D), magnetization (M), Curie temperature (TC), and magnetic entropy change (−ΔSM) for samples that exhibited second-order ferromagnetic–paramagnetic (FM–PM) phase transitions. The magnetic entropy changed at an applied magnetic field (μ0H) of 5 T, reaching maximum values of about 1.57–2.12 J kg−1 K−1, corresponding to relative cooling powers (RCPs) of 115 and 125 J kg−1 for S1000 and S1200, respectively. Critical exponents (β, γ, and δ) for samples around their TC values were studied by analyzing the M(μ0H, T) isothermal magnetizations using different techniques and checked by analyzing the −ΔSM vs. μ0H curves. The estimated values of β and γ exponents (using the Kouvel–Fisher method) and δ exponent (from M(TC, μ0H) critical isotherms) were β = 0.443 ± 0.003, γ = 1.032 ± 0.001, and δ = 3.311 ± 0.006 for S1000, and β = 0.403 ± 0.008, γ = 1.073 ± 0.016, and δ = 3.650 ± 0.005 for S1200. Obviously, these critical exponents were affected by an increased sintering temperature and their values were different to those predicted by standard theoretical models.
1. Introduction
Magnetic refrigeration (MR) is an alternative technology to refrigeration based on the conventional vapor cycle technique.1 Owing to its economic and environmental benefits, especially its energy efficiency, magnetic refrigeration is a promising technique for the future of refrigeration. Therefore, the equivalent of a conventional thermodynamic cycle can be realized magnetically with better energy efficiency and without greenhouse gases. Objectives in this area are the synthesis, optimization, and implementation of materials with high magnetocaloric power that are effective, economical, ecological, and practical for medium term implementation in pilot refrigeration systems. MR is based on the magnetocaloric effect (MCE), which is an intrinsic thermodynamic property of magnetic materials that causes a change in the temperature of the substance under the action of a magnetic field. Gadolinium (Gd) is a rare earth metal with a Curie temperature (TC) close to room temperature. Gd is the only pure metallic magnetic material that has a high MCE around its Curie temperature (TC = 293 K).2,3 Although Gd is the first choice for academic MR research near room temperature, its use is commercially limited owing to its high price (∼4000 $ per kg) and easy oxidation. In recent years, large MCEs have been found in other materials, such as perovskite manganites ABO3 (ref. 4–8) and spinel ferrites AFe2O4,9–14 which have attracted increasing attention in MR research. The main advantages of these materials over Gd and GdSiGe alloys15 are low coercive forces, nonactive chemical properties (no oxidation), low costs, and high electric resistance (minimum Eddy current loss).16 Spinel ferrites have been studied less than perovskite materials in the field of MR. Accordingly, in this study, we have prepared ferrite samples with Ni0.6Cd0.2Cu0.2Fe2O4 compositions using the sol–gel method at sintering temperatures of 1000 °C and 1200 °C. We then investigated the effect of sintering temperature on their microstructural, magnetic, and magnetocaloric properties. Finally, a detailed study of critical exponents near their Curie temperatures (TC) was conducted using varies techniques, such as modified Arrott plots, the Kouvel–Fisher method, and critical isotherm analysis. Throughout this manuscript, we have used the abbreviations S1000 and S1200 to denote Ni0.6Cd0.2Cu0.2Fe2O4 ferrites sintered at 1000 °C and 1200 °C, respectively.2. Experimental details
2.1. Synthetic process
Ni0.6Cd0.2Cu0.2Fe2O4 ferrites were synthesized from [Ni(NO3)2·6H2O], [Cd(NO3)2·4H2O], [Cu(NO3)2·3H2O] and [Fe(NO3)3·9H2O] nitrates using the sol–gel method, the main steps of which are shown in Fig. 1. Stoichiometric amounts of nitrates were first dissolved in distilled water with regular stirring at 90 °C on a hot plate. Controlled quantities of citric acid, used as a complexation agent, were added to the mixed solution. The solution pH was adjusted to about 7 by adding ammonia. Stoichiometric amounts of ethylene glycol, used as a polymerization agent, were then added to the solution. Heating and stirring were continued until gel formation after approximately 4 h. The gel was dried at 300 °C for 6 h to obtain a dry foam, which was then ground in a mortar and further dried at 500 °C for 12 h in air. The resulting powder was pressed into pellets (diameter, 10 mm; thickness, about 2 mm) and sintered at 700 °C for 12 h. Finally, the powder was ground and pressed again, and divided into two portions, which were sintered separately for 24 h at 1000 °C and 1200 °C, respectively.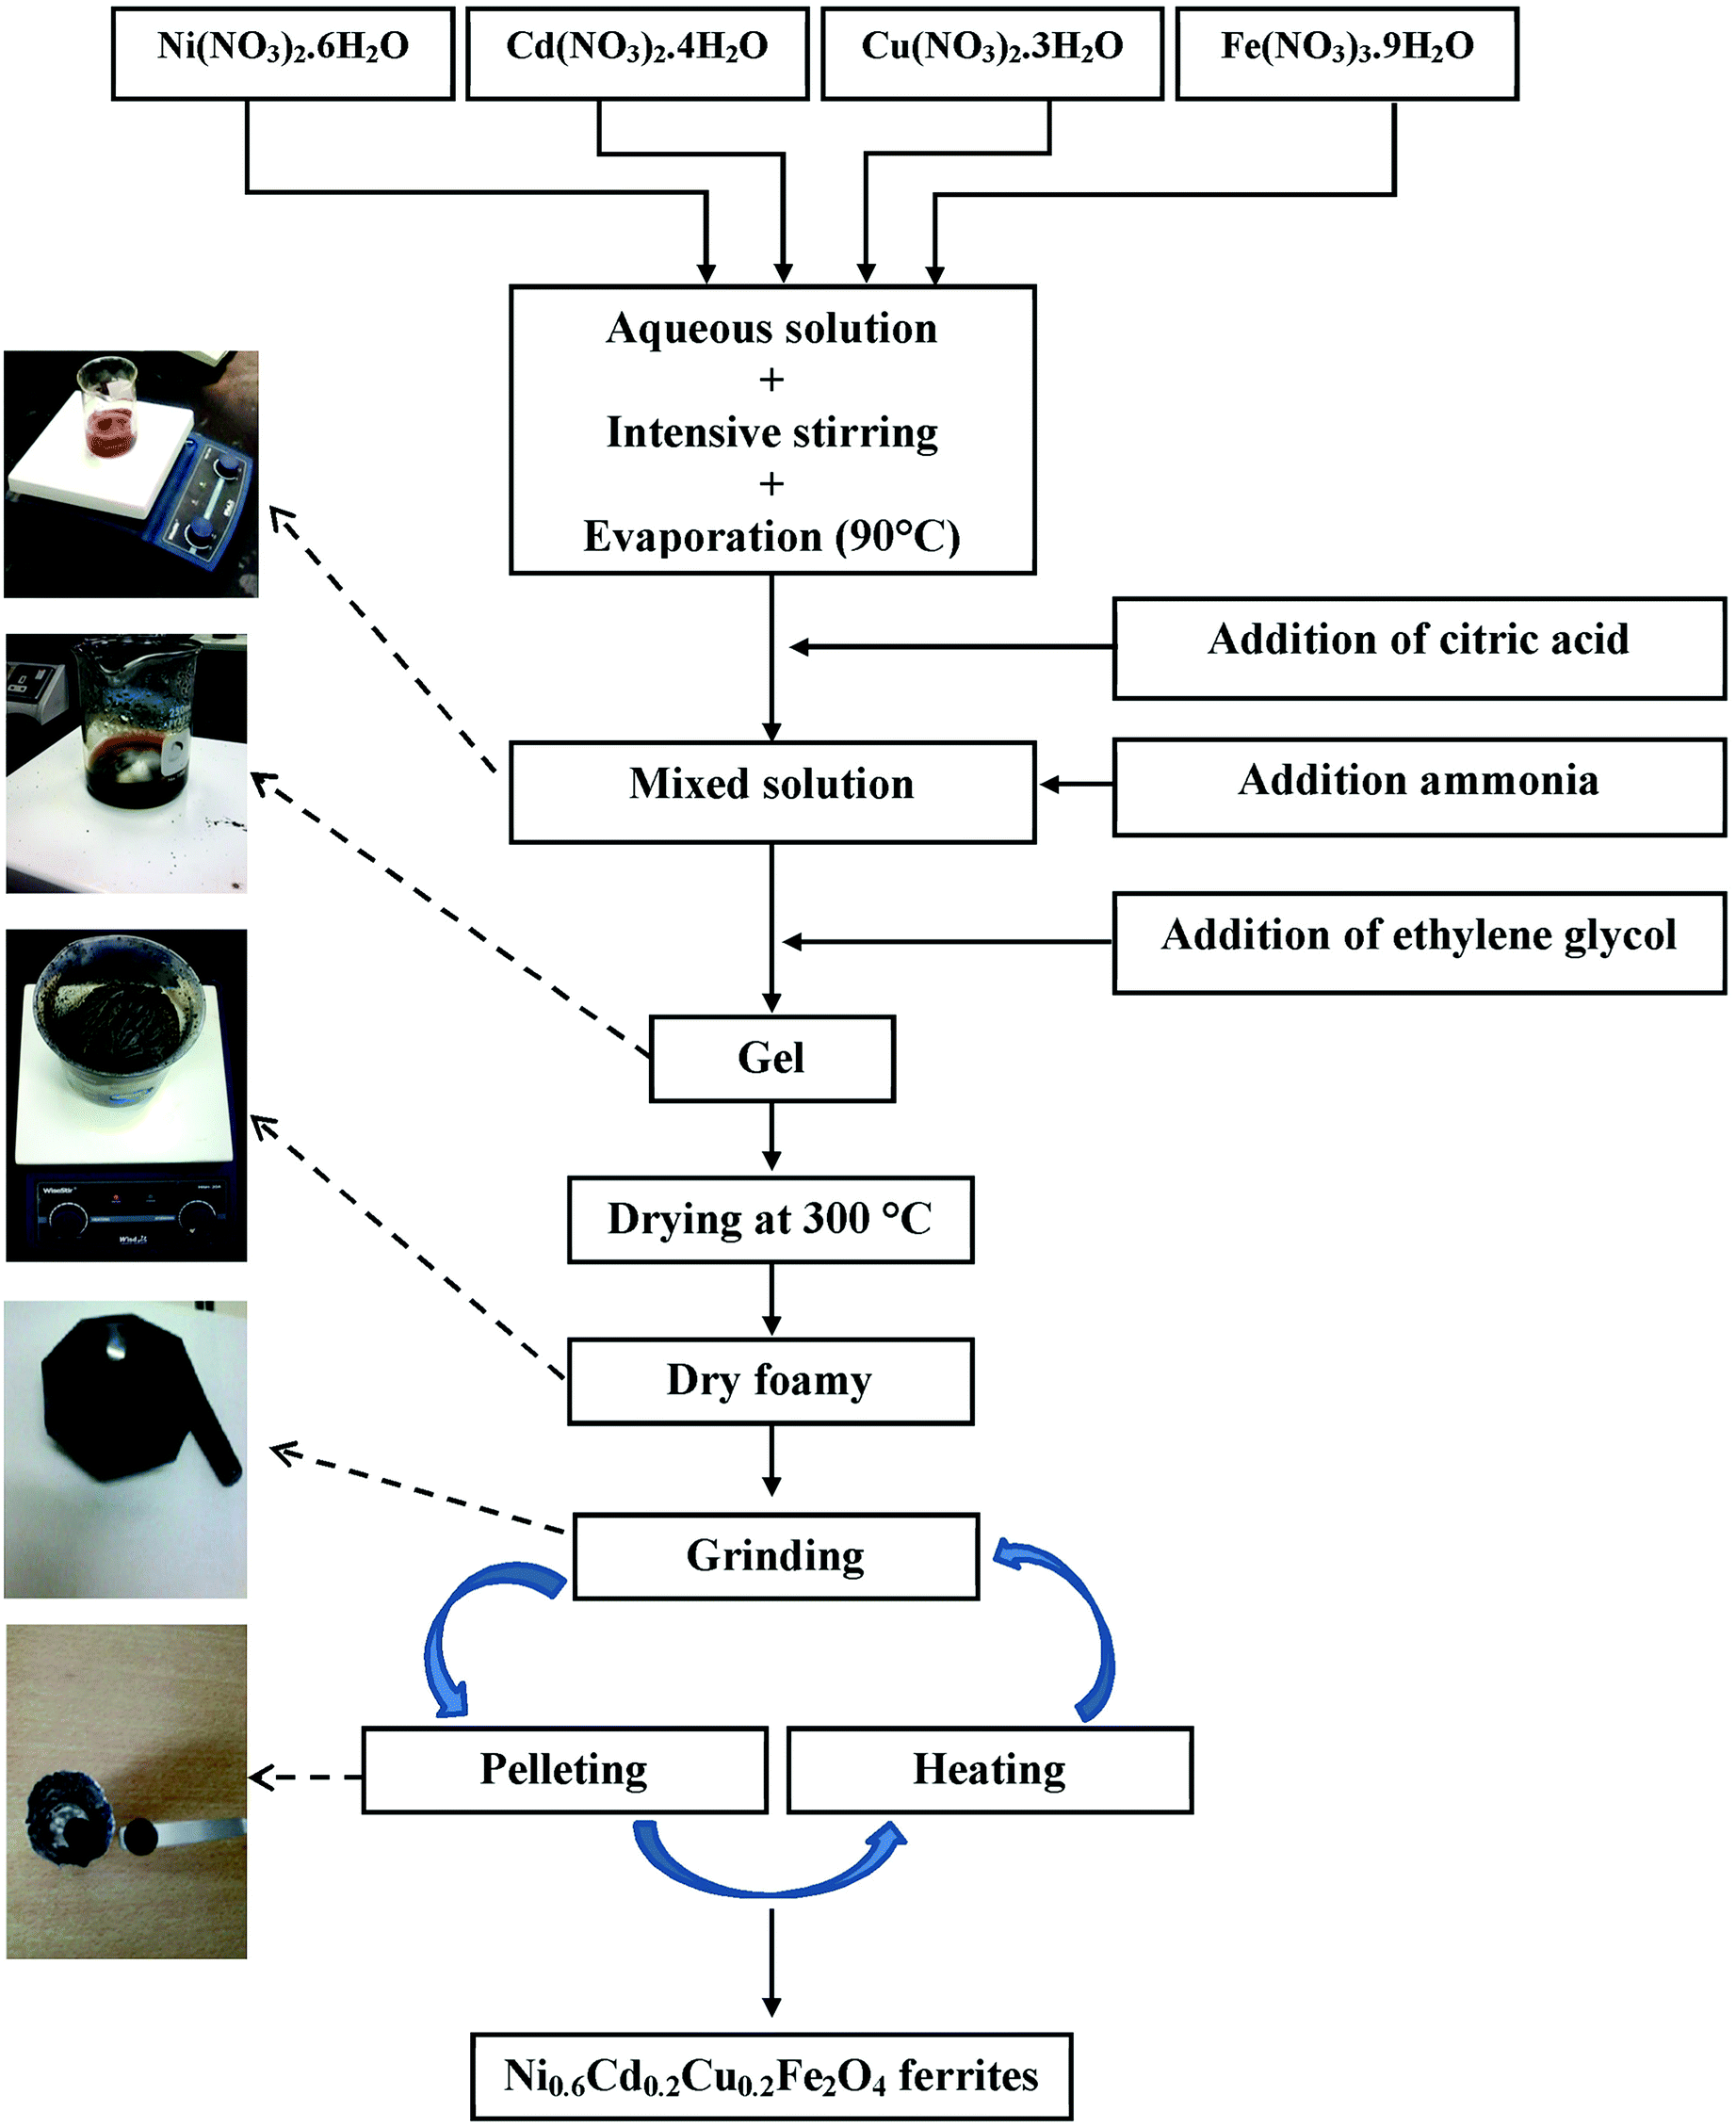 | ||
| Fig. 1 Schematic diagram representing the various synthesis steps for S1000 and S1200 samples using the sol–gel method. | ||
2.2. Characterization
A PANalytical X'Pert Pro diffractometer using Ni-filtered CuKα radiation (λ = 1.5406 Å) was used to record X-ray diffraction patterns in the angular range of 20–80°. Rietveld analysis17 using FullProf software was adopted for detailed structural characterization. The free surface morphologies of samples in pellet form were analyzed by scanning electron microscopy (SEM) using a Philips XL30 microscope under an accelerating voltage of 15 kV. A linear extraction magnetometer was used to record the temperature and magnetic field dependences of the magnetization. M(T) curves were measured in the temperature range 300 K ≤ T ≤ 750 K under a constant magnetic field (μ0H = 0.05 T), and M(μ0H, T) isotherms were taken at different temperatures near TC in the magnetic field range 0 T ≤ μ0H ≤ 5 T.3. Results and discussions
3.1. Microstructural analysis
![[3 with combining macron]](https://www.rsc.org/images/entities/char_0033_0304.gif) m space group. Furthermore, no additional peaks related to phase impurities were detected, confirming the sample purity. As shown in the inset of Fig. 2, the XRD patterns showed a shift in the most intense peak (311) position to lower diffraction angles (2θ) with increasing sintering temperature. This indicated that the lattice constant changed with increasing sintering temperature. The compound structures were refined to Fdm symmetry, accounting for the cation distributions (Cd2+0.2Fe3+0.8)A[Ni2+0.6Cu2+0.2Fe3+1.2]BO2−4. The distributions of Cd2+, Ni2+, Cu2+, and Fe3+ ions were proposed based on literature precedent.18–21 The atomic positions were fixed at 8a (1/8, 1/8, 1/8) for (Cd2+0.2Fe3+0.8)A cations, 16d (1/2, 1/2, 1/2) for [Ni2+0.6Cu2+0.2Fe3+1.2]B cations, and 32e (x, y, z) for O. Refinements of all parameters were continued until the value of the quality factor, χ2 (goodness of fit), was close to unity, which confirmed the goodness of the refinement (Fig. 3). The lattice constant (a), volume (V), cation–oxygen distances in A and B sites (RA and RB), average crystallite size (D), and intensity ratio (I220/I222) were obtained from Rietveld refinement, as summarized in Table 1. The results clearly indicated that the lattice parameters increased, while the RA and RB distances decreased, with increasing sintering temperature. This was in agreement with the results of previous studies.22,23 Furthermore, the obtained oxygen coordinate values were characteristic of a spinel-type structure.24,25 The average crystallite sizes of the samples were obtained from XRD peaks using the Scherrer equation:22
m space group. Furthermore, no additional peaks related to phase impurities were detected, confirming the sample purity. As shown in the inset of Fig. 2, the XRD patterns showed a shift in the most intense peak (311) position to lower diffraction angles (2θ) with increasing sintering temperature. This indicated that the lattice constant changed with increasing sintering temperature. The compound structures were refined to Fdm symmetry, accounting for the cation distributions (Cd2+0.2Fe3+0.8)A[Ni2+0.6Cu2+0.2Fe3+1.2]BO2−4. The distributions of Cd2+, Ni2+, Cu2+, and Fe3+ ions were proposed based on literature precedent.18–21 The atomic positions were fixed at 8a (1/8, 1/8, 1/8) for (Cd2+0.2Fe3+0.8)A cations, 16d (1/2, 1/2, 1/2) for [Ni2+0.6Cu2+0.2Fe3+1.2]B cations, and 32e (x, y, z) for O. Refinements of all parameters were continued until the value of the quality factor, χ2 (goodness of fit), was close to unity, which confirmed the goodness of the refinement (Fig. 3). The lattice constant (a), volume (V), cation–oxygen distances in A and B sites (RA and RB), average crystallite size (D), and intensity ratio (I220/I222) were obtained from Rietveld refinement, as summarized in Table 1. The results clearly indicated that the lattice parameters increased, while the RA and RB distances decreased, with increasing sintering temperature. This was in agreement with the results of previous studies.22,23 Furthermore, the obtained oxygen coordinate values were characteristic of a spinel-type structure.24,25 The average crystallite sizes of the samples were obtained from XRD peaks using the Scherrer equation:22
 | (1) |
 | (2) |
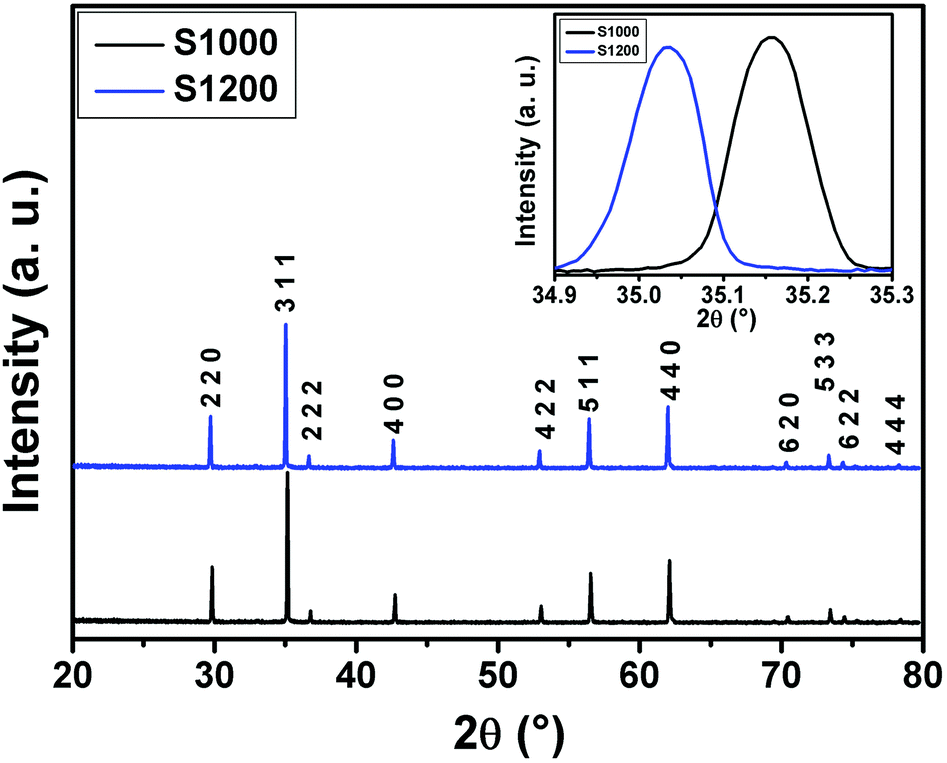 | ||
| Fig. 2 XRD patterns of S1000 and S1200 samples. All peaks of the manganite phase are indexed to cubic spinel Fdm symmetry. Inset shows the observed XRD profiles of the most intense peak (Bragg reflections 311). | ||
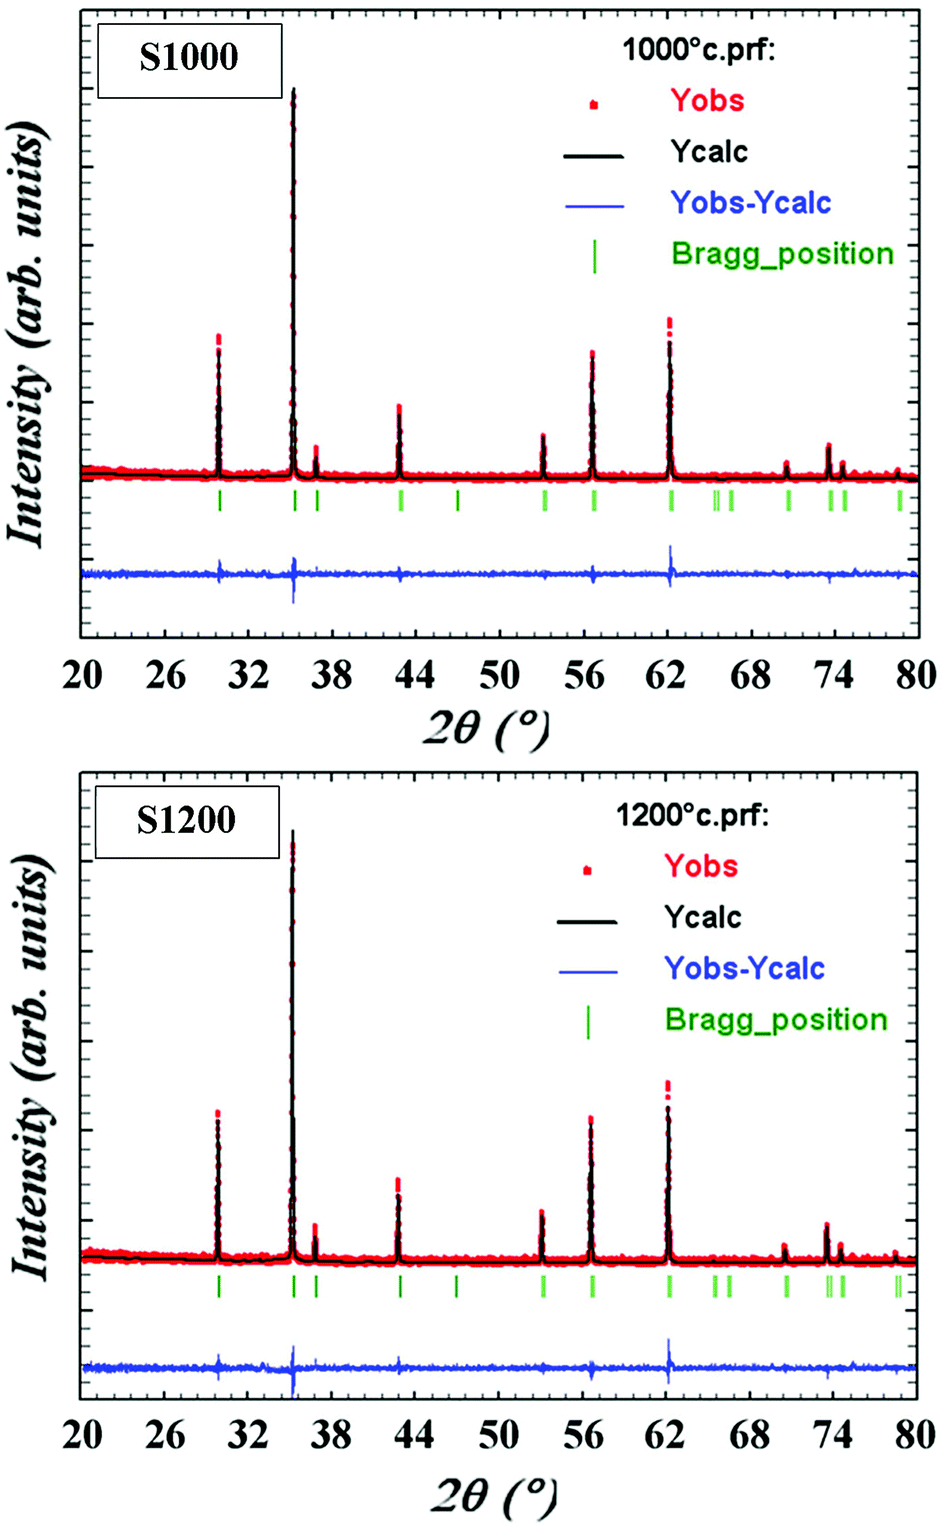 | ||
| Fig. 3 Rietveld analysis of XRD patterns for S1000 and S1200. Bottom line (blue) represents the difference between the XRD data (red) and calculated fit (black); green lines are Bragg positions. All peaks are indexed to the cubic spinel-type structure (Fdm space group). | ||
| Samples | S1000 | S1200 | |||
|---|---|---|---|---|---|
| a Numbers in parentheses are estimated standard deviations to the last significant digit. Biso, the isotropic Debye–Waller factor. Structural parameters a, V, RA, RB, D, and I220/I222 are defined in the text. Agreement factors of profile Rp, weighted profile Rwp, and structure RF. χ2, goodness of fit. | |||||
| Space group | Fdm |
||||
| Lattice parameters | a (Å) | 8.4382 (3) | 8.4421 (2) | ||
| V (Å3) | 600.83 (3) | 601.67 (2) | |||
| Atoms | Cd/Fe1 | Wyckoff positions | 4c | 4c | |
| Site symmetry | −43m | −43m | |||
| Atomic positions | x = y = z | 1/8 | 1/8 | ||
| Biso (Å2) | 0.64 (1) | 1.10 (1) | |||
| Ni/Cu/Fe2 | Wyckoff positions | 16d | 16d | ||
| Site symmetry | −3m | −3m | |||
| Atomic positions | x = y = z | 1/2 | 1/2 | ||
| Biso (Å2) | 1.11 (1) | 1.29 (1) | |||
| O | Wyckoff positions | 32e | 32e | ||
| Site symmetry | 3m | 3m | |||
| Atomic positions | x = y = z | 0.2601 (9) | 0.2541 (9) | ||
| Biso (Å2) | 2.18 (9) | 1.41 (2) | |||
| Structural parameters | RA (Å) | 1.963(8) | 1.946(11) | ||
| RB (Å) | 2.038(8) | 2.030(8) | |||
| I220/I222 | 3.91 | 4.42 | |||
| D (μm) | 0.122 | 0.138 | |||
| Agreement factors | Rp (%) | 20.1 | 21.8 | ||
| Rwp (%) | 29.9 | 31.4 | |||
| RF (%) | 10.4 | 13.2 | |||
| χ2 (%) | 1.24 | 1.47 | |||
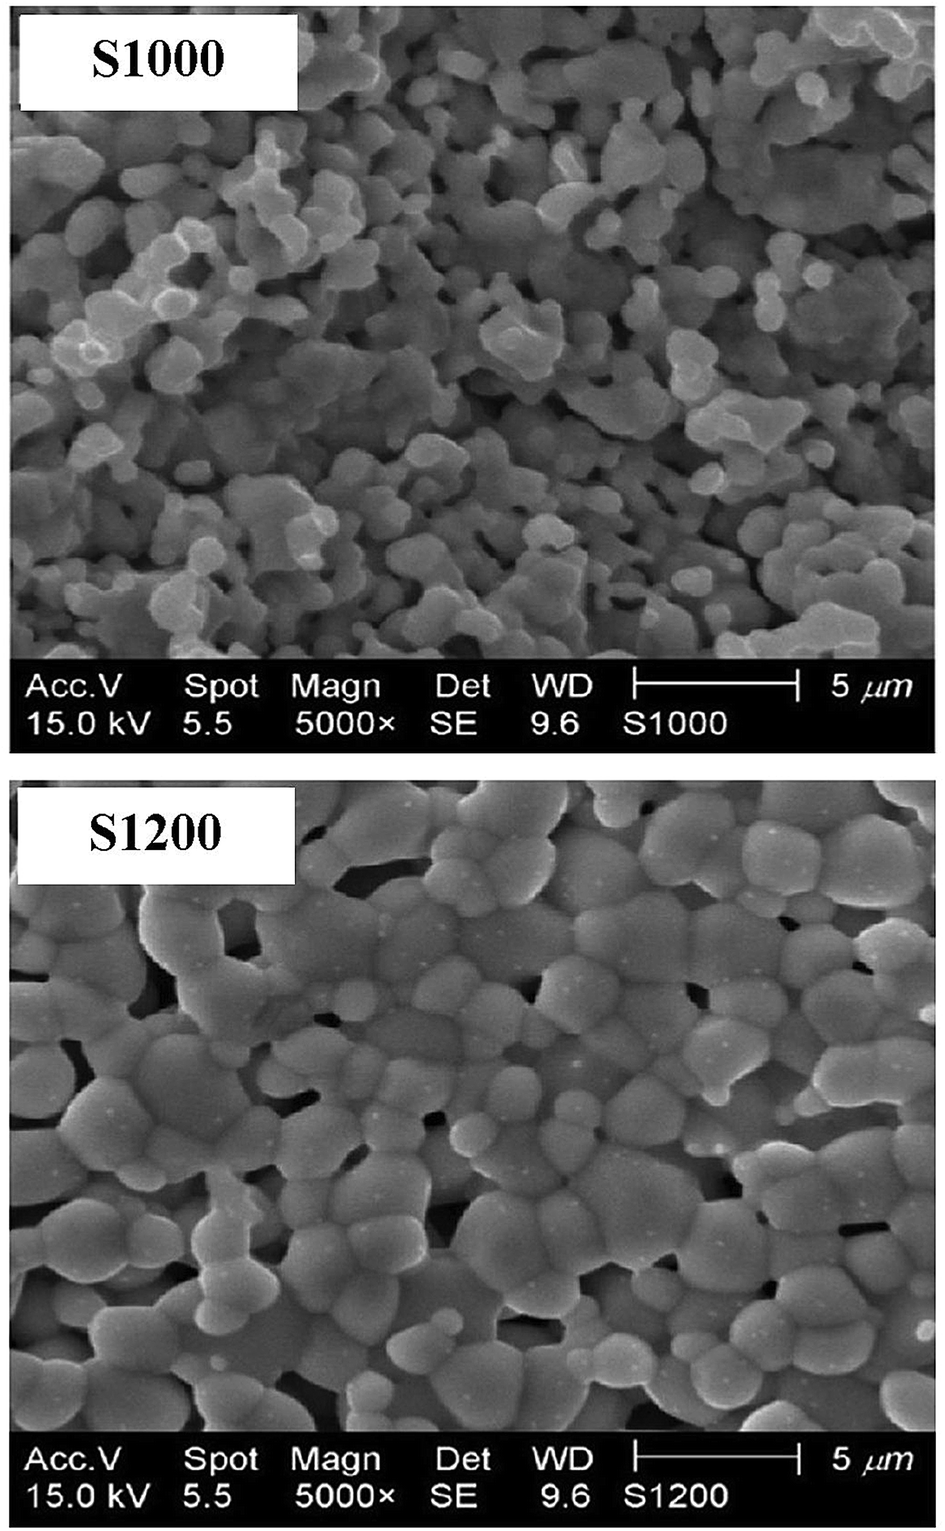 | ||
| Fig. 4 SEM micrographs of S1000 and S1200. | ||
3.2. Magnetic properties
Variations in the magnetization (M) with temperature (T) under a magnetic field of 0.05 T for S1000 and S1200 samples are shown in Fig. 5. Clear ferromagnetic–paramagnetic (FM–PM) phase transitions were observed for both samples at their Curie temperatures (TC). TC values were determined, accounting for the minimum values of (dM/dT vs. T) curves, which are given in the insets of Fig. 5. The TC values increased from 655 K to 680 K for S1000 and S1200, respectively. Furthermore, at the higher sintering temperature, the magnetization amplitude in the FM region also increased. The increments in both M and TC values with increasing sintering temperature can be related to the increase in crystallite size. Furthermore, according to the core/surface morphology, the spin arrangement on the surface is lower than that in the core. The surface is considered a magnetically dead layer, with the randomly disordered. Therefore, as the crystallite size increases with increasing sintering temperature, this nonmagnetic surface layer decreases and, consequently, the core/shell thickness ratio increases. This leads to the elimination of surface effects (broken exchange bonds, spin canting) and, therefore, an improvement in both M and TC values was observed.23 This result can also be interpreted in another way by considering variation in the degree of inversion parameter.27,28 According to the XRD results, the degree of inversion was reduced with increasing sintering temperature. The decreased degree of inversion would cause the average exchange interaction between Fe3+ ions in tetrahedral and octahedral sites to increase, which resulted in an increase in the M and TC values.28 This explained why the as-prepared S1000 sample with a higher inversion degree had lower M and TC values, while the S1200 sample with a low inversion degree had higher M and TC values.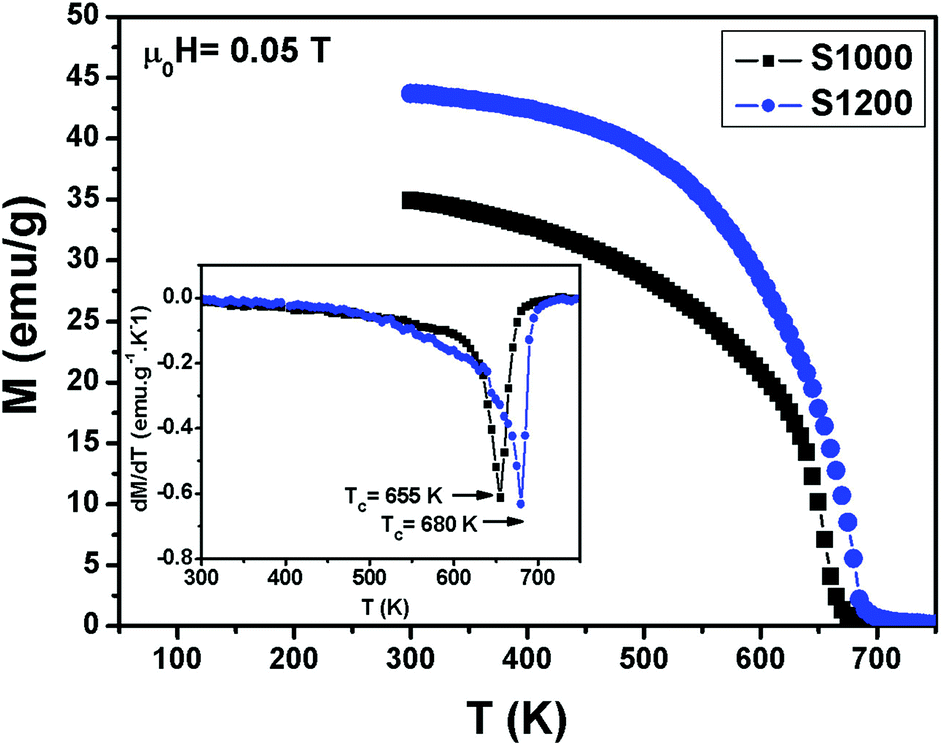 | ||
| Fig. 5 Temperature dependence of magnetization measured at μ0H = 0.05 T for S1000 and S1200. Insets are plots of dM/dT vs. T. | ||
3.3. Magnetocaloric properties
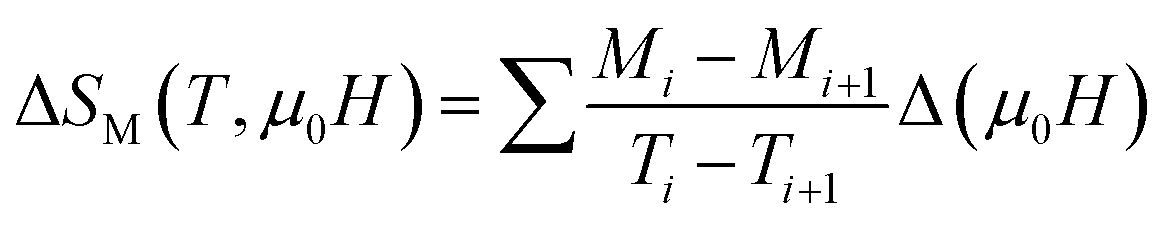
Fig. 6 shows the M(μ0H, T) isothermal magnetizations taken near the TC values of S1000 and S1200. The nature of the magnetic phase transitions of these samples was determined using Banerjee's criterion29 and M2 vs. μ0H/M Arrott plots.30 Fig. 7 shows the Arrott plots of both samples. Analysis of these plots showed that they have positive slopes around the TC, which confirmed that the magnetic phase transitions were second-order. Using M (μ0H, T) isotherms, the dependence of magnetic entropy change (−ΔSM) on temperature (T) was calculated according to the following Maxwell relation:1
 | (3) |
| RCP = |ΔSmaxM| × δTFWHM | (4) |
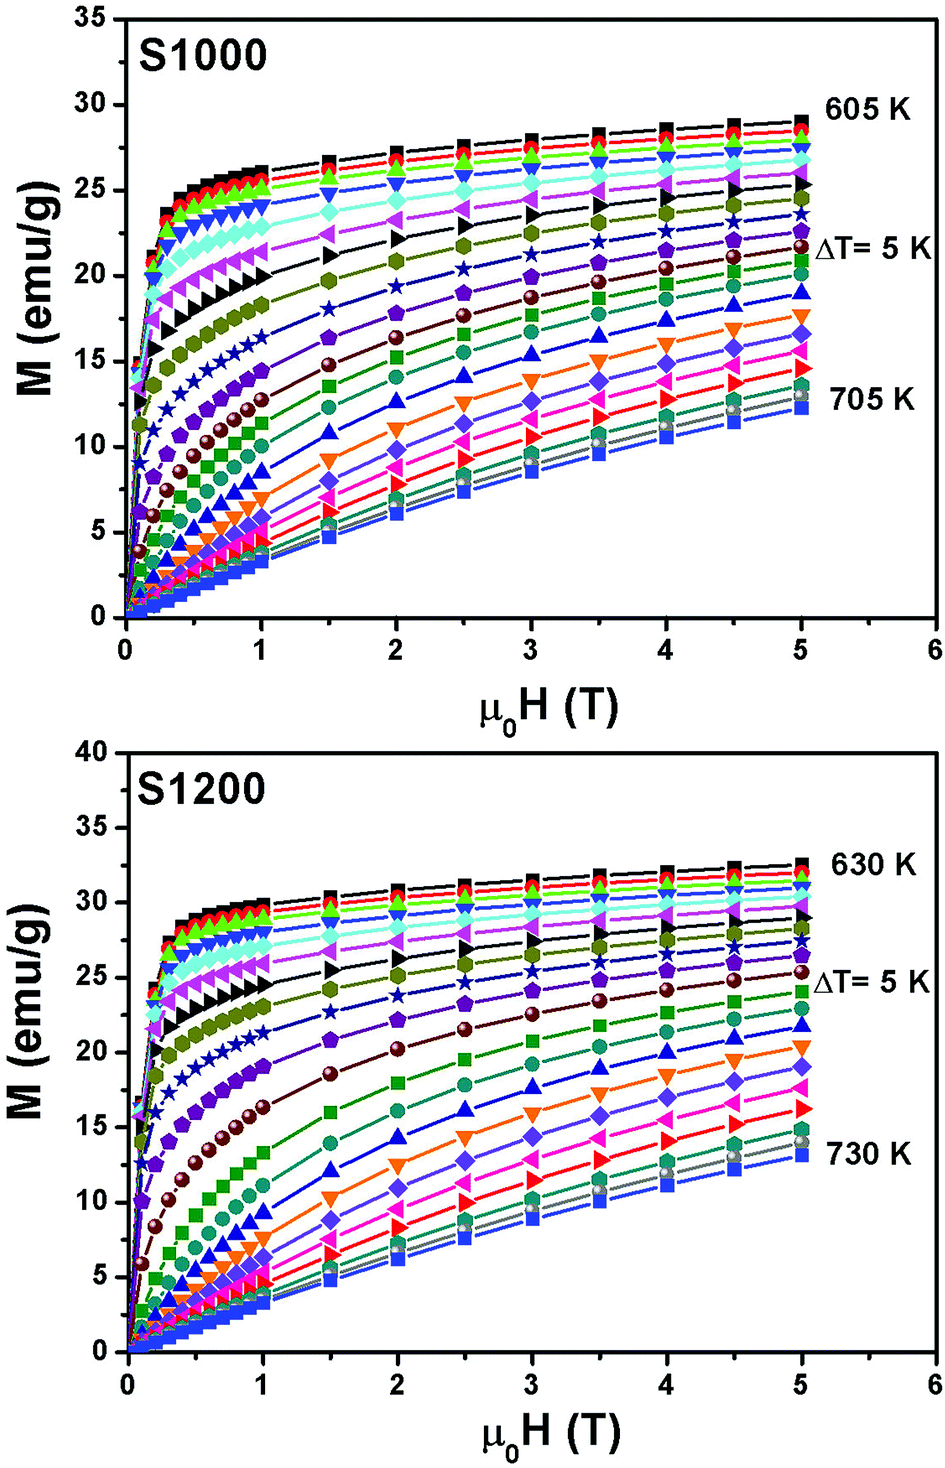 | ||
| Fig. 6 Applied magnetic field dependence of magnetization at different temperatures M(μ0H, T) around the TC values of S1000 and S1200. | ||
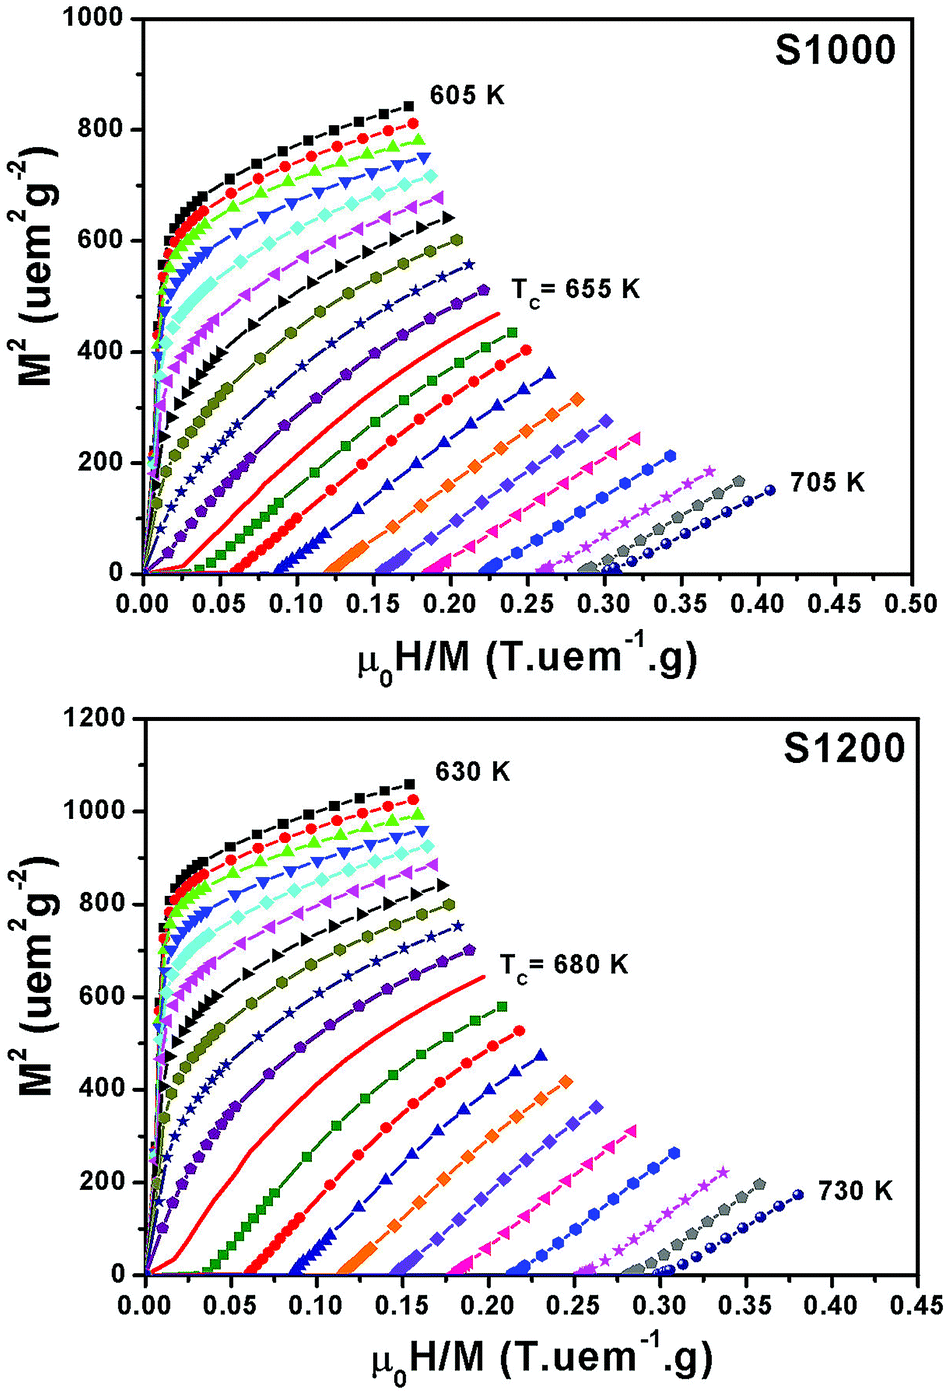 | ||
| Fig. 7 Arrott plots (M2 vs. μ0H/M) near the TC values of S1000 and S1200. | ||
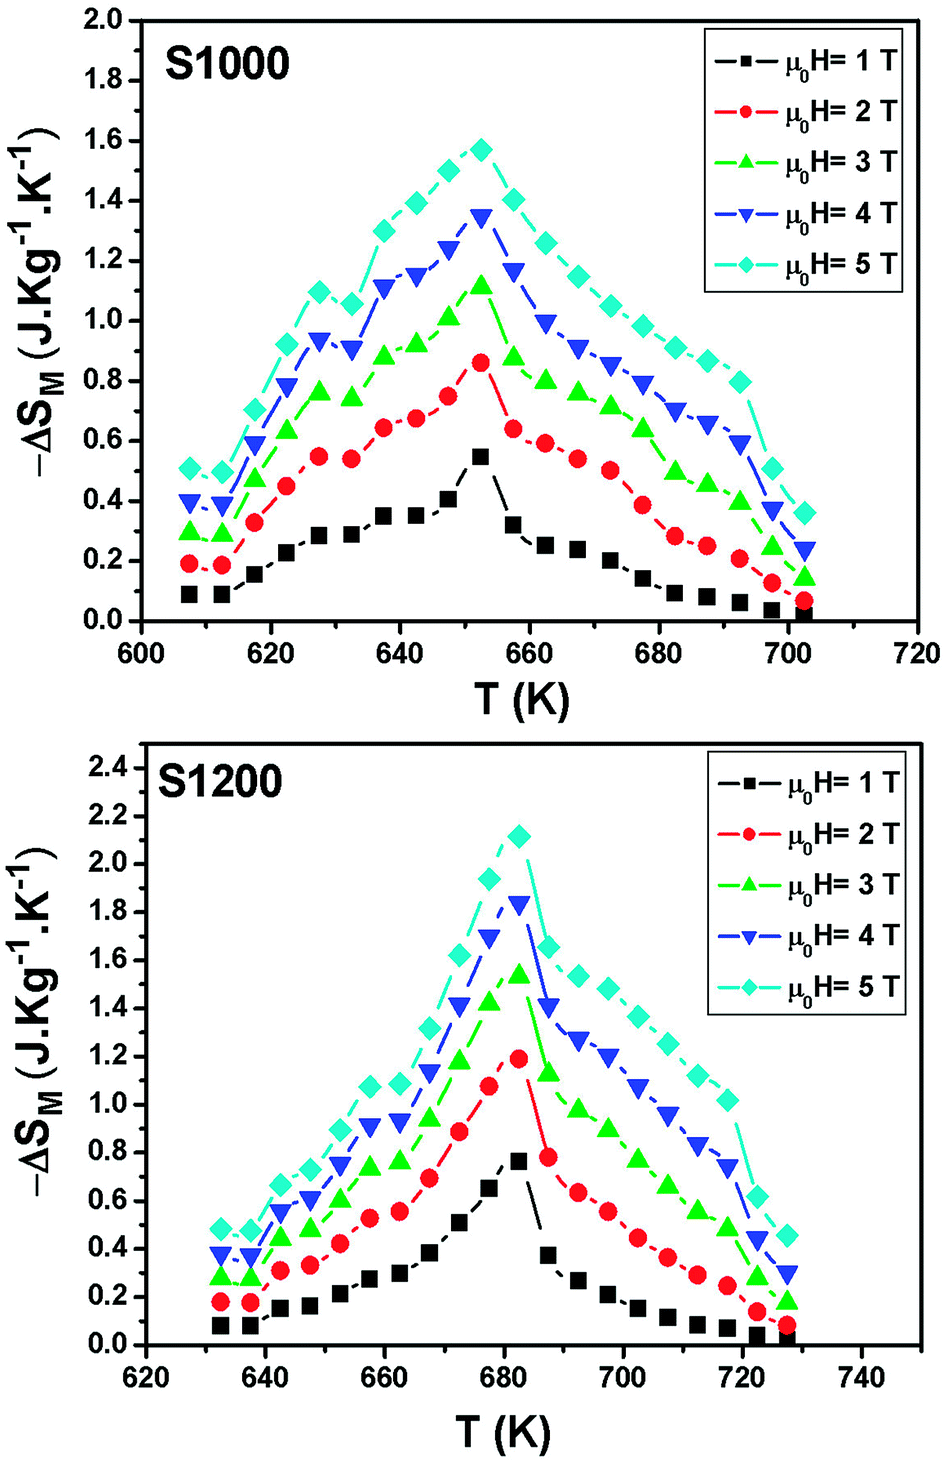 | ||
| Fig. 8 Temperature and magnetic field dependences of the magnetic entropy change for S1000 and S1200. | ||
| Samples | TC (K) | μ0H (T) | |ΔSmaxM| (J kg−1 K−1) | RCP (J kg−1) | Ref. |
|---|---|---|---|---|---|
| Ni0.6Cd0.2Cu0.2Fe2O4 (1000 °C) | 655 | 5 | 1.57 | 115 | Present work |
| Ni0.6Cd0.2Cu0.2Fe2O4 (1200 °C) | 680 | 5 | 2.12 | 125 | Present work |
| Zn0.6Cu0.4Fe2O4 | 305 | 5 | 1.16 | 289 | 9 |
| Zn0.4Ni0.2Cu0.4Fe2O4 | 565 | 5 | 1.41 | 141 | 9 |
| Zn0.2Ni0.4Cu0.4Fe2O4 | 705 | 5 | 1.61 | 233 | 9 |
| Cu0.4Zn0.6Fe2O4 | 373 | 5 | 1.77 | — | 11 |
| Cu0.2Zn0.8Fe2O4 | 140 | 5 | 1.17 | — | 11 |
| Ni0.4Mg0.3Cu0.3Fe2O4 | 690 | 5 | 1.56 | 136 | 14 |
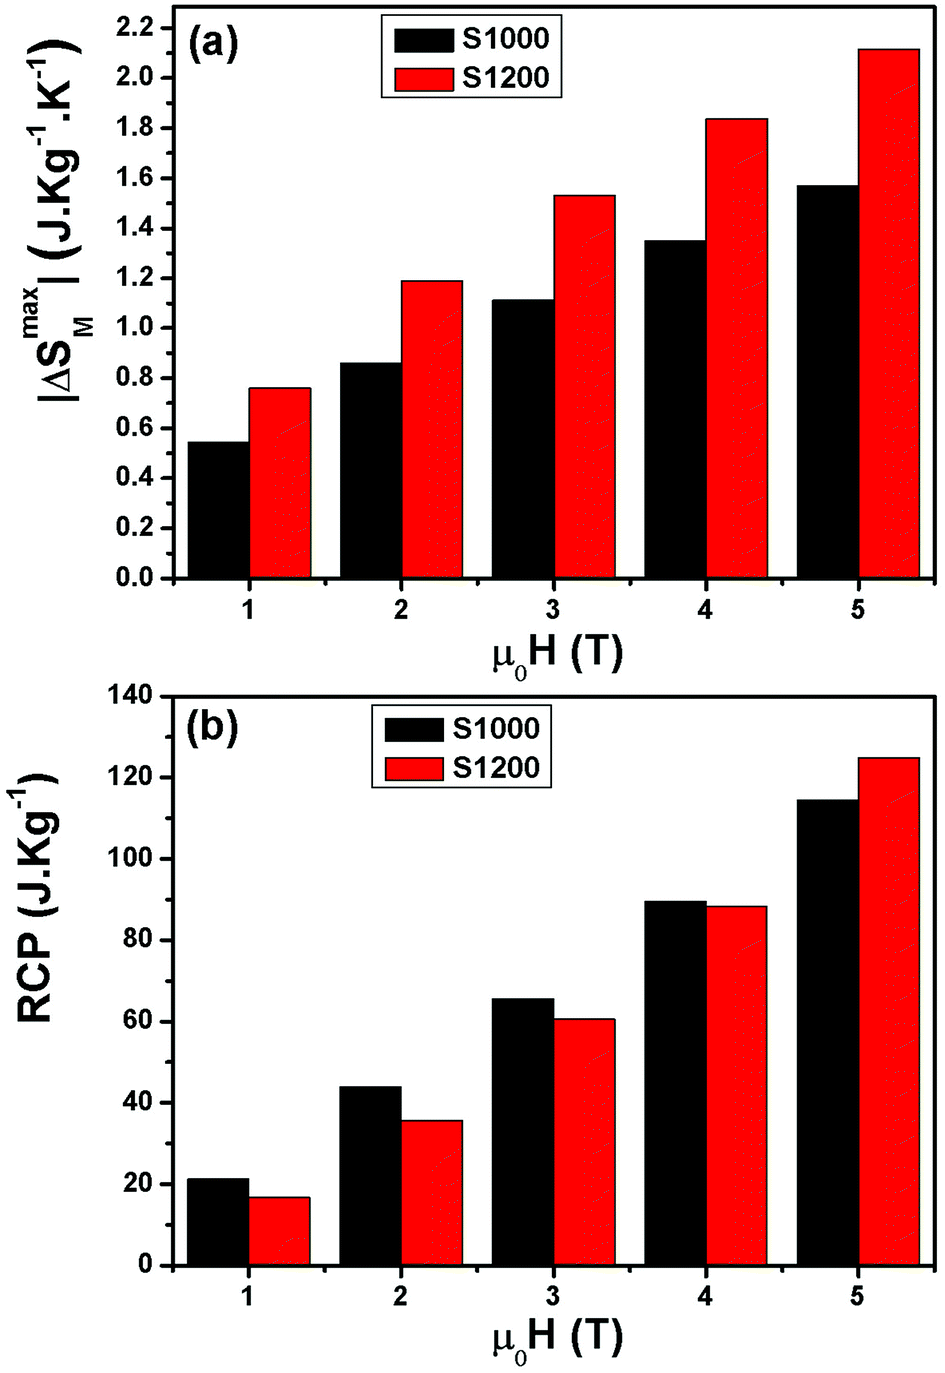 | ||
| Fig. 9 (a) Magnetic field dependence of maximum magnetic entropy change −ΔSmaxM and (b) relative cooling power values (RCP) of S1000 and S1200. | ||
3.4. Critical behavior
| Ms(T) = M0(−ε)β (with ε < 0 and T < TC) | (5) |
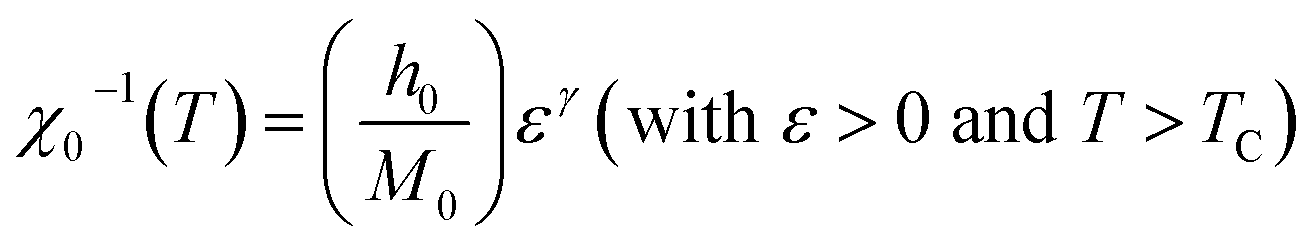 | (6) |
| M = D(μ0H)1/δ (with ε = 0 and T = TC) | (7) |
 | (8) |
 | (9) |
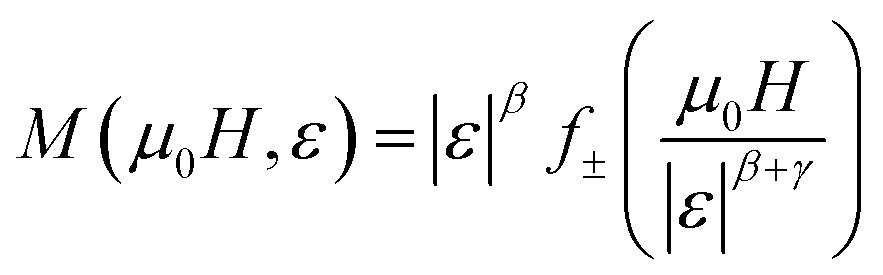
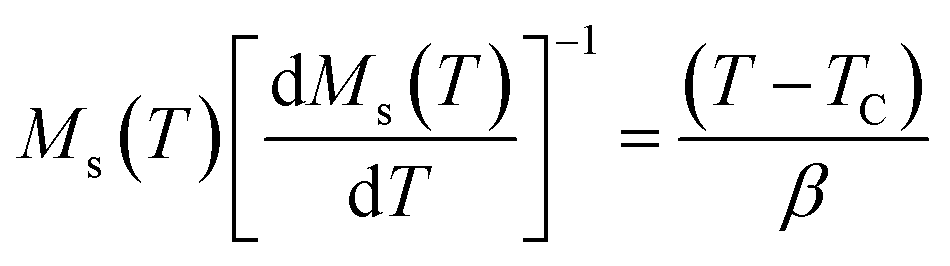
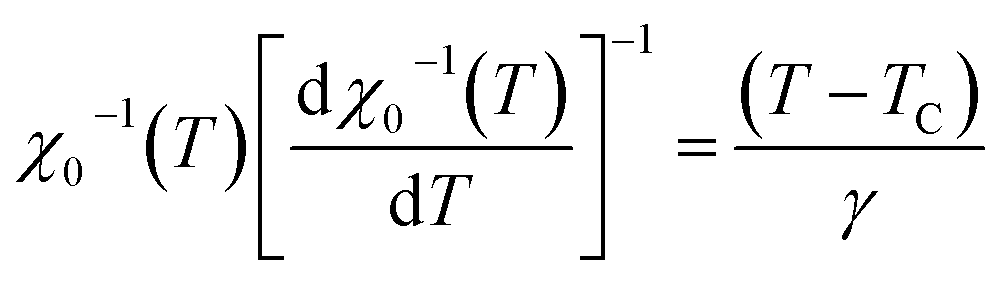
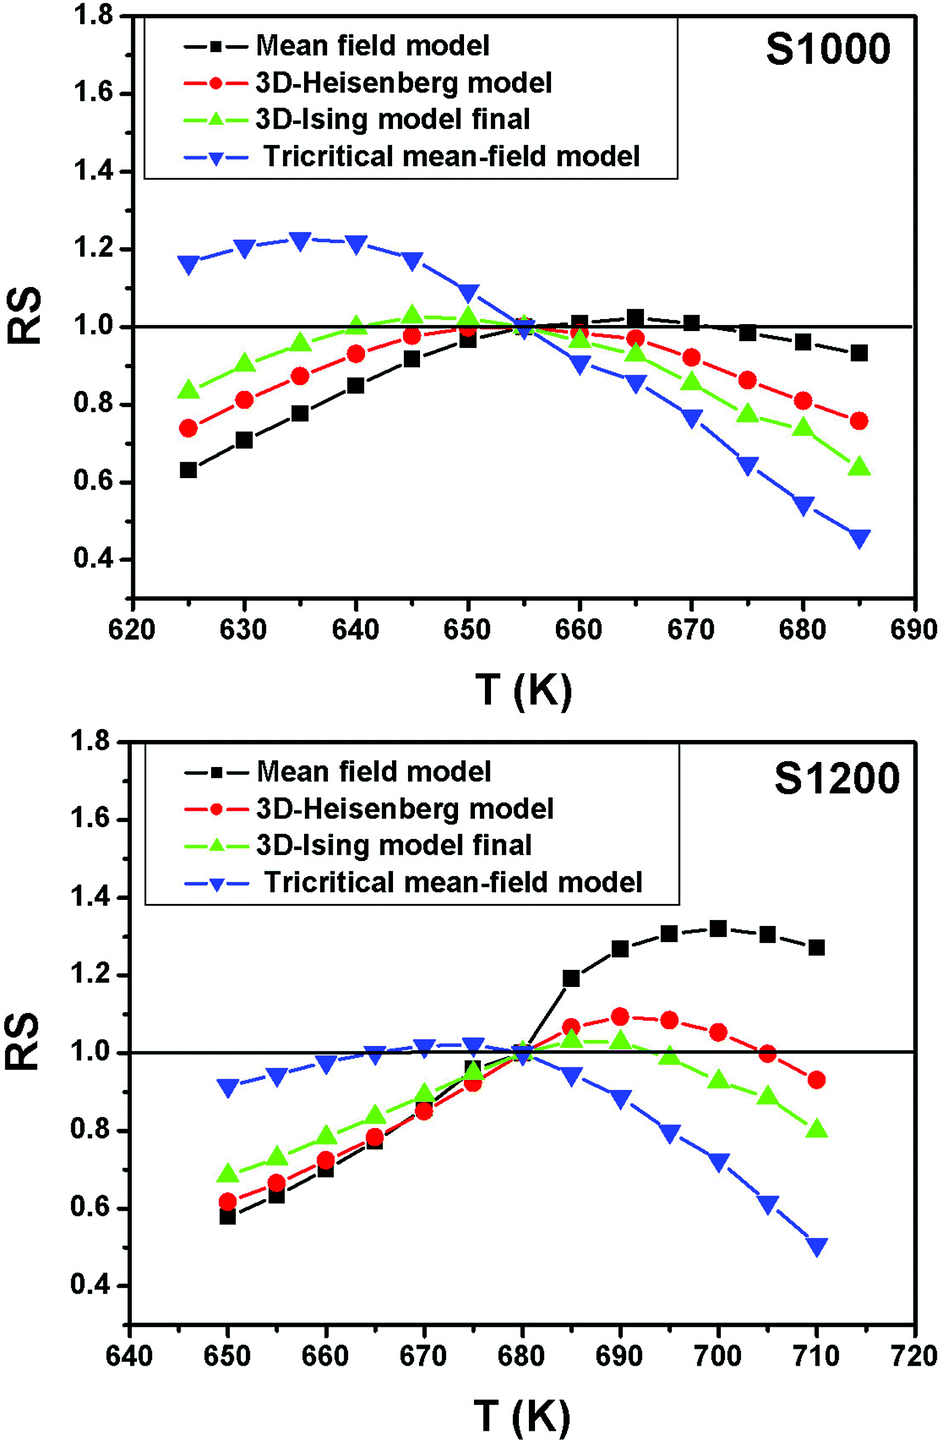
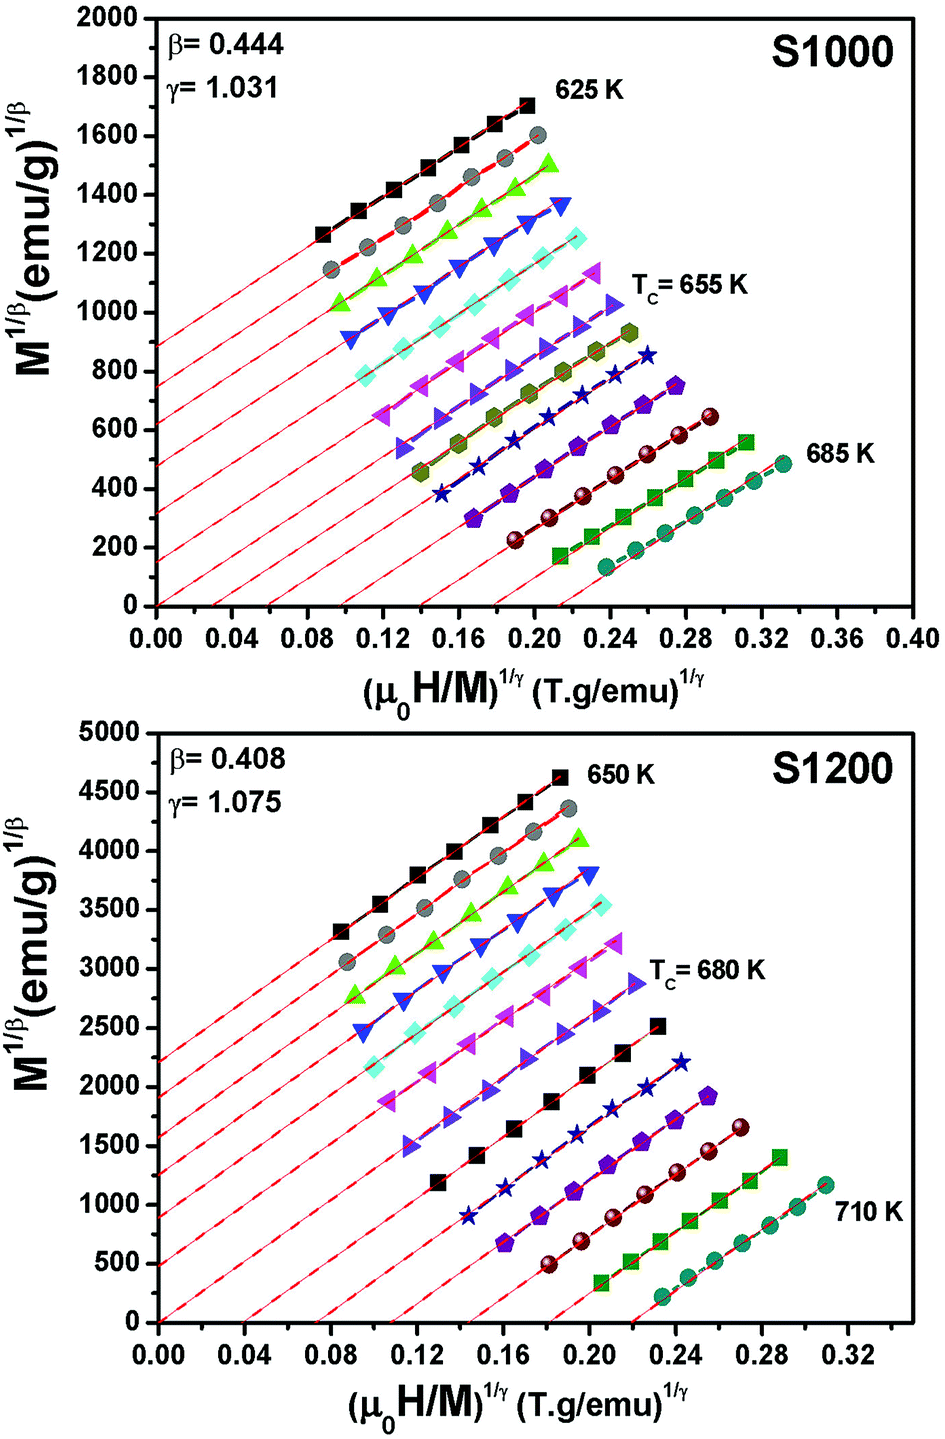
For the best theoretical model, the RS values should be close to unity, mainly because the MAPs are series of parallel isotherms.37 Fig. 10 shows the values of RS vs. T corresponding to each model. For both samples, the RS values were clearly higher than unity. This suggested that the theoretical models were not useful for estimating the critical exponents of the prepared samples. Therefore, we concluded that the samples had unconventional critical exponents. This motivated us to construct new MAPs. We attempted to find new critical exponent values until we obtained parallel isotherms at around TC, and the isotherm of M1/β vs. (μ0H/M)1/γ at TC crossed the origin. These conditions were reached with values of β = 0.444 and γ = 1.031 for S1000, and β = 0.408 and γ = 1.075 for S1200 (Fig. 11). Linear extrapolation of the experimental data in Fig. 11 allowed determination of the spontaneous magnetization, Ms (below TC), by intersection with the M1/β axis and the initial magnetic susceptibility values, χ0−1 (above TC), by intersection with the (μ0H/M)1/γ axis. The Ms(T) and χ0(T) data were then adjusted using the eqn (5) and (6), respectively. During this adjustment, new values of β and γ were obtained simultaneously. The TC value associated with each curve was also determined. After several adjustment tests, the values of β, γ, and TC converged toward their optimal values. As shown in Fig. 12, the theoretical and experimental curves were in good agreement. The obtained values shown in Fig. 12 also agreed well with those presented in Fig. 11. The β, γ, and TC values were also determined more precisely using the Kouvel–Fisher method using the following two equations:38,39
 | (10) |
 | (11) |
 | ||
| Fig. 10 Relative slope (RS) vs. temperature deduced from the four theoretical models for S1000 and S1200. | ||
 | ||
| Fig. 11 Modified Arrott plots (M1/β vs. (μ0H/M)1/γ) with reliable critical exponents obtained for S1000 and S1200. | ||
 | ||
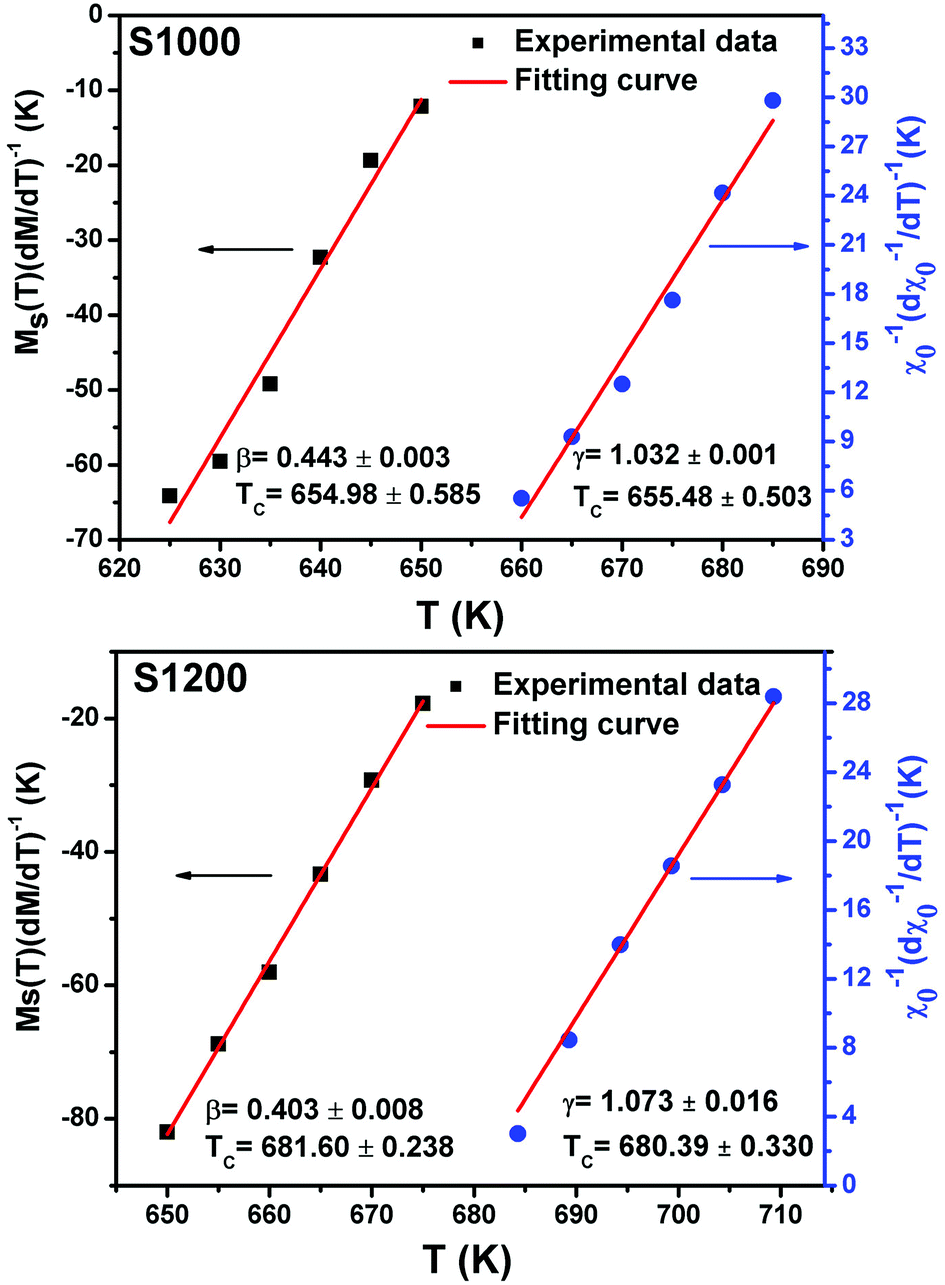
| Fig. 12 Spontaneous magnetization Ms(T) (left axis) and inverse initial susceptibility χ0−1(T) (right axis) of S1000 and S1200. Red solid lines are the fits according to eqn (5) and (6), respectively. | ||
Linear adjustment of 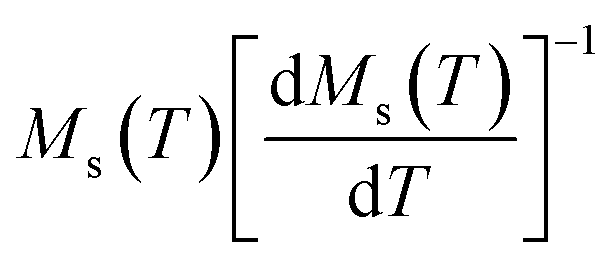 vs. T gave a slope equal to 1/β, while the linear adjustment of
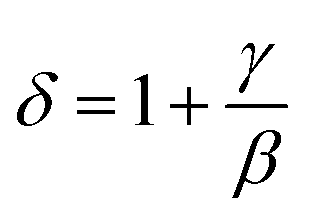
 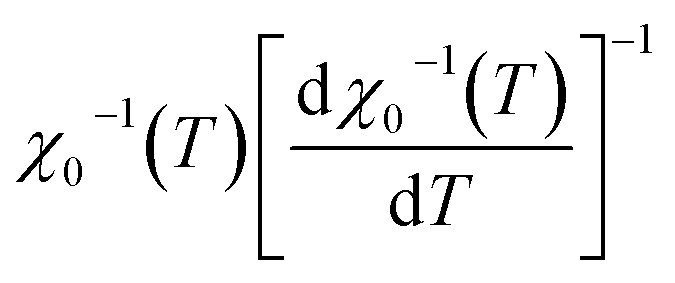 vs. T gave a slope equal to 1/γ. These curves are shown in Fig. 13. The red lines represent the best adjustments using eqn (10) and (11). The obtained values of β, γ, and TC parameters shown in Fig. 13 were consistent with those used in Fig. 11. The variation in the critical isotherm M(TC, μ0H) can be described by a power law characterized by the critical exponent δ. This exponent can be obtained by adjusting M(TC, μ0H) curve in log–log scale using eqn (7), as shown in Fig. 14. From this adjustment, it was possible to determine the slope of the curve (1/δ) and consequently the values of δ (see Fig. 14). The three critical exponents, β, γ, and δ, determined previously can be related, according to statistical theory, to the Widom relation:40
 | (12) |
 | ||
| Fig. 13 Kouvel–Fisher plots for spontaneous magnetization Ms(T) (left axis) and inverse initial susceptibility χ0−1(T) (right axis) of S1000 and S1200. Red solid lines are the fits according to eqn (10) and (11), respectively. | ||
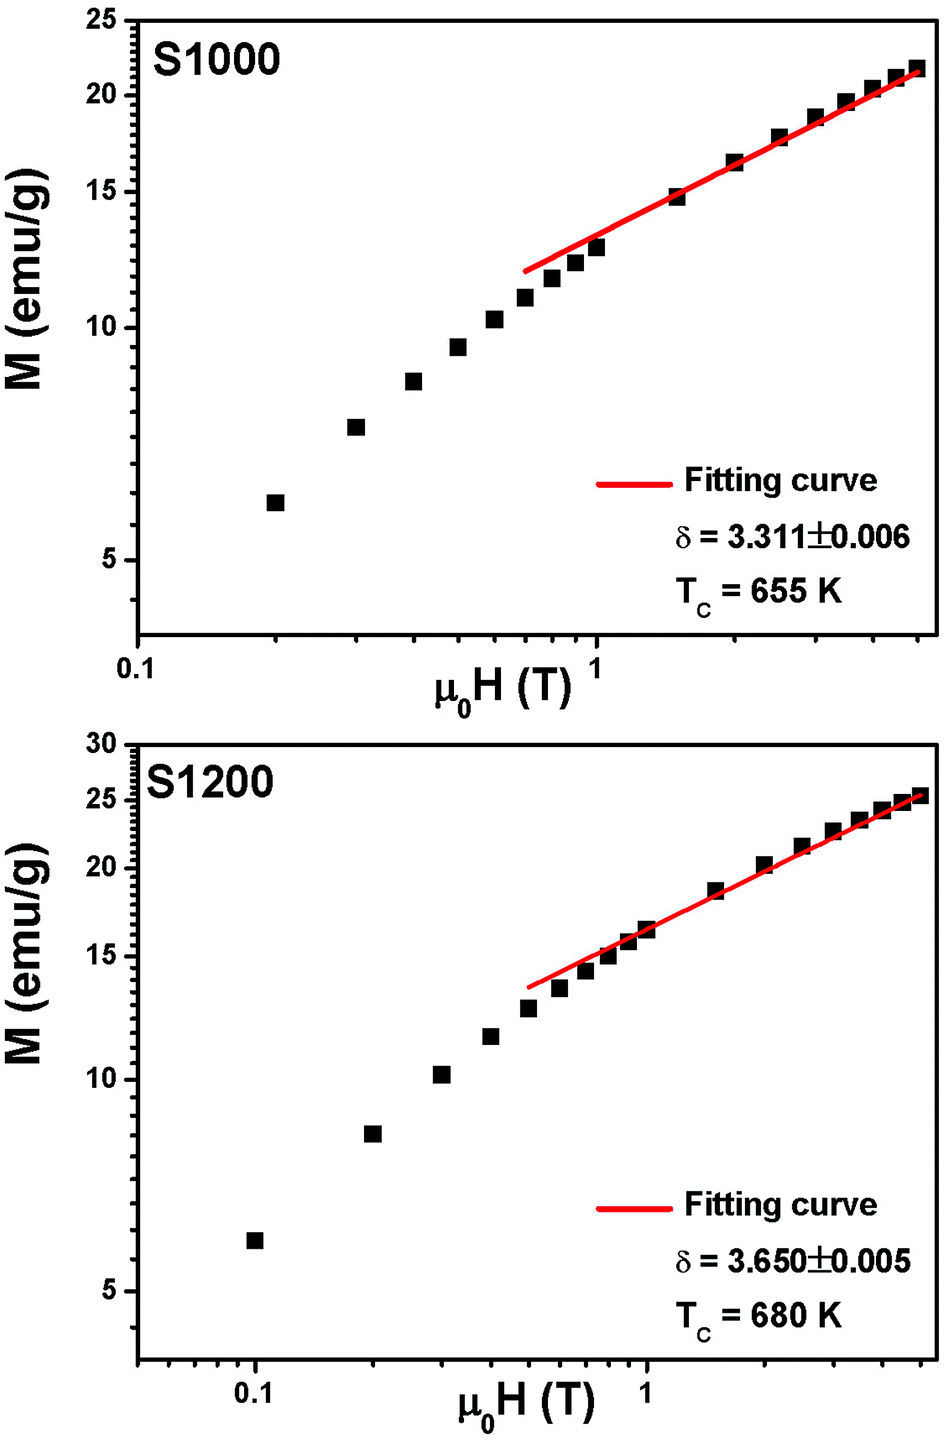 | ||
| Fig. 14 M(TC, μ0H) isotherms in the log–log scale for S1000 and S1200. Red solid lines are the linear fit according to eqn (7). | ||
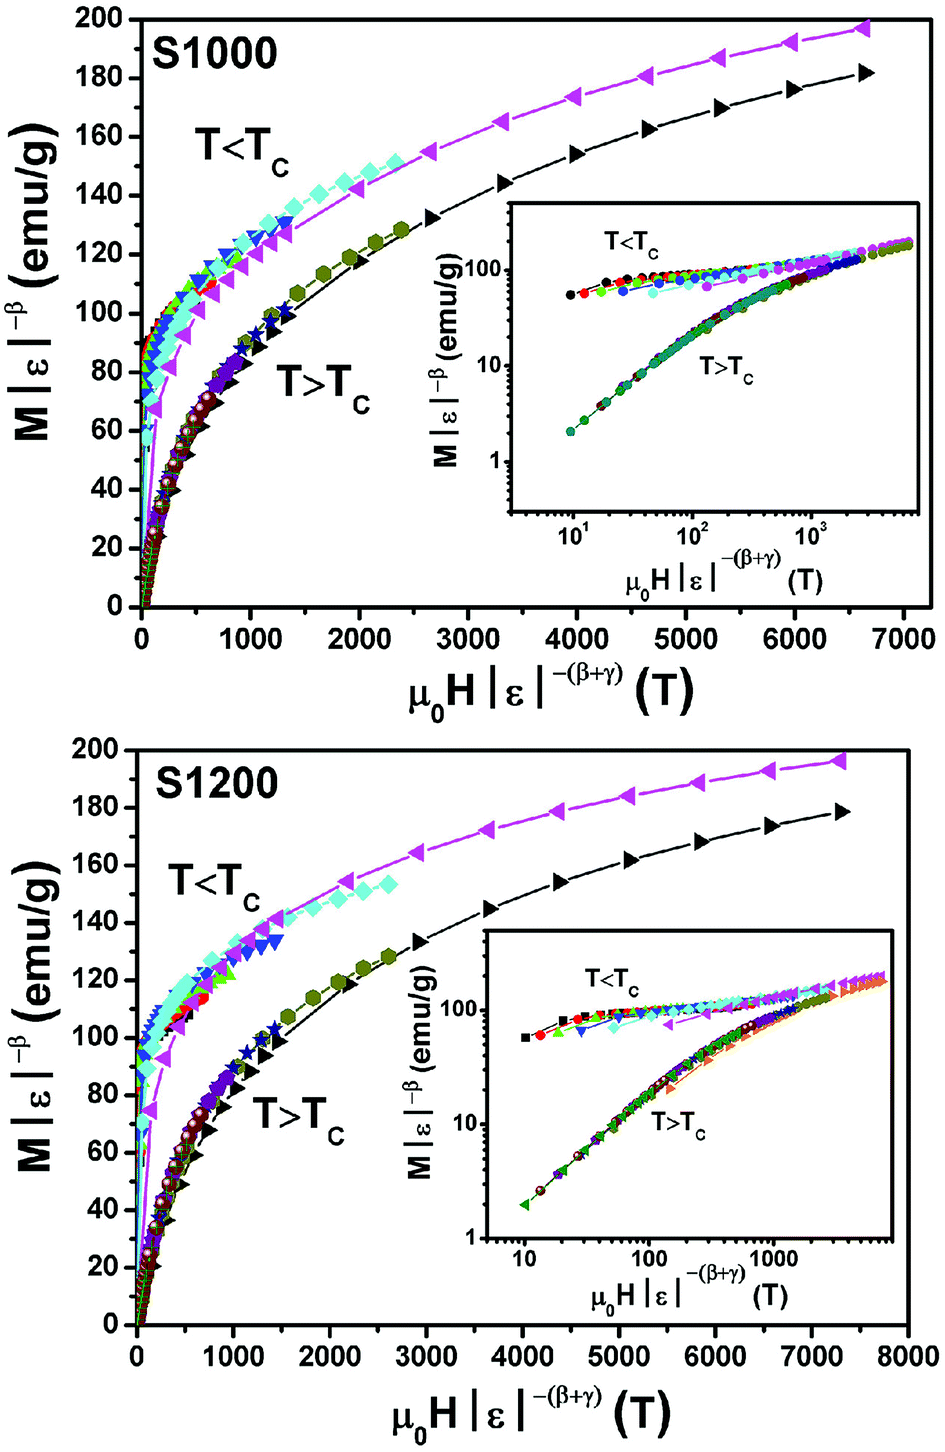
By replacing β and γ in this equation with the values shown in Fig. 12 and 13, eqn (12) gave δ values of 3.331 and 3.329 for S1000, and 3.638 and 3.662 for S1200. These values were very close to those estimated from the critical isotherm at TC, as shown in Fig. 14 (δ = 3.311 and 3.650 for S1000 and S1200, respectively). These results implied that the values of β, γ, and δ were well determined. Variation in the term (M|ε|−β) vs. (μ0H|ε|−(β+γ)) according to eqn (8) is plotted in Fig. 15 using the β and γ values previously obtained by the Kouvel–Fisher method for some temperatures below and above the TC. Fig. 15 shows the superposition of all curves along two separate branches for (T < TC) and (T > TC), respectively, which suggested that the obtained values of critical exponents and those for TC were reasonably precise. The insets of Fig. 15 also show the variation in these curves on the log–log scale. A linear superposition was observed at higher magnetic fields in the curves in the two regions (below and above TC), while the setting of the curves to the log–log scale became especially bad in the weak fields (some bifurcations of the curves were observed in different directions). This confirmed that this scale theory gives much more importance to data in higher fields than those in weak fields.
 | ||
| Fig. 15 Scaling plots for S1000 and S1200 below and above TC values using β and γ estimated using the Kouvel–Fisher method. Insets show plots in the log–log scale. | ||
The influence of the critical exponents on the MCE can be demonstrated by analyzing the variation in the magnetic entropy change with magnetic field according to following power law:41
| |ΔSmaxM| = a(μ0H)n | (13) |
 | (14) |
 | (15) |
By considering the values of β and γ obtained from the Kouvel–Fisher method, and the values of δ obtained from the M(TC, H) critical isotherms, the n values calculated from the previous relations were:
From eqn (14):
From eqn (15):
The n values can also be estimated by fitting the |ΔSmaxM| vs. μ0H curve at TC according to eqn (13), as shown in Fig. 16. The fitting curves gave n values of 0.626 and 0.601 for S1000 and S1200, respectively. These values were in good agreement with those obtained from eqn (14) and (15). This suggested that the critical exponents obtained for the studied samples were reliable. The obtained values of the critical exponents of S1000 and S1200 (present work) are compared with the predicted values of the four theoretical models in Table 3.35,36 We found that β and δ exponents lay between the mean field model and the 3D Heisenberg model, while the δ values were close to that of the mean field model. However, as the sintering temperature increased, the critical exponent β decreased, while γ and δ exponents increased. The decreasing β exponent reflected a faster growth of the ordered moment with increasing sintering temperature. However, the deviation of this exponent from the mean field model was attributed to the presence of an inhomogeneous magnetic state in the samples.43,44
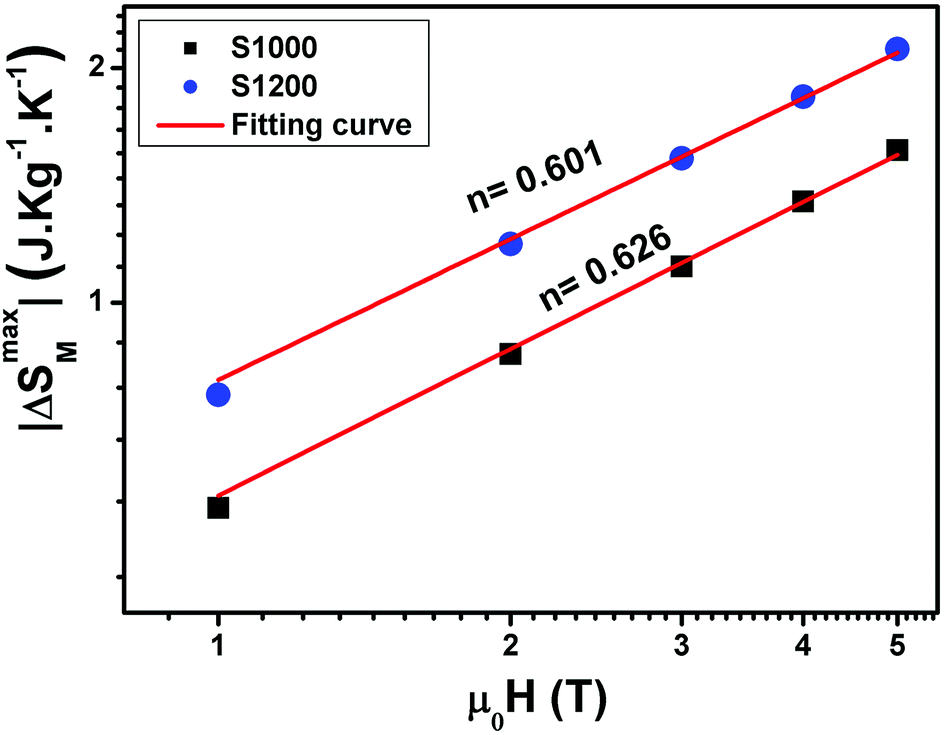 | ||
| Fig. 16 Magnetic field dependence of |ΔSmaxM| at TC fitted to the power law |ΔSmaxM| = a(μ0H)n for S1000 and S1200. | ||
| Material | Technique | TC (K) | β | γ | δ | Ref. |
|---|---|---|---|---|---|---|
| Mean-field model | 0.5 | 1.0 | 3.0 | 35 | ||
| 3D Heisenberg model | 0.365 ± 0.003 | 1.336 ± 0.004 | 4.80 ± 0.04 | 35 | ||
| 3D Ising model | 0.325 ± 0.002 | 1.24 ± 0.002 | 4.82 ± 0.02 | 35 | ||
| Tricritical mean-field model | 0.25 | 1.0 | 5.0 | 36 | ||
| Ni0.6Cd0.2Cu0.2Fe2O4 (1000 °C) | Modified Arrott plots | 55.65 ± 0.403 | 0.444 ± 0.003 | — | — | Present work |
| 655.79 ± 0.483 | — | 1.035 ± 0.008 | — | |||
| Kouvel–Fisher method | 654.98 ± 0.585 | 0.443 ± 0.003 | — | — | ||
| 655.48 ± 0.503 | — | 1.032 ± 0.001 | — | |||
| Critical isotherm | — | — | — | 3.311 ± 0.006 | ||
| Ni0.6Cd0.2Cu0.2Fe2O4 (1200 °C) | Modified Arrott plots | 681.43 ± 0.585 | 0.406 ± 0.007 | — | — | Present work |
| 680.70 ± 0.365 | — | 1.071 ± 0.006 | — | |||
| Kouvel–Fisher method | 681.60 ± 0.238 | 0.403 ± 0.008 | — | — | ||
| 680.39 ± 0.330 | — | 1.073 ± 0.016 | — | |||
| Critical isotherm | — | — | — | 3.650 ± 0.005 |
4. Conclusion
The sol–gel method was used to prepare Ni0.6Cd0.4Cu0.2Fe2O4 ferrites at sintering temperatures of 1000 °C and 1200 °C. XRD patterns and Rietveld refinements confirmed that the samples had cubic spinel type structures. Magnetic measurements showed that the samples presented second-order FM–PM phase transitions with increasing magnetization amplitude and Curie temperature when the sintering temperature was increased. The values of maximum magnetic entropy change and relative cooling power were relatively high and comparable to those of some other ferrite systems considered potential candidates for magnetic refrigeration. This showed that the prepared samples were useful for cooling power technology. Critical exponents β, γ, and δ were determined using different methods. These exponents belonged to a different universality class, with exponent β decreasing and exponents γ and δ increasing with increasing sintering temperature.Conflicts of interest
There are no conflicts to declare.Acknowledgements
The authors gratefully acknowledge Qassim University, represented by the Deanship of Scientific Research, for material support of this research under the grant number 5090-cosabu-2018-1-14-S during academic year 2018.References
- M. H. Phan and S. C. Yu, J. Magn. Magn. Mater., 2007, 308, 325 CrossRef CAS.
- G. V. Brown, J. Appl. Phys., 1976, 47, 3673 CrossRef CAS.
- M. Foldeaki, R. Chachine and T. K. Bose, J. Appl. Phys., 1995, 77(7), 3528 CrossRef.
- S. Hcini, M. Boudard, S. Zemni and M. Oumezzine, Ceram. Int., 2014, 40, 16041 CrossRef CAS.
- E. Oumezzine, S. Hcini, E. K. Hlil, E. Dhahri and M. Oumezzine, J. Alloys Compd., 2014, 615, 553 CrossRef CAS.
- M. Iqbal, M. N. Khan, A. A. Khan and N. Zafar, J. Alloys Compd., 2018, 769, 766 CrossRef CAS.
- A. Elghoul, A. Krichene, N. C. Boudjada and W. Boujelben, Ceram. Int., 2018, 44, 12723 CrossRef CAS.
- R. Thaljaoui, M. Pękała, J.-F. Fagnard and Ph. Vanderbemden, J. Rare Earths, 2017, 35, 875 CrossRef CAS.
- E. Oumezzine, S. Hcini, M. Baazaoui, E. K. Hlil and M. Oumezzine, Powder Technol., 2015, 278, 189 CrossRef CAS.
- M. S. Anwar, F. Ahmed and B. H. Koo, Acta Mater., 2014, 71, 100 CrossRef CAS.
- S. Akhter, D. P. Paul, S. M. Hoque, M. A. Hakim, M. Hudl, R. Mathieu and P. Nordblad, J. Magn. Magn. Mater., 2014, 367, 75 CrossRef CAS.
- A. A. Khan, U. Hira, Z. Iqbal, M. Usman and F. Sher, Ceram. Int., 2017, 43, 7088 CrossRef CAS.
- R. Felhi, H. Omrani, M. Koubaa, W. Cheikhrouhou Koubaa and A. Cheikhrouhou, J. Alloys Compd., 2018, 758, 237 CrossRef CAS.
- S. Hcini, N. Kouki, R. Aldawas, M. Boudard, A. Dhahri and M. L. Bouazizi, J. Supercond. Novel Magn., 2018 DOI:10.1007/s10948-018-4813-6.
- V. K. Pecharsky and K. A. Gschneidner Jr, Phys. Rev. Lett., 1997, 78(23), 4494 CrossRef CAS.
- B. Anis, T. Samanta, S. Banerjee and I. Das, Appl. Phys. Lett., 2008, 9(2), 212502 Search PubMed.
- H. M. Rietveld, J. Appl. Crystallogr., 1969, 2, 65 CrossRef CAS.
- M. A. Hakim, S. K. Nath, S. S. Sikder and K. H. Maria, J. Phys. Chem. Solids, 2013, 74, 1316 CrossRef CAS.
- K. S. Lohar, S. M. Patange, M. L. Mane and S. E. Shirsath, J. Mol. Struct., 2013, 1032, 105 CrossRef CAS.
- M. Houshiar and L. Jamilpanah, Mater. Res. Bull., 2018, 98, 213 CrossRef CAS.
- A. Gholizadeh and E. Jafari, J. Magn. Magn. Mater., 2017, 422, 328 CrossRef CAS.
- R. P. Patil, P. P. Hankare, K. M. Garadkar and R. Sasikala, J. Alloys Compd., 2012, 523, 66 CrossRef CAS.
- M. Rahimi, P. Kameli, M. Ranjbar and H. Salamati, J. Nanopart. Res., 2013, 15, 1865 CrossRef.
- N. Pailhé, A. Wattiaux, M. Gaudon and A. Demourgues, J. Solid State Chem., 2008, 181, 1040 CrossRef.
- K. Verma, A. Kumar and D. Varshney, J. Alloys Compd., 2012, 526, 91 CrossRef CAS.
- V. Sepelak, D. Baabe, D. Mienert, D. Schultze, F. Krumeich, F. J. Litterst and K. D. Becker, J. Magn. Magn. Mater., 2003, 257, 377 CrossRef CAS.
- G. Ahmad and J. Elahe, J. Magn. Magn. Mater., 2017, 422, 328 CrossRef.
- Z. Zi, Y. Sun, X. Zhu, Z. Yang, J. Dai and W. Song, J. Magn. Magn. Mater., 2009, 321, 1251 CrossRef CAS.
- A. Arrott, Phys. Rev., 1957, 108, 1394 CrossRef CAS.
- S. K. Banerjee, Phys. Lett., 1964, 12, 16 CrossRef.
- R. M’nassri, N. C. Boudjada and A. Cheikhrouhou, J. Alloys Compd., 2015, 626, 20 CrossRef.
- S. R. Lee, M. S. Anwar, F. Ahmed and B. H. Koo, Trans. Nonferrous Met. Soc. China, 2014, 24, s141 CrossRef CAS.
- H. E. Stanley, Introduction to Phase Transitions and Critical Phenomena, Oxford University Press, London, 1971 Search PubMed.
- A. Arrott and J. E. Noakes, Phys. Rev. Lett., 1967, 19, 786 CrossRef CAS.
- S. N. Kaul, J. Magn. Magn. Mater., 1985, 53, 5 CrossRef CAS.
- K. Huang, Statistical Mechanics, Wiley, New York, 2nd edn, 1987 Search PubMed.
- A. Schwartz, M. Scheffler and S. M. Anlage, Phys. Rev. B: Condens. Matter Mater. Phys., 2000, 61, R870 CrossRef CAS.
- M. E. Fisher, S. K. Ma and B. G. Nickel, Phys. Rev. Lett., 1972, 29, 917 CrossRef.
- J. S. Kouvel and M. E. Fisher, Phys. Rev., 1964, 136, 1626 CrossRef CAS.
- B. Widom, J. Chem. Phys., 1964, 41, 1633 CrossRef.
- Q. Y. Dong, H. W. Zhang, J. R. Sun, B. G. Shen and V. Franco, J. Appl. Phys., 2008, 103, 116101 CrossRef.
- V. Franco, J. S. Blázquez and A. Conde, Appl. Phys. Lett., 2006, 89, 222512 CrossRef.
- J. Fan, L. Ling, B. Hong, L. Zhang, L. Pi and Y. Zhang, Phys. Rev. B: Condens. Matter Mater. Phys., 2010, 81, 144426 CrossRef.
- T. D. Thanh, Y. YiKyung, T. A. Ho, T. V. Manh, T. L. Phan, D. M. Tartakovsky and S. C. Yu, IEEE Trans. Magn., 2015, 51, 1 CAS.
Footnote |
| † Inversion is defined as the fraction of A sites occupied by Fe3+ cations and its value depends on the method of preparation and heat treatment effects.27 |
| This journal is © The Royal Society of Chemistry 2019 |