 Open Access Article
Creative Commons Attribution 3.0 Unported Licence
Kerr gated Raman spectroscopy of LiPF6 salt and LiPF6-based organic carbonate electrolyte for Li-ion batteries†
Laura
Cabo-Fernandez
a,
Alex R.
Neale
 a,
Filipe
Braga
a,
Igor V.
Sazanovich
b,
Robert
Kostecki
c and
Laurence J.
Hardwick
a,
Filipe
Braga
a,
Igor V.
Sazanovich
b,
Robert
Kostecki
c and
Laurence J.
Hardwick
 *a
*a
aStephenson Institute for Renewable Energy, Department of Chemistry, University of Liverpool, Peach Street, Liverpool, L69 7ZF, UK. E-mail: hardwick@liverpool.ac.uk
bCentral Laser Facility, Research Complex at Harwell, STFC Rutherford Appleton Laboratory, Harwell Campus, Didcot, Oxfordshire OX11 0QX, UK
cEnergy Storage and Distributed Resources Division, Lawrence Berkeley National Laboratory, Berkeley, CA 94720, USA
First published on 20th September 2019
Abstract
Fluorescent species are formed during cycling of lithium ion batteries as a result of electrolyte decomposition due to the instability of the non-aqueous electrolytes and side reactions that occur at the electrode surface. The increase in the background fluorescence due to the presence of these components makes it harder to analyse data due to the spectroscopic overlap of Raman scattering and fluorescence. Herein, Kerr gated Raman spectroscopy was shown to be an effective technique for the isolation of the scattering effect from the fluorescence enabling the collection of the Raman spectra of LiPF6 salt and LiPF6-based organic carbonate electrolyte, without the interference of the fluorescence component. Kerr gated Raman was able to identify POF3 on the LiPF6 particle surface, after the addition of trace water.
1. Introduction
Raman spectroscopy is an optical spectroscopic technique capable of probing the chemical composition and structure of molecules and materials.1 The sample under study is illuminated by monochromatic laser light, the molecules within that sample interact with the incident photon through the virtual energy level and then another photon is scattered; therefore, scattering processes can be looked at as the absorption of one photon and the instantaneous emission of another photon, as seen in Fig. 1(a). The energy difference of the photons can be related to the vibrational and rotational transitions that occur in the molecule, providing structural information.1 Other phenomena can also occur when the molecule is excited by an optical beam. During the absorption of a photon, a molecule can be excited from the ground electronic state (S0) to a higher energy electronic state (e.g., S1). There is then a relaxation from the higher vibrational level to the zero vibrational level of this excited state (S1), and finally the emission of a photon during the relaxation from S1 to S0 as seen in Fig. 1(a). This process is known as fluorescence.1,2 The photon emitted during fluorescence has lower energy, thus the peak appears in the spectrum at longer wavelengths than the absorption peak; and this difference in wavelength is known as Stokes shift.1,2 Electron excitation-based fluorescence and Raman scattering may originate from the same optical excitation process and they can spectroscopically overlap upon laser excitation leading to convoluted spectra, which can hamper the analysis of the material.3 The quantum yield (Q) of fluorescence could be several order of magnitude higher than the scattering, which indicates that even at low concentrations of fluorescent species (e.g., 1 ppm) fluorescence can easily overwhelm Raman scattering signal making it difficult to detect and analyse (see ESI† for further explanation).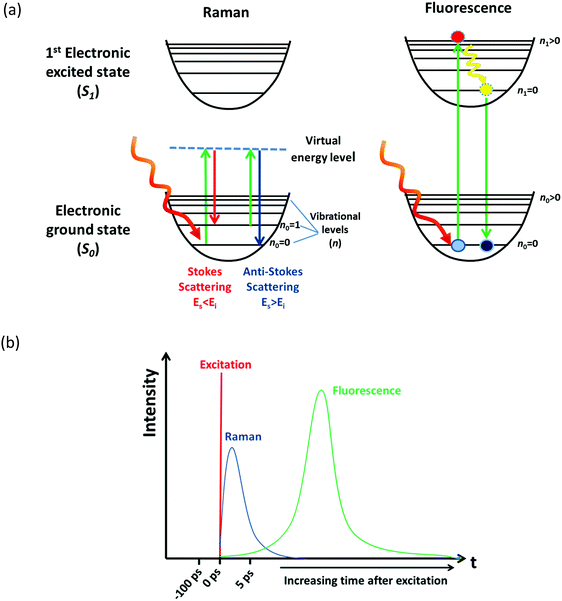 | ||
| Fig. 1 (a) Representation of Raman and fluorescence phenomena upon laser excitation of a molecule, and (b) schematics of the timescale of Raman and fluorescence processes. | ||
Ageing mechanisms have a great impact into batteries calendar life and performance. A better understanding of these complex processes is critical to improve the lifetime of the battery for diverse application such as in automotive industry.4 Electrolyte ageing plays a key role in the decrease of capacity since insoluble species and gas by-products are formed during the electrochemical cycling of the battery.5 Electrolyte and surface films formed during electrolyte degradation can be analysed by on-line mass spectroscopy, inductively coupled plasma-mass spectroscopy (ICP-MS), NMR, differential electrochemical mass spectrometry (DEMS), FTIR, gel permeation chromatography and high performance liquid chromatography (HPLC) and gas chromatography (GC).5–11 Raman spectroscopy is sensitive to subtle changes in bonding, coordination and formation of products.12 Thus, it is a powerful technique to monitor ageing of battery electrolytes and investigation of electrode surface films under in situ or operando conditions during electrochemical cycling.13 However, fluorescent species are often present in a conventional lithium batteries electrolyte and at the electrode/electrolyte interface as a result of degradation and ageing processes that occur during battery cycling under different conditions.4,11,14,15 The presence of these fluorescent species complicates the characterisation of the electrode interfaces by Raman spectroscopy due to the spectral time coincidence and photon energy overlapping of fluorescence and Raman signals under continuous-wave (CW) laser excitation. One solution to avoid fluorescence is to use a laser excitation in the near infrared (such as 1064 nm) to generate the Raman scattering.
Fourier transform (FT) Raman spectroscopy was developed to avoid the fluorescence problems that arise in conventional Raman spectroscopy and in particular has been utilised in the study of polymeric materials.16 In order to eliminate the fluorescence, lasers with excitation wavelengths in the near infrared region are used. The use of interferometers has some advantages, such as high efficiency during signal collection and wavelength precision. However, FT-Raman spectroscopy has also the following disadvantage whereby it is difficult to differentiate the weak Raman signal and the strong Rayleigh scattering that reaches the detector. As a result, an increase in the signal-to-noise ratio is distributed over the whole spectrum. Another drawback of this technique is the loss in sensitivity associated with the small cross section for the scattering when using lasers with excitation wavelengths in the IR region.16
The strength of the Raman signal depends on the laser frequency as forth of the power (ϑ4),17 therefore there is a considerable drop of the signal when lasers with excitation wavelengths in the near infrared region are used in comparison to lasers in the visible region (e.g. 400 nm).
 | (1) |
Kerr gated Raman is also an effective technique to suppress the fluorescence background in Raman experiments,18–21 thereby providing extra sensitivity via use of lower wavelength laser excitation in order to allow detection of surface layers and solid electrolyte interphase compounds on battery electrodes.
Kerr gated Raman is based on the different time-dependence of fluorescence and Raman scattering signals upon short-pulse optical excitation. While fluorescence has a finite lifetime in the order of hundreds of picoseconds (ps) to nanoseconds (ns), Raman scattering is instantaneous and follows in time the initiating laser pulse within picoseconds (ps) or femtoseconds (fs) as seen in Fig. 1(b).1–3 Such distinct time-domains for these two processes opens up a technical opportunity for separating them, provided an ultra-fast gating mechanism of the optical signal is coupled with the excitation pulse. Kerr gated consists of a non-linear medium carbon disulphide (CS2), which acts as a half-wave plate due to a transient anisotropy induced in the medium by a high-energy gating laser pulse (λ = 800 nm, 1 ps).3,20,21 When gating laser pulse and excitation laser are timed appropriately, the polarisation of the Raman signal is rotated by 90° vs. the slower fluorescence emission signal, resulting in an effective transmission of the Raman scattering by the two crossed polarisers, while the fluorescence is mostly blocked (Scheme 1).3,19–21
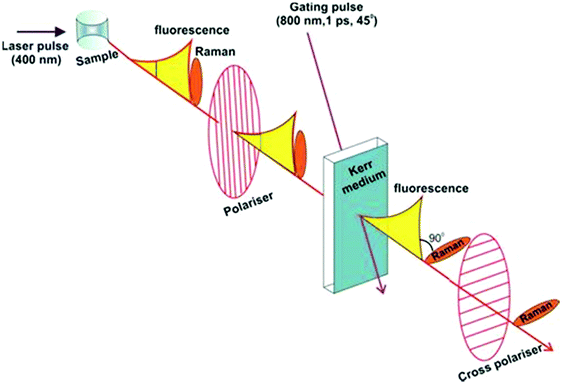 | ||
| Scheme 1 Schematic representation of Kerr gated Raman spectroscopy setup (adapted from Central Laser Facilities website https://www.clf.stfc.ac.uk/Pages/Kerr-Gated-Raman-Spectroscopy.aspx). | ||
Kerr gated Raman has been proven to be an efficient technique for the suppression of fluorescence emission in chemical and biological samples;19–24 however, its application may be limited by the use of a high-energy pulse laser that could damage or decompose the sample.3 To the best of our knowledge, Kerr gated Raman has not yet been used to mitigate fluorescence background from Raman studies of Li-ion battery electrode materials and interfaces. In the present work with the purpose of making the proof-of-concept, we study by Kerr gated Raman a conventional lithium salt in battery electrolytes, LiPF6, and its 1 M solution in ethylene carbonate (EC) and dimethyl carbonate (DMC) mixture.
2. Experimental
2.1. Chemicals
Lithium hexafluorophosphate salt (LiPF6, battery grade, >99.99% trace metals basis), ethylene carbonate (EC, anhydrous, 99%), dimethyl carbonate (DMC, anhydrous, ≥99%) were purchased from Sigma Aldrich. The commercial electrolyte 1 M LiPF6 in 1![[thin space (1/6-em)]](https://www.rsc.org/images/entities/char_2009.gif) :
:![[thin space (1/6-em)]](https://www.rsc.org/images/entities/char_2009.gif) 1 w/w EC/DMC (LP30) was supplied by BASF. These compounds were received in a can sealed under inert atmosphere and immediately inserted into an Ar-filled glovebox (H2O and O2 levels <1 ppm) before breaking the seal. All compounds and electrolytes were stored, handled and prepared in the same glovebox to avoid atmospheric and moisture contamination. Since LiPF6 can react with components from glass bottles, the lithium salt was stored in plastic containers.
1 w/w EC/DMC (LP30) was supplied by BASF. These compounds were received in a can sealed under inert atmosphere and immediately inserted into an Ar-filled glovebox (H2O and O2 levels <1 ppm) before breaking the seal. All compounds and electrolytes were stored, handled and prepared in the same glovebox to avoid atmospheric and moisture contamination. Since LiPF6 can react with components from glass bottles, the lithium salt was stored in plastic containers.
2.2. Raman measurements
Since the samples under investigation were air-sensitive, they were assembled inside of sealed quartz cuvettes. Raman CW (continuous wave) measurements with laser wavelengths of 532 nm, 633 nm and 785 nm were run with an in via Renishaw Raman spectrometer with a Leica microscope focussing on the sample via 50× objective (Leica). For 1064 nm wavelength a FT-Raman (1064 nm) (Bruker, MultiRAM) was used in back-scattered mode.Kerr gated Raman experiments (depicted in Scheme 1) were performed at ULTRA laser facilities (Central Laser Facility, STFC, Rutherford Appleton Laboratories).25 The Kerr gating system was driven by a ps arm of a THALES dual-beam Ti:Sapphire laser producing 0.8 mJ at 800 nm at 10 kHz repetition rate (pulse duration tuneable between 1 to 3 ps).26 The optical gating was achieved through inducing Kerr effect in carbon disulphide (CS2) with focused fundamental beam of the laser. The 2 mm cell with CS2 was placed between the two crossed polarisers, and the gating 800 nm beam was focused onto CS2 into 0.5 mm spot (the pulse energy at the CS2 cell was 0.25 mJ). The polarisation of the gating beam was set at 45° with respect to the polarisers. Raman signal of the samples was probed at 400 nm with picosecond laser pulses. To produce that 400 nm Raman probe beam, some of the fundamental output beam of the laser (at 800 nm) had been split with optical beamsplitter and sent into a β-barium borate crystal for frequency doubling. Raman probe beam was focused into 150 μm spot at sample, the pulse energy at the sample was kept below 0.5 μJ, and the Raman signal was detected at parallel polarisation. To match the arrival time of the Raman signal at CS2 cell to the arrival of the gating pulse, the optical delay line used was composed of the computer-controlled motorised linear stage and a hollow retro-reflector. Due to dispersion of light, the arrival time of Raman signal to the gate varied across the spectral detection range by ca. 2 ps. To account for that, a number of time delays were scanned during experiment near optimal signal arrival time. Kerr gated Raman spectra were collected under rastering conditions with a laser power of 5 mW; spectra shown is an average of 5 to 10 repeats of 20 s to 60 s acquisition each, depending on the sample. Raman spectra shown in the present work are not baseline corrected in order to be able to observe the influence of the fluorescence in the spectrum background, unless otherwise indicated.
3. Results and discussion
3.1. Kerr gated Raman studies of lithium hexafluorophosphate salt (LiPF6)
Lithium hexafluorophosphate is commonly used as lithium salt in organic carbonate-based electrolytes for lithium-ion batteries. LiPF6 is unstable at temperatures above 60 °C and it readily reacts with trace amounts of water due to its high hydrophilicity, leading to several decomposition reactions.27–30Kock et al.31 reported that the Raman spectrum for pristine, anhydrous alkali metal-PF6 salts presents four intense bands at 475, 560, 571 and 745 cm−1 assigned to the Eg, T1U, T2g and A1g vibrations of PF6− anion, respectively.
Fig. 2 presents Raman spectra for pristine LiPF6 salt measured with different laser wavelengths across the visible spectrum (400, 532, 633 and 785 nm). For 532, 633 and 785 nm, the four expected Raman bands mentioned above are observable. However, large background emission contributions at all four excitation wavelengths dominate the spectra in pristine sample, with the 400 nm spectra being completely featureless. In addition, it is possible to observe that there is a dependence on the laser wavelength; the spectra have similar shape to emission spectra as seen in Fig. S1 in the ESI.† According to the principles of the fluorescence excitation and emission mechanism, the signal should be independent of the excitation wavelength according to Kasha's rule;32 however, it has been recently published some cases in which Kasha's rule is not followed.32,33 In the present study, a dependence of the spectrum shape on the excitation wavelength is observed indicating that Kasha's rule is not applicable for LiPF6 salt and the electrolyte samples. Possible reasons could be (i) the presence of several emitting species with different absorption and emission spectra, or (ii) the energy levels of the material are not strongly coupled to each other, and the emission might occur from different excited states depending on which one is excited. Recent work highlights that similar background emission seen in Li-ion battery electrolytes may originate from hydrogen bonding interactions between PF6− and the carbonate-based solvent, rather than electronic states.34 A similar mechanism could be in play here between trace water (H2O) and LiPF6.
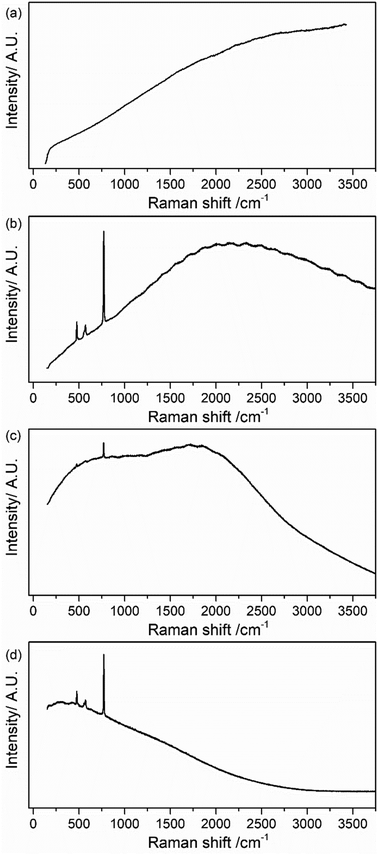 | ||
| Fig. 2 CW Raman spectrum of pristine LiPF6 salt collected with a laser wavelength of (a) 400 nm, (b) 532 nm, (c) 633 nm and (d) 785 nm. | ||
The LiPF6 salt is not anticipated to generate a fluorescence signal, as fluorescence occurs in general from compounds that have conjugated groups within the structure.2 Thereby, there are different products, as yet undetected and in low concentration, present on the sample surface which contribute to the observed background emission. The origin of fluorescence in Li-ion systems has been reported to occur from three types of species: conjugating double bounds, such as diketones,14 inorganic ligands, such as MnAcAc species,14 and non-stoichiometric inorganic compounds, such as halophosphates, LixPyFzO (or Lix(PO4)yFz).35–38 As there are no metal or organic compounds present in the salt sample, it is consequently generally speculated that the halophosphate, LixPyFzO present on the surface of the LiPF6 powder from reaction with trace water is the source in this case for the observed fluorescence. As this a non-stoichiometric species with a low Raman cross-section, it could be therefore challenging to detect any bands, even with the Kerr gate.
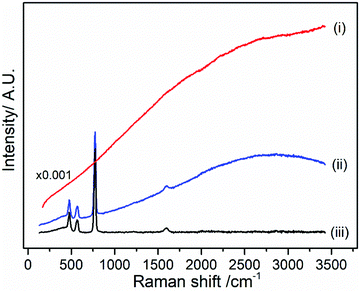
Kerr gated Raman measurements of LiPF6 salt were carried out to probe if the fluorescence emission can be minimised and peaks associated with LiPF6 can be more clearly revealed. Under Kerr gate conditions, the background fluorescent emission was minimised significantly by a factor of ca. 1000, allowing the observation of several peaks in the spectrum as shown in Fig. 3, which can be treated with a baseline correction.
The peaks observed in the spectrum (Fig. 3(iii)) were fitted with Lorentzian function after baseline subtraction (Fig. S2 in ESI†). The peaks associated with LiPF6 are observed at 475, 559, 572 and 772 cm−1 (Table 1 and Table S1 in ESI†). Two further peaks are observed at 1217 and 1593 cm−1, where as they are absent in the spectra of LiPF6 obtained with FT-Raman at 1064 nm (Fig. S3, ESI†). Measurements were carried out in a quartz cuvette and this baseline spectrum of the cuvette were taken into account in the fitting (see Table S2 and Fig. S4, S5 in ESI†). FT-Raman spectrum of LiPF6 salt displayed the lowest background highlighting that fluorescence problems can be avoided for use of routine sample analysis. The two additional peaks are tentatively assigned as C![[double bond, length as m-dash]](https://www.rsc.org/images/entities/char_e001.gif) O and C–O vibrations arising from trace organic solvent used to recrystallize LiPF6 during the manufacturing process.39 These peaks are detectable due to the higher sensitivity from the 400 nm excitation (eqn (1)) emphasising the opportunity to detect organic components of the solid electrolyte interphase (SEI), but may also be revealing the potential origin of the widely observed fluorescent background.
O and C–O vibrations arising from trace organic solvent used to recrystallize LiPF6 during the manufacturing process.39 These peaks are detectable due to the higher sensitivity from the 400 nm excitation (eqn (1)) emphasising the opportunity to detect organic components of the solid electrolyte interphase (SEI), but may also be revealing the potential origin of the widely observed fluorescent background.
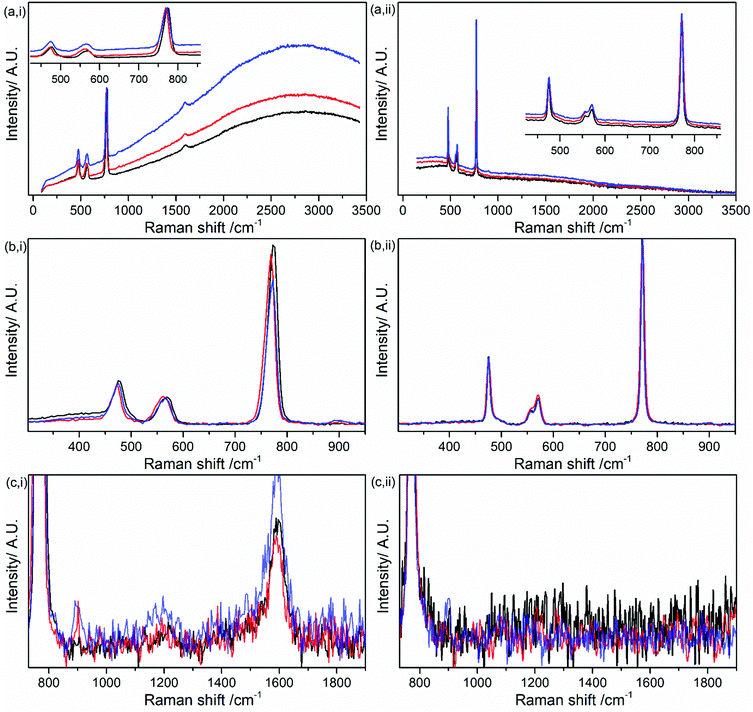
To investigate the influence of trace water on the Raman spectrum of LiPF6 using the Kerr gate, 100 μL of H2O was added to 0.5 g of LiPF6 (Fig. 4). Kerr gated spectra show the growth in the background emission from pristine to 15 h after 100 μL H2O addition (red trace) and three days after H2O addition (Fig. 4a(i)). The background growth highlights that the growth in emission cannot be attributed fully to the detected organic compounds left over in the salt, but must also occur from another source, such as LixPyFzO, as discussed earlier. The trend in the growth in background emission is similar, but minimal for the comparative FT-Raman measurement (Fig. 4a(ii)). The mains bands for LiPF6 are observed for the pristine salt (Table 1) are observed in Fig. 4b(i) and (ii). However, after 3 days an additional weak band at 900 cm−1 has emerged from the background noise in the Kerr gated spectra (Fig. 4c(i)) and could be assigned as the stretching of P–F bond in the compound POF3.40 In the FT-Raman a similar positioned weakly intense peak could be discerned, but it remains within the noise level (Fig. 4c(ii)).
POF3 has been reported as a spontaneous decomposition products of LiPF6 as a result of anion dissociation reactions in the presence of trace amounts of water:9,11,34
| LiPF6 ↔ LiF + PF5 | (2) |
| PF5 + H2O → POF3 + 2HF | (3) |
| POF3 + H2O → HPO2F2 + HF | (4) |
3.2. Kerr gated Raman studies of 1 M LiPF6 in EC/DMC electrolyte
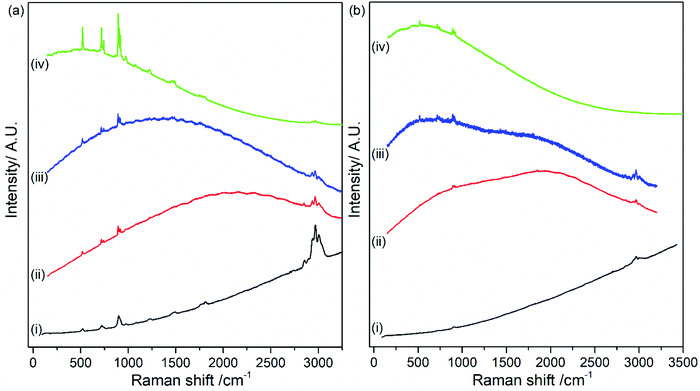
The effect of organic carbonate solvents (i.e., EC and DMC) on the stability and degradation mechanism of LiPF6 was studied in a similar sequence of conventional CW Raman and Kerr gated Raman spectroscopy measurements. Fig. 5 shows the CW spectra of (a) freshly prepared and (b) commercial electrolyte collected with 400, 532, 633 and 785 nm laser wavelength. Fluorescence emission backgrounds are observed in the spectra for all the laser wavelengths and are greater in the commercial electrolyte. The difference is likely due to length of time between the original electrolyte preparation, which was under a week for the freshly prepared and unknown in the commercial case. The baseline of the Raman spectra is consistent with those observed in Fig. 2 for LiPF6 salt (see Fig. S6 in ESI†); therefore, these results suggest that the main source of fluorescence arise from the electrolyte salt. This is also supported by the Raman spectra of the solvents DMC, EC and EC/DMC mixture in the absence of the salt in Table S3 and Fig. S7–S9 (in ESI†), in which there is no fluorescence background as seen. Despite the background fluorescence, it is still possible to distinguish the typical peaks for DMC and EC at 518, 717, 723, 893, 904, 916, 973, 1220, 1455, 1487, 1750, 1808, 2849, 2888, 2935, 2967 and 3002 cm−1. The A1g vibration of the PF6− anion is detected at 741 cm−1. The distinct observation of Raman bands, even at 400 nm excitation, is the result of the lower concentration of LiPF6 in the electrolyte and thus a lower concentration of fluorescent species, resulting from as yet unidentified side reaction products (i.e., salt concentration is 1 M in the electrolyte). From analysis of the spectra no additional peaks pertaining to decomposition products were observed. A higher wavelength excitation (1064 nm) was again used to examine the electrolyte and this is shown in Fig. S10 in ESI.† At this higher wavelength, a fluorescence background is still observed, albeit much lower intensity, thereby allowing measurement of electrolyte Raman bands. In the next section it will be shown that Kerr gating can completely remove this background, giving a flat baseline.The lower concentration of LiPF6 in the electrolyte, when compared to the salt, could also be the reason for the complete suppression of the fluorescence from the spectra shown in Fig. S11(a) (in ESI†) collected during Kerr gated measurements. This probes the efficiency of Kerr gate technique in the removal of the fluorescence emission, allowing the observation of intense Raman peaks assigned to vibrational modes of LiPF6, EC and DMC. Peak positions and assignment are summarised in Table S4 (in ESI†). Fig. S12 and S13 (in ESI†) show the individual spectra measured at (a) 400 nm, (b) 532 nm, (c) 633 nm, (d) 785 nm and (e) 1064 nm and the time delay collection, showing similar features to the commercial electrolyte.
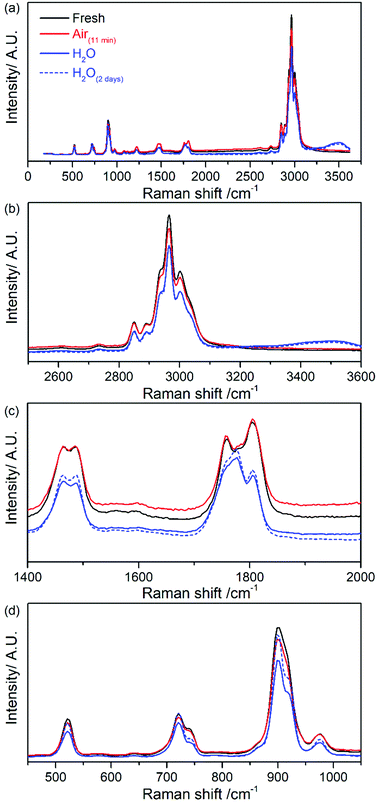
Fig. 6 shows the complete removal of the emission background via use of the Kerr gate on commercial 1 M LiPF6 in EC/DMC (1![[thin space (1/6-em)]](https://www.rsc.org/images/entities/char_2009.gif) :
:![[thin space (1/6-em)]](https://www.rsc.org/images/entities/char_2009.gif) 1 w/w) electrolyte, giving a flat baseline. This result highlights that the emission background originates predominantly from fluorescence. Chemical stability and ageing of the electrolyte after exposure to ambient atmosphere for 11 minutes and after addition of 30% (v/v) of water (e.g., at t = 0 minutes and after 2 days) were also investigated. Kerr gated spectra of the electrolyte after exposure to ambient atmosphere for 11 minutes shown in Fig. S11(b) (in ESI†) are identical to those collected for fresh electrolyte (Fig. S11(a) in ESI†), indicating that there is no clear evidence of rapid electrolyte decomposition in the Raman spectra. In fact, there is no increase of the fluorescent background emission in the Raman spectra collected at different delay times. The baseline remains flat in all cases. After addition of water into the electrolyte, a new band appears at approximately 3500 cm−1 that is related to vibrational modes of O–H bonds.41 The rest of the spectroscopic features remain almost the same at the beginning of the ageing process and after 2 days of storage as observed in the spectra in Fig. 6a and b (Fig. S11(c) and (d) in ESI†). The main differences observed are within the region of C
1 w/w) electrolyte, giving a flat baseline. This result highlights that the emission background originates predominantly from fluorescence. Chemical stability and ageing of the electrolyte after exposure to ambient atmosphere for 11 minutes and after addition of 30% (v/v) of water (e.g., at t = 0 minutes and after 2 days) were also investigated. Kerr gated spectra of the electrolyte after exposure to ambient atmosphere for 11 minutes shown in Fig. S11(b) (in ESI†) are identical to those collected for fresh electrolyte (Fig. S11(a) in ESI†), indicating that there is no clear evidence of rapid electrolyte decomposition in the Raman spectra. In fact, there is no increase of the fluorescent background emission in the Raman spectra collected at different delay times. The baseline remains flat in all cases. After addition of water into the electrolyte, a new band appears at approximately 3500 cm−1 that is related to vibrational modes of O–H bonds.41 The rest of the spectroscopic features remain almost the same at the beginning of the ageing process and after 2 days of storage as observed in the spectra in Fig. 6a and b (Fig. S11(c) and (d) in ESI†). The main differences observed are within the region of C![[double bond, length as m-dash]](https://www.rsc.org/images/entities/char_e001.gif) O vibrational stretching between 1750–1805 cm−1, and bending region ca. 900 cm−1 as seen in Fig. 6c and d respectively. There is a slight shift towards higher frequencies of the band assigned to DMC from 1756 cm−1 to 1760 cm−1 after water addition. Regarding the bands assigned to EC, there is a broadening of the band at 1777 cm−1 and a decrease in the relative intensity of the peak at 1805 cm−1 and peak shape at 900 cm−1. These changes could be tentatively associated to the coordination of the water molecule to C
O vibrational stretching between 1750–1805 cm−1, and bending region ca. 900 cm−1 as seen in Fig. 6c and d respectively. There is a slight shift towards higher frequencies of the band assigned to DMC from 1756 cm−1 to 1760 cm−1 after water addition. Regarding the bands assigned to EC, there is a broadening of the band at 1777 cm−1 and a decrease in the relative intensity of the peak at 1805 cm−1 and peak shape at 900 cm−1. These changes could be tentatively associated to the coordination of the water molecule to C![[double bond, length as m-dash]](https://www.rsc.org/images/entities/char_e001.gif) O carbonate group of the solvent via hydrogen bonds. In the spectra of DMC and EC mixture in the absence of water contamination the relative intensity is similar for the peaks related to each solvent as seen in Fig. S10 (in ESI†). There were no additional peaks after water addition as in the case of LiPF6 (Fig. 4).
O carbonate group of the solvent via hydrogen bonds. In the spectra of DMC and EC mixture in the absence of water contamination the relative intensity is similar for the peaks related to each solvent as seen in Fig. S10 (in ESI†). There were no additional peaks after water addition as in the case of LiPF6 (Fig. 4).
It has been reported that EC hydrolyses in the presence of water, with the main hydrolysis products being CO2 and ethylene glycol.42 The spectra were examined in order to ascertain if these products were present. Band assigned to the symmetric stretching of CO2 is expected at 1388 cm−1 and ethylene glycol spectrum has no bands within 1750–1803 cm−1 region, in which the main spectral changes were observed.43,44 Thereby, these compounds are not observed in Kerr gated spectra. In addition, it has been reported that hydrolysis of EC occurs at temperatures above 40 °C in the absence of catalytically active OH−,42 and the electrolyte is stable at room temperature, becoming the hydrolysis more important with temperature.9,42 In the present work, measurements were carried out at room temperature without the presence of any catalytic surface (i.e., electrode surface); therefore, the spectroscopic changes observed are not due to hydrolysis of electrolyte components.
Spectroscopic analysis of subtle changes in peak shape associated with changes to solvent–ion interactions would be impossible without the use of Kerr gated Raman and this result highlights the potential to carry out a series of systematic and quantifiable experiments to understanding electrolyte ageing for practical battery electrolyte conditions. Furthermore, the data highlights that the yet undetectable species responsible for fluorescence is present in the fresh electrolyte and thereby its initial role and relevance in Li-ion battery chemistry remains an open question. Interestingly the concentration of fluorescent species did not increase significantly within the confines of the initial ageing experiments as the fluorescence background signal was not observed to increase at collection at 10 ps between fresh and aged electrolytes Fig. S11 (in ESI†).
The sensitivity of the Raman spectrometer depends on the cross-section and the scattering properties of the materials. The presence of surface films containing fluorescent properties, even at very low concentrations (i.e., as previously explained due to the differences in the quantum yield of scattering and fluorescence processes), have a great influence in the spectrum. Overall the results for LiPF6 salt show that it is possible to detect decomposition compounds and a surface film on pristine LiPF6 particles by Kerr gated Raman spectroscopy. This would be otherwise impossible to observe due to the large background fluorescence emission that interferes with the scattering signal. The demonstration that the Kerr gated approach is effective in the suppression of background fluorescence emission in the spectra collected for the battery components (salt and electrolyte), highlights that this technique offers a great opportunity for detailed ex situ and operando Raman studies of electrode/electrolyte interfaces and monitoring degradation processes during Li-ion battery cycling and storage. Using a Kerr gate may offer a greater sensitivity in the detection of these trace compounds than that presently offered by FT-Raman at 1064 nm.
4. Conclusions
Fluorescence from standard Li-ion battery electrolyte components severely hamper the ability to examine them using visible wavelength Raman spectroscopy. Using IR excitation at 1064 nm it is possible to obtain Raman spectra above a diminished fluorescence background, but with a lower sensitivity. As an alternative method to removing the fluorescent background we have demonstrated with proof-of-concept experiments that the background fluorescence emission in the scattering spectrum of LiPF6 as salt and in the conventional battery electrolyte with EC/DMC solvents can be minimised or completely suppressed by Kerr gated Raman. Fluorescent species are formed during cycling of lithium ion batteries as a result of electrolyte decomposition due to the instability of the non-aqueous electrolytes and side reactions that occur at the electrode surface. The increase in the background fluorescence due to the presence of these components makes it harder to analyse data due to the spectroscopic overlap of Raman scattering and fluorescence. It has been demonstrated that Kerr gated Raman is an effective technique for the isolation of the scattering effect from the fluorescence enabling the investigation of the decomposition of battery electrolyte components and potentially identifying the source of the fluorescent background from trace organics left over from the recrystallization of LiPF6. In the spectra collected for water contaminated LiPF6 salt, not only was it possible to detect peaks within the region for those associated with PF6−, but also to POF3, a well-known degradation compound resulting for hydrolysis of LiPF6. Crucially this result highlights how Kerr gated Raman can be used to evaluate degradation reaction pathways as well as providing a method of quality control in detecting the surface speciation on LiPF6 salt samples before electrolyte preparation.Kerr gated measurements of 1 M LiPF6 in EC/DMC electrolyte showed bands associated with each of the components when aged in air and a broad band at 3500 cm−1 and a change in the relative intensity ratio of the bands related to C![[double bond, length as m-dash]](https://www.rsc.org/images/entities/char_e001.gif) O were observed due to the coordination of the water molecules after addition of water.
O were observed due to the coordination of the water molecules after addition of water.
The present study highlights Kerr gated Raman as a powerful technique that can be applied in the investigation of electrode/electrolyte interfaces and the speciation of the solid electrolyte interphase of battery systems in ex situ or operando studies, even in the presence of fluorescent species formed during cycling due to the suppression of the background emission.
Conflicts of interest
There are no conflicts to declare.Acknowledgements
Support via the STFC Battery Network Proof of Concept Grant is gratefully acknowledged in initiating this research and for the beam time on ULTRA to carry out Kerr gated experiments. We would like to thank to Dr Alexander Cowan for helpful discussions of fluorescence. We further recognise the support of ISCF Faraday Challenge project: “Towards a Comprehensive Understanding of Degradation Processes in EV Batteries” and the financial support is gratefully acknowledged grant number EP/S003053/1. This work was supported by the Assistant Secretary for Energy Efficiency and Renewable Energy, Vehicle Technologies Office, under the Advanced Battery Materials Research (BMR) Program, of the U.S. Department of Energy under Contract No. DE-AC02-05CH11231f.References
- E. C. Le Ru and P. G. Etchegoin, Principles of Surface Enhanced Raman Spectroscopy and Related Plasmonic Effects, Elsevier, 2009 Search PubMed.
- B. Valeur, Molecular Fluorescence: Principles and Applications, Wiley-VCH Verlag, 2001 Search PubMed.
- D. Wei, S. Chen and Q. Liu, Review of Fluorescence Suppression Techniques in Raman Spectroscopy, Appl. Spectrosc. Rev., 2015, 50, 387–406 CrossRef.
- J. Vetter, P. Novak, M. R. Wagner, C. Veit, K. C. Moller, J. O. Besenhard, M. Winter, M. Wohlfahrt-Mehrens, C. Vogler and A. Hammouche, Ageing mechanisms in lithium-ion batteries, J. Power Sources, 2005, 147, 269–281 CrossRef CAS.
- Q. Badey, G. Cherouvrier, Y. Reynier, J.-M. Duffault and S. Franger, Ageing forecast of lithium-ion batteries for electric and hybrid vehicles, Curr. Top. Electrochem., 2011, 16, 65–79 CAS.
- L. J. Hardwick, M. Marcinek, L. Beer, J. B. Kerr and R. Kostecki, An Investigation of the Effect of Graphite Degradation on Irreversible Capacity in Lithium-ion Cells, J. Electrochem. Soc., 2008, 155, A442 CrossRef CAS.
- L. M. Thompson, W. Stone, A. Eldesoky, N. K. Smith, C. R. M. McFarlane, J. S. Kim, M. B. Johnson, R. Petibon and J. R. Dahn, Quantifying Changes to the Electrolyte and Negative Electrode in Aged NMC532/Graphite Lithium-Ion Cells, J. Electrochem. Soc., 2018, 165, A2732–A2740 CrossRef CAS.
- C. Schultz, S. Vedder, B. Streipert, M. Winter and S. Nowak, Quantitative investigation of the decomposition of organic lithium ion battery electrolytes with LC-MS/MS, RSC Adv., 2017, 7, 27853–27862 RSC.
- S. Wiemers-Meyer, M. Winter and S. Nowak, Mechanistic insights into lithium ion battery electrolyte degradation-a quantitative NMR study, Phys. Chem. Chem. Phys., 2016, 18, 26595–26601 RSC.
- S. Wilken, P. Johansson and P. Jacobsson, Infrared spectroscopy of instantaneous decomposition products of LiPF6-based lithium battery electrolytes, Solid State Ionics, 2012, 225, 608–610 CrossRef CAS.
- S. Wilken, M. Treskow, J. Scheers, P. Johansson and P. Jacobsson, Initial stages of thermal decomposition of LiPF6-based lithium ion battery electrolytes by detailed Raman and NMR spectroscopy, RSC Adv., 2013, 3, 16359–16364 RSC.
- P. Radjenovic and L. J. Hardwick, Time-resolved SERS study of the oxygen reduction reaction in ionic liquid electrolytes for non-aqueous lithium–oxygen cells, Faraday Discuss., 2018, 206, 379–392 RSC.
- L. Cabo-Fernandez, F. Mueller, S. Passerini and L. J. Hardwick, In situ Raman spectroscopy of carbon-coated ZnFe2O4 anode material in Li-ion batteries – investigation of SEI growth, Chem. Commun., 2016, 52, 3970–3973 RSC.
- A. Jarry, S. Gottis, Y. S. Yu, J. Roque-Rosell, C. Kim, J. Cabana, J. Kerr and R. Kostecki, The Formation Mechanism of Fluorescent Metal Complexes at the LixNi0.5Mn1.5O4−δ/Carbonate Ester Electrolyte Interface, J. Am. Chem. Soc., 2015, 137, 3533–3539 CrossRef CAS PubMed.
- R. Kostecki, L. Norin, X. Song and F. McLarnon, Diagnostic Studies of Polyolefin Separators in High-Power Li-Ion Cells, J. Electrochem. Soc., 2004, 151, A522 CrossRef CAS.
- P. B. Stockwell, Introduction to Fluorescence Spectroscopy, Wiley-Interscience, New York, 2000 Search PubMed.
- Q. Cen, Y. He, M. Xu, J. Wang and Z. Wang, Wavelength dependent resonance Raman band intensity of broadband stimulated Raman spectroscopy of malachite green in ethanol, J. Chem. Phys., 2015, 142, 114201 CrossRef PubMed.
- A. Guéguen, D. Streich, M. He, M. Mendez, F. F. Chesneau, P. Novák and E. J. Berg, Decomposition of LiPF6 in High Energy Lithium-Ion Batteries Studied with Online Electrochemical Mass Spectrometry, J. Electrochem. Soc., 2016, 163, A1095–A1100 CrossRef.
- P. Matousek, M. Towrie and A. W. Parker, Fluorescence background suppression in Raman spectroscopy using combined Kerr gated and shifted excitation Raman difference techniques, J. Raman Spectrosc., 2002, 33, 238–242 CrossRef CAS.
- P. Matousek, M. Towrie, C. Ma, W. M. Kwok, D. Phillips, W. T. Toner and A. W. Parker, Fluorescence suppression in resonance Raman spectroscopy using a high-performance picosecond Kerr gate, J. Raman Spectrosc., 2001, 32, 983–988 CrossRef CAS.
- P. Matousek, M. Towrie and A. W. Parker, Efficient Rejection of Fluorescence from Raman Spectra Using Picosecond Kerr Gating, Appl. Spectrosc., 1999, 53, 1485–1489 CrossRef CAS.
- R. E. Littleford, P. Matousek, M. Towrie, A. W. Parker, G. Dent, R. J. Lacey and W. E. Smith, Raman spectroscopy of street samples of cocaine obtained using Kerr gated fluorescence rejection, Analyst, 2004, 129, 505–506 RSC.
- M. Gaft and L. Nagli, UV gated Raman spectroscopy for standoff detection of explosives, Opt. Mater., 2008, 30, 1739–1746 CrossRef CAS.
- M. D. Morris, A. E. Goodship, E. R. C. Draper, P. Matousek, M. Towrie and A. W. Parker, Kerr-gated picosecond Raman spectroscopy and Raman photon migration of equine bone tissue with 400 nm excitation, Proc. SPIE-Int. Soc. Opt. Eng., 2004, 5321, 164–169 CrossRef.
- I. V. Sazanovich, G. M. Greetham, B. C. Coles, I. P. Clark, P. Matousek, A. W. Parker and M. Towrie, Facility development update: the Kerr-gated Raman/ultrafast time-resolved fluorescence instrument, Cent. Laser Facil. Annu. Rep., 2014–2015, 44 Search PubMed.
- G. M. Greetham, P. Burgos, Q. Cao, I. A. N. P. Clark, P. S. Codd, R. C. Farrow, M. W. George, P. Matousek, A. W. Parker, M. R. Pollard, A. Robinson, Z. Xin and M. Towrie, ULTRA: A Unique Instrument for Time-Resolved Spectroscopy, Appl. Spectrosc., 2010, 64, 1311–1319 CrossRef CAS PubMed.
- P. B. Balbuena and Y. Wang, Lithium-Ion Batteries: Solid-Electrolyte Interphase, Imperial College Press, 2004 Search PubMed.
- S. K. Balasubramanian, L. Yang, L.-Y. L. Yung, C.-N. Ong, W.-Y. Ong and L. E. Yu, Characterization, purification, and stability of gold nanoparticles, Biomaterials, 2010, 31, 9023–9030 CrossRef CAS PubMed.
- D. Aurbach, B. Markovsky, I. Weissman, E. Levi and Y. Ein-Eli, On the correlation between surface chemistry and performance of graphite negative electrodes for Li ion batteries, Electrochim. Acta, 1999, 45, 67–86 CrossRef CAS.
- M. Stich, M. Göttlinger, M. Kurniawan, U. Schmidt and A. Bund, Hydrolysis of LiPF6 in Carbonate-Based Electrolytes for Lithium-Ion Batteries and in Aqueous Media, J. Phys. Chem. C, 2018, 122, 8836–8842 CrossRef CAS.
- L. D. Kock, M. D. S. Lekgoathi, P. L. Crouse and B. M. Vilakazi, Solid state vibrational spectroscopy of anhydrous lithium hexafluorophosphate (LiPF6), J. Mol. Struct., 2012, 1026, 145–149 CrossRef CAS.
- A. K. Prasad and M. Jain, Breakdown of Kasha's Rule in a Ubiquitous, Naturally Occurring, Wide Bandgap Aluminosilicate (Feldspar), Sci. Rep., 2018, 8, 810 CrossRef PubMed.
- G. Brancato, G. Signore, P. Neyroz, D. Polli, G. Cerullo, G. Abbandonato, L. Nucara, V. Barone, F. Beltram and R. Bizzarri, Dual fluorescence through Kasha's rule breaking: an unconventional photomechanism for intracellular probe design, J. Phys. Chem. B, 2015, 119, 6144–6154 CrossRef CAS PubMed.
- K. W. Schroder, A. G. Dylla, L. D. C. Bishop, E. R. Kamilar, J. Saunders, L. J. Webb and K. J. Stevenson, Effects of Solute–Solvent Hydrogen Bonding on Nonaqueous Electrolyte Structure, J. Phys. Chem. Lett., 2015, 6, 2888–2891 CrossRef CAS PubMed.
- D. Aurbach, M. Moshkovich, Y. Cohen and A. Schechter, The study of surface film formation on noble-metal electrodes in alkyl carbonates/Li salt solutions, using simultaneous in situ AFM, EQCM, FTIR, and EIS, Langmuir, 1999, 15, 2947–2960 CrossRef CAS.
- S. P. V. Nadimpalli, V. A. Sethuraman, S. Dalavi, B. Lucht, M. J. Chon, V. B. Shenoy and P. R. Guduru, Quantifying Capacity Loss due to Solid-Electrolyte-Interphase Layer Formation on Silicon Negative Electrodes in Lithium-ion Batteries, J. Power Sources, 2012, 215, 145–151 CrossRef CAS.
- B. S. Parimalam and B. L. Lucht, Reduction Reactions of Electrolyte Salts for Lithium Ion Batteries: LiPF6, LiBF4, LiDFOB, LiBOB, and LiTFSI, J. Electrochem. Soc., 2018, 165, A251–A255 CrossRef CAS.
- Y. Yu, P. Karayaylali, Y. Katayama, L. Giordano, M. Gauthier, F. Maglia, R. Jung, I. Lund and Y. Shao-horn, Coupled LiPF6 Decomposition and Carbonate Dehydrogenation Enhanced by Highly Covalent Metal Oxides in High-Energy Li-Ion Batteries, J. Phys. Chem. C, 2018, 122, 27368–27382 CrossRef CAS.
- J. Kamiya, T. Mitsui, M. Ooe and K. Sato, New Process of Synthesizing LiPF6 in Organic Solvent for Electrolyte, Meet. Abstr., 2015, MA2015-02, 136 Search PubMed.
- M. Feller, K. Lux and A. Kornath, Crystal Structure and Spectroscopic Investigations of POF3, Z. Anorg. Allg. Chem., 2014, 640, 53–56 CrossRef CAS.
- G. Socrates, Infrared and Raman Characteristic Group Frequencies Tables and Charts, Wiley, 2001 Search PubMed.
- M. Metzger, B. Strehle, S. Solchenbach and H. A. Gasteiger, Hydrolysis of Ethylene Carbonate with Water and Hydroxide under Battery Operating Conditions, J. Electrochem. Soc., 2016, 163, A1219–A1225 CrossRef CAS.
- K. Krishnan and R. S. Krishnan, Raman and Infrared spectra of ethylene glycol, Proc. Natl. Acad. Sci. U. S. A., 1966, LXIV, 111–123 Search PubMed.
- T. Azbej, M. J. Severs, B. G. Rusk and R. J. Bodnar, In situ quantitative analysis of individual H2O–CO2 fluid inclusions by laser Raman spectroscopy, Chem. Geol., 2007, 237, 255–263 CrossRef CAS.
Footnote |
| † Electronic supplementary information (ESI) available. See DOI: 10.1039/c9cp02430a |
| This journal is © the Owner Societies 2019 |

