 Open Access Article
One-step heat treatment to process semi-coke powders as an anode material with superior rate performance for Li-ion batteries
Ming Shi,
Yuanzhen Chen *,
Hua Wen and
Yongning Liu
State Key Laboratory for Mechanical Behavior of Materials, Xi'an Jiaotong University, Xi'an 710049, PR China. E-mail: cyz1984@xjtu.edu.cn
First published on 10th December 2018
Abstract
“Turning waste into wealth” and sustainable development are bright themes of modern society. Semi-coke is mainly made up of coal but contains around 15 wt% impurities. Nevertheless, semi-coke powders with sizes smaller than 3 mm generally cannot be used in metallurgical industries and are abandoned as solid waste, resulting in environmental contamination. Herein, boron doping followed by facile one-step heat treatment in the range of 2100 to 2700 °C has been carried out to process semi-coke powder waste. Thereby, the semi-coke powders can be graphitized to give sample carbon content values of over 95%. The best product so-prepared delivered reversible capacities of 351.5 mA h g−1 at 0.1C, and 322 mA h g−1 at 1C. Surprisingly, the capacity was maintained at 314.3 mA h g−1 after 300 cycles at 1C, giving a decline rate of only 2.4% and presenting superior rate performance.
1. Introduction
Graphite (mainly synthetic) is viewed as one of the mainstream anodic materials in commercial lithium ion (Li-ion) batteries,1–3 due to its relatively high capacity (theoretical capacity: 372 mA h g−1), long cycling life, and high coulombic efficiency. Graphitizable carbon materials, such as petroleum coke,4,5 meso-carbon microbeads (MCMBs)6,7 and mesophase pitch-based carbon fibers (MPCFs),8,9 are currently the main precursors for synthetic graphite. Hard carbon materials can also be used as Li-ion battery anodes.10,11 Recently, MCMBs have attracted the most attention in academia and commerce, because of their exceptional electrochemical performance.Usually, MCMBs are prepared by two routes: thermal condensation and emulsification. For thermal condensation, a compound of pitches needs to be heated to around 400 °C with stirring, and the temperature is maintained for a while before the compound is cooled to form the microbeads. Then the microbeads are extracted from the cooled compound using an organic solvent.12,13 In the emulsification method, the pitches are first pulverized into powders, then dissolved into a medium such as silicone oil and heated to 300–400 °C with stirring and ultrasonic vibration to form an emulsion. After cooling to room temperature, the microbeads are extracted with centrifugation.14 After this, a graphitization process, at above 2800 °C under an argon flow, is necessary to produce an anodic material for Li-ion batteries.6,15 All the processes are high cost and cause pollution in mass production.
In the graphitization of MCMBs,16,17 MPCFs18,19 and graphite,20 boron is often used as a doping element, which leads to the intermediate formation of carbides, and promotes graphitization at a lower temperature.21 It has been reported that boron can be added to graphite as a solid solution (max. 2.35 at%, about 2.12 wt%) or as a second phase, B4C, when the content is more than 2.35 at%.22 Because the substitutional boron in the carbon lattice acts as an electron acceptor, the carbon materials give a better electronic performance in lithiation and delithiation.16–20,23 Jang et al. synthesized carbon nanofiber/graphite compounds by chemical vapor deposition (CVD) and the anode material could deliver the discharge capacity of 359 mA h g−1 at 1C, keeping 90% of the initial capacity. However, the lower first coulombic efficiency (65.8%) limited the further application of these compounds to a large extent.24 Ohta et al. prepared natural graphite by coating carbon to perfect the electrochemical performance. The sample displayed a high capacity of 360 mA h g−1 but showed an irreversible capacity of 30 mA h g−1.25 Camean et al. studied the properties of different series of coal ash treated at 2700 °C; the results proved that man-made graphite can retain 310 mA h g−1 after 50 charge/discharge cycles at 0.1C, but the capacity cannot satisfy increasing demand.26
This paper aims to prepare negative materials for Li-ion batteries using semi-coke (SC) powders. The SC is fired from high quality Jura coal block produced from the Shenmu coal field of China, and is different from general coke. For example, the SC can be produced at a temperature of 600 °C, while the general coke is produced at ca. 1000 °C. Additionally, SC has a rich carbon content, high chemical activation and low ash content, and it has been widely use in metallurgy, chemistry, gas generation and other industries. Generally, the size of SC products is over 3 mm for convenience of transport and use, and the SC powders with sizes below 3 mm are abandoned as solid waste. The goal and value of this work is to turn waste into treasure.
In the industrial production of anode materials, the precursors (e.g. petroleum based cokes, coal based cokes, natural graphite) which have high carbon content (>90 wt%) are usually used to prepare commercial anodes, such as MCMBs, meso-carbon microfibers (MCMFs) and pure graphite. Usually, MCMBs and MCMFs obtain high rate performance and specific capacities of <340 mA h g−1.27–30 The SC powders contain more solid impurities such as SiO2, Al2O3 and CaO etc., and so their carbon content (ca. 85 wt%) is lower than that of the above mentioned precursors. Therefore, it is crucial to find a method to decrease the content of impurities and improve the graphitization of SC powders. In this work, a simple one-step heat treatment has been developed by which graphitization and impurity elimination can be simultaneously accomplished. The modified SC powder shows good discharge capacity and cycle performance. The preparation of the SC powders as a precursor for an anode material eliminates the production process required for MCMBs, which is beneficial for energy saving and cost saving, and does not cause chemical liquid pollution.
2. Experimental
2.1 Graphitization of raw SC
The raw SC powders were pre-processed by ball-milling for one hour with a ball:powder weight ratio of 4![[thin space (1/6-em)]](https://www.rsc.org/images/entities/char_2009.gif) :
:![[thin space (1/6-em)]](https://www.rsc.org/images/entities/char_2009.gif) 1. Then, the powders were treated with temperatures ranging from 2100 to 2700 °C for one hour under argon gas protection.
1. Then, the powders were treated with temperatures ranging from 2100 to 2700 °C for one hour under argon gas protection.
2.2 Electrochemical tests
The high-temperature treated SC powders, Super P, and PVDF (99%, Sinopharm) were mixed with N-methyl-2-pyrrolidone (NMP, 99%, Sinopharm) solvent at the weight ratio of 84![[thin space (1/6-em)]](https://www.rsc.org/images/entities/char_2009.gif) :
:![[thin space (1/6-em)]](https://www.rsc.org/images/entities/char_2009.gif) 6
6![[thin space (1/6-em)]](https://www.rsc.org/images/entities/char_2009.gif) :
:![[thin space (1/6-em)]](https://www.rsc.org/images/entities/char_2009.gif) 10. After mechanical mixing by magnetic stirring, the homogeneous slurry was coated onto a copper foil as the anode. After the completion of the above steps, the anode was dried at 80 °C in a vacuum for 24 hours.
10. After mechanical mixing by magnetic stirring, the homogeneous slurry was coated onto a copper foil as the anode. After the completion of the above steps, the anode was dried at 80 °C in a vacuum for 24 hours.
The coated copper foil was cut into a small disc with a diameter of 12 mm. The loading of the SC sample was in the range of 1.8–2 mg cm−2 (weighed using a METTLER TOLED ME55 balance with accuracy of 0.01 mg); the thickness of each electrode was about 25 μm. A CR2025 coin-type testing cell was assembled in an argon-filled glove box using a lithium tablet (Φ14 mm) as the cathode, an organic solvent of 1 M LiPF6 (EC![[thin space (1/6-em)]](https://www.rsc.org/images/entities/char_2009.gif) :
:![[thin space (1/6-em)]](https://www.rsc.org/images/entities/char_2009.gif) EMC
EMC![[thin space (1/6-em)]](https://www.rsc.org/images/entities/char_2009.gif) :
:![[thin space (1/6-em)]](https://www.rsc.org/images/entities/char_2009.gif) DMC, 1
DMC, 1![[thin space (1/6-em)]](https://www.rsc.org/images/entities/char_2009.gif) :
:![[thin space (1/6-em)]](https://www.rsc.org/images/entities/char_2009.gif) 1
1![[thin space (1/6-em)]](https://www.rsc.org/images/entities/char_2009.gif) :
:![[thin space (1/6-em)]](https://www.rsc.org/images/entities/char_2009.gif) 1, v/v) as the electrolyte (JinNiu Co., Ltd, China), and a porous polyolefin as a separator (Celgard 2400). The assembled cells were sealed with about 0.08 mL electrolyte per cell.
1, v/v) as the electrolyte (JinNiu Co., Ltd, China), and a porous polyolefin as a separator (Celgard 2400). The assembled cells were sealed with about 0.08 mL electrolyte per cell.
The assembled batteries were tested at current densities of 0.1 and 1C (1C = 372 mA g−1), in the voltage range from 0.01 to 2 V using a testing machine (BTS-5 V/5 mA, Neware Co., Ltd, China) at room temperature. The mass of the whole anodic material (SC, Super P and PVDF) was used to calculate the applied current. The calculation of capacity was based only on the mass of SC.
2.3 Characterization
The components and structure of the processed SC were examined using scanning electron microscopy (SEM, JEOL JEM-35C), transmission electron microscopy (TEM, JEM-F200) and X-ray diffraction (XRD, RIGAKU D/MAX-2400). The percentage contents of the samples were tested by inductively coupled plasma-atomic emission spectrometry (ICP-AES, iCAP 6300, Thermo Elemental). The Brunauer–Emmett–Teller (BET) equation was used to calculate surface areas.3. Results and discussion
3.1 Performance of raw SC
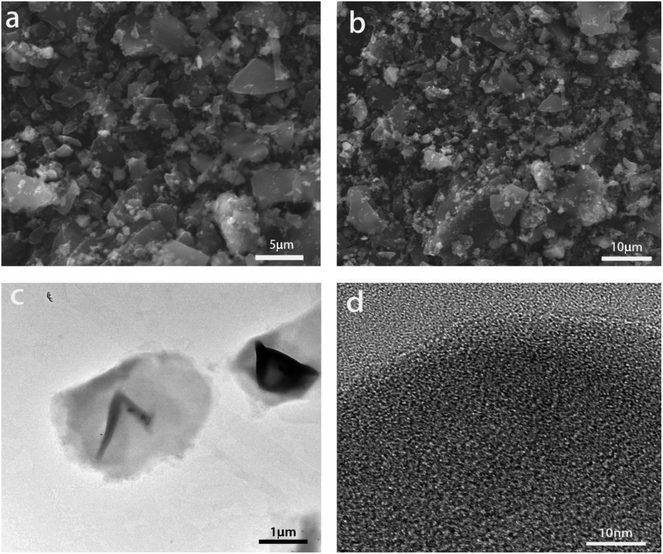
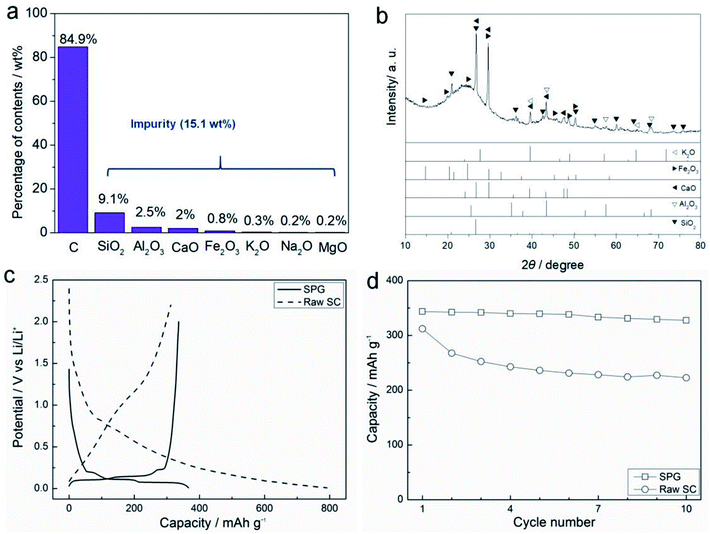
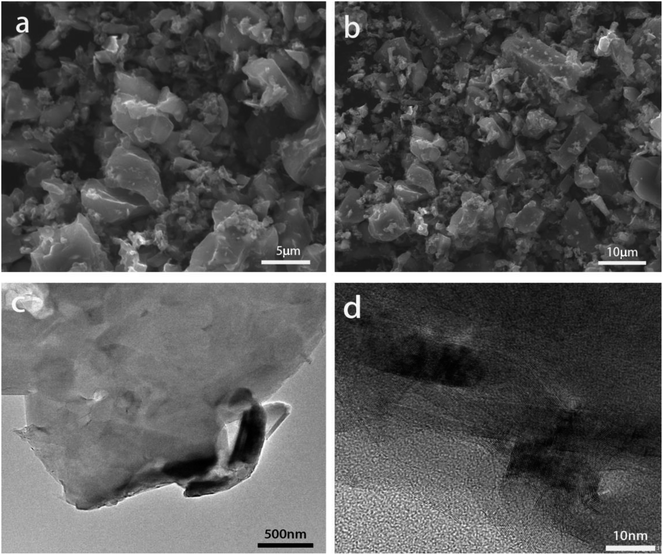
Fig. 1 gives SEM (a and b) and TEM (c and d) images of the pristine SC. It is apparent that the raw SC has a particle size of about 5 μm and many tiny granules, showing the irregular morphology. As shown in Fig. 1d, the SC is amorphous. The primary impurities in the raw SC are various oxides such as SiO2, Al2O3, CaO (Fig. 2a) and the total content of oxides is around 15.1 wt%, contrasting with the 99.99% carbon content of commercial graphite (CG). Fig. 2b shows the XRD pattern of the raw SC powders. There is no peak at 26.38° for the (002) plane of graphite, however, a bump appears in the range from 18 to 30°, which suggests that the raw SC is in an amorphous state. The characteristic peaks of the most abundant oxides in Fig. 2a occur in this curve too. The first charge and discharge curves of the raw SC and CG at the current density of 0.1C are shown in Fig. 2c. The discharge/charge capacities of CG are 366.7 and 343.6 mA h g−1 indicating a coulombic efficiency of 93.7%. Unlike the CG, the raw SC has no plateau in its discharge or charge processes. The lithiation capacity is 791.9 mA h g−1, while the delithiation capacity is only 312.0 mA h g−1 giving a coulombic efficiency of 39.4%, which is lower than that of CG. The curves of the raw SC for both the discharge and charge processes have a significant slope, which is caused by the amorphous structure. Fig. 2d shows the cycle performance of the raw SC and CG. The capacity retention of the raw SC is 71.4% after 10 cycles, which is much lower than that of CG (95.3%). The electrochemical performance indicates that the raw SC is not appropriate for use as an electrode material for a Li-ion battery.3.2 Heat treatment
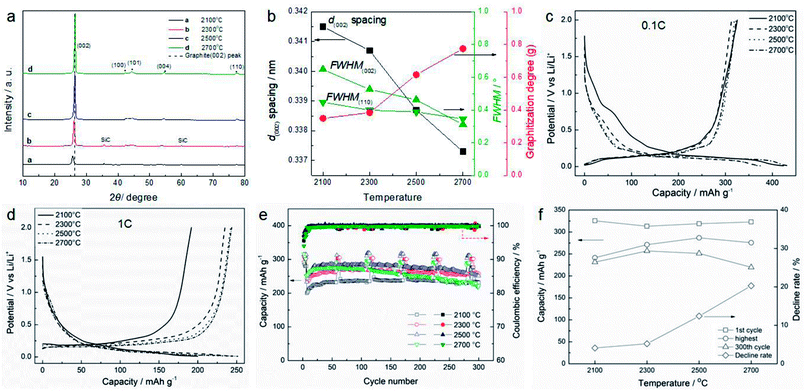
As analyzed above, the graphitization degree of a sample exerts a significant effect on the electrochemical performance of the anode material. Therefore, it is necessary to study the influence of the heat treatment temperature on the graphitization degree and electrochemical performance of the SC samples. In this part, different temperatures from 2100 to 2700 °C were used to process the raw SC. Fig. 3a shows the XRD patterns of the samples treated at different temperatures. With increasing temperature, the (002), (100), (101), (004) and (110) peaks of graphite gradually become obvious, especially that of (002), which indicates that the temperature greatly influences the graphitization. The peaks at 36.65° in the curves of 2100 and 2300 °C indicate that there is a small amount of SiC. However, no SiC peak appears when the temperature is over 2500 °C, when SiC sublimates.31 Fig. 3b shows the graphitization parameters, such as the spacing of the (002) crystal plane (d(002)), the full width at half maximum (FWHM) of the (002) and (110) crystal planes (FWHM(002) and FWHM(110)), and the graphitization degree (g) which is calculated by the classic Maire and Mérings equation:6,13 . Obviously, the d(002) spacing, FWHM(002) and FWHM(110) all decrease and g increases with rising temperature, indicating that the sample obtains a high graphitization degree at high temperature. The first discharge/charge cycle curves of the samples at the current density of 0.1C are shown in Fig. 3c. It is found that the specific capacity of the sample treated at 2100 °C is lower than that of the other samples in the plateau region (0–0.25 V), because that sample is more amorphous than the other materials. The charge capacity increases slightly with increasing temperature, and it peaks at 322.8 mA h g−1 with the temperature of 2700 °C. The highest coulombic efficiency is 85.8% at 2500 °C, while the charge capacity is 318.8 mA h g−1. As seen from Fig. 3d, the difference in charge capacity seems more obvious at the high current density of 1C, and the capacity increases with rising temperature. Fig. 2e shows the cycle performance of all samples. The results show that the sample treated at 2300 °C displays the best cycle performance. After 300 cycles with a current density of 1C, the sample still maintains a charge capacity of 256.8 mA h g−1, with the coulombic efficiency of 99.7%. The capacity decline rate (300th cycle capacity/the highest capacity) is only 5.2%. All the electrochemical properties are summarized in Fig. 2f. According to the above analysis, the graphitization degree increases with rising temperature. However, there is no enhancement in the corresponding cycle properties. In this study, a new parameter f = capacity (300th cycle)/temperature was defined to describe the energy efficiency. As shown in Table 1, parameter f reaches its peak at a temperature of 2300 °C, which indicates that this is the best temperature for heat treatment. It is suggested that at this temperature, an appropriate ratio of amorphous and graphitic structures exists, which gives the best performance.
| a f = capacity/temperature. | ||||
|---|---|---|---|---|
| Temperature (°C) | 2100 | 2300 | 2500 | 2700 |
| f (mA h g−1 °C−1) | 0.110 | 0.112 | 0.100 | 0.081 |
3.3 The effect of boron doping
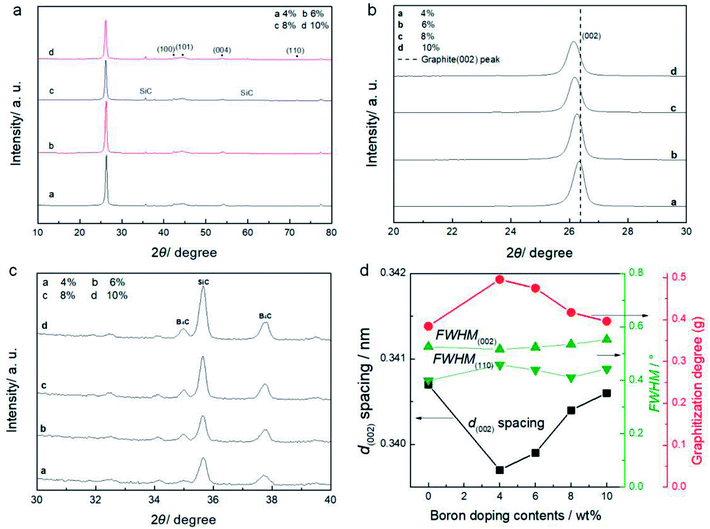
In this section, boron powder (99%, Sinopharm) was mixed using an agate mortar with the SC at pre-set weight ratios after ball-milling, and the mixed powder was then heat treated using the one-step process at 2300 °C. The effect of different boron doping levels on structure and electrochemical performance was examined through XRD and electrochemical tests. The XRD patterns of the processed SC powders with various amounts of added boron are shown in Fig. 4. A clear peak near 26.38° in all the patterns in Fig. 4a shows that the samples achieve a good graphitization degree following the treatment. The left shift of the peaks from 26.38°, shown in Fig. 4b, indicates that the (002) plane of the graphitized SC has an obvious distortion or intercalation of alloy elements between the (002) planes when compared with that of graphite. With increasing levels of boron doping, the peak deviation from 26.38° increases. Because the amount of boron doping is larger than 2.12 wt% in all samples, the excess boron in the graphite is in the form of B4C,21 which seems to make the interlayer space larger. With increasing boron doping content, the B4C peaks increase as shown in the patterns in Fig. 4c. The calculated crystal parameters of the samples are summarized in Fig. 4d. With increasing levels of boron doping, the interlayer spaces (d002), FWHM(002) and FWHM(110) all increase, and g decreases, indicating that the sample with the highest boron doping level has the lowest graphitization degree of the doped samples. In order to test the catalytic action of boron doping, the graphitization degree of the samples was calculated. The processed SC without boron doping has a graphitization degree of 37.8% while the 4% boron doped sample could reach 49%.Table 2 gives the ash content of samples before and after heat treatment. It can be seen that the sample treated at 2300 °C has a low content of metallic impurities. During the heating process, plenty of metal impurities gradually melt and vaporize. For example, Al2O3 has a fusing point of 2050 °C, so when the temperature reaches nearly 2000 °C, the compound starts to melt and relatively pure graphite is obtained; this can be used as an anode material for Li-ion batteries and delivers superior electrochemical performance.
| Sample | Content percentage/wt% | |||||||
|---|---|---|---|---|---|---|---|---|
| B | SiO2 | Al2O3 | CaO | Fe2O3 | K2O | Na2O | MgO | |
| Before treatment (semi-coke) | <0.1 | 9.1 | 2.5 | 2 | 0.8 | 0.3 | 0.2 | 0.2 |
| After treatment (graphite) | <0.1 | 3.1 | <0.1 | 0.2 | <0.1 | 0.02 | 0.04 | <0.1 |
The morphology of a material also has an effect on its performance. Fig. 5 gives SEM (a and b) and TEM (c and d) images of the SC after being heat treated at 2300 °C. From the photos, it is apparent that the processed SC has a particle size of about 5 μm, and shows a more regular morphology than that of the raw SC. Also, we can see the lattice fringe in Fig. 5d, which indicates a high crystallinity. It suggests that treatment at the appropriate temperature has a positive effect on the crystallinity of the material. Fig. 6 presents the N2 adsorption/desorption profiles of the raw SC, the SC treated at 2300 °C and the boron doped SC treated at 2300 °C; the specific surface areas are 9.9897, 5.0377 and 2.2966 m2 g−1 corresponding to pore volumes of 0.045854, 0.024377 and 0.008662 cm3 g−1, respectively. Obviously, the specific surface areas of the samples change a lot with heat treatment, which may be attributed to the graphitization of the SC. The materials are promising for use as anodes in Li-ion batteries and show superior electrochemical properties. However, as a non-negligible character of electrode materials, tap densities are of great significance for the cells. A bigger tap density may result in a larger specific energy and higher specific capacity. Experimentally, the tap densities of the samples are shown to be 0.907, 0.867 and 0.918 g cm−3. The density makes a great contribution to the excellent performance of batteries.
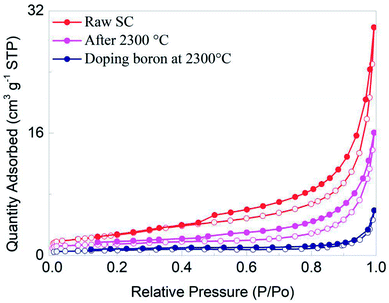 | ||
| Fig. 6 The N2 adsorption/desorption profiles of raw SC, SC treated at 2300 °C, and boron doped SC treated at 2300 °C. | ||
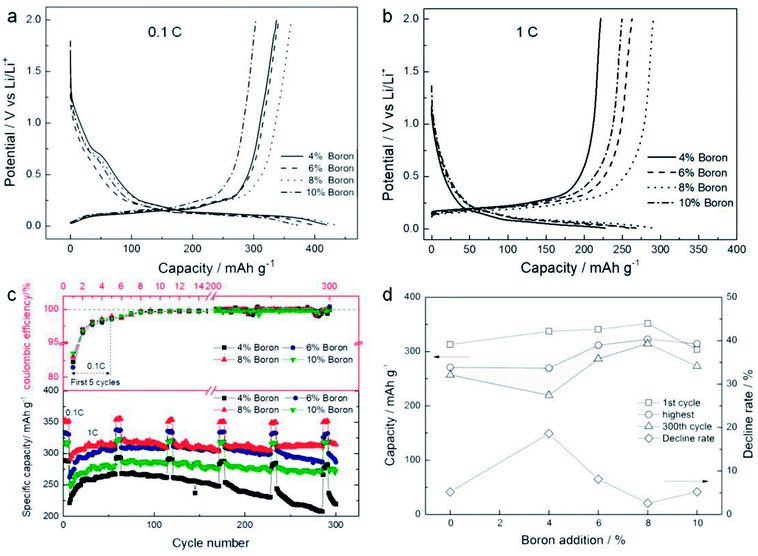
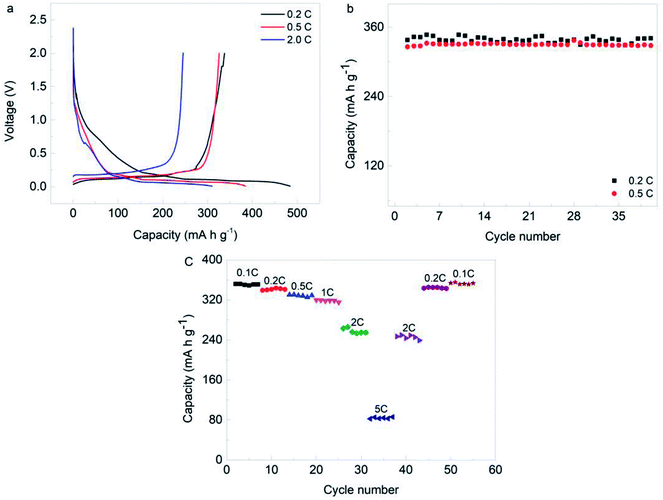
Fig. 7a displays the first discharge/charge cycle curves of all boron doped samples at the current density of 0.1C, and all samples show obvious plateaus in the range 0–0.25 V. The charge capacities, which represent the delithiation quantities, are all above 300 mA h g−1. The sample with boron doping of 8 wt% has the best capacity of 351.5 mA h g−1, while its coulombic efficiency is 83.2%. In addition, the sample with boron doping of 8 wt% shows the largest capacity at 1C, as shown in Fig. 7b. Fig. 7c shows the cycle performances of all samples. It is found that the first coulombic efficiencies of all samples are around 83% at 0.1C, and the second coulombic efficiencies increase to ∼96%. In the following cycles, the coulombic efficiencies of all samples are close to 100% at the current density of 1C. Additionally, the sample with boron doping of 8 wt% shows the largest delithiation capacity of 314.4 mA h g−1 after 300 cycles at 1C. Some important data are summarized in Fig. 7d. Compared with the sample without boron doping, the delithiation capacity is progressively enhanced for the first cycle with increasing levels of boron doping up to 8 wt%. Additionally, the sample with 8 wt% boron doping shows the highest capacity of 322 mA h g−1 and maintains the highest capacity of 314.4 mA h g−1 after 300 cycles, resulting in the lowest decline rate of 2.4%. Therefore, it seems that a larger interlayer space is good for lithiation/delithiation reactions in the appropriate graphitization degree range. Fig. 8a gives the initial charge/discharge curves of the processed SC anode materials which were measured between 0.01 V and 2.0 V at a current density of 0.2C, 0.5C and 2.0C. As shown, the discharge capacity is 337.8 mA h g−1 for 0.2C and 325.8 mA h g−1 for 0.5C, and even when the current density reaches 2C, the capacity is still maintained at 245.1 mA h g−1, displaying the excellent rate properties of the processed SC. Remarkably, no obvious decline in capacity is observed after 40 cycles at either of the current densities in Fig. 8b. Fig. 8c shows the rate and cycling performance of the sample at different current densities. It is seen that the capacity can recover to its initial performance level even after charging/discharging at a high rate of 5C. All of these results indicate superior electrochemical performance.
Fig. 9 illustrates the EIS curves of the raw SC, the SC treated at 2300 °C and boron doped SC treated at 2300 °C. It can be obviously seen that the impedance spectra contain an intercept at high frequency, a depressed semicircle at medium frequency and a straight line at low frequency. As we know, the high frequency intercept at the real axis represents the ohmic resistance (Re) of the cell, which mainly results from the electrode and electrolyte. Also, the semicircle in the medium frequency range is ascribed to the interface or charge-transfer resistance (Rct) at the anode-electrolyte interface. The straight line at low frequency corresponds to Warburg impedance, related to the diffusion of Li ions in graphite. A comparison of the curves further confirms the enhancement of electrochemical performance after processing the raw SC. The Rct of the boron doped sample displays the smallest semicircle diameter within the medium frequency range among all of the materials, revealing that it gives the fastest Li+ transfers, which is conducive to the dynamics of an electrochemical reaction.
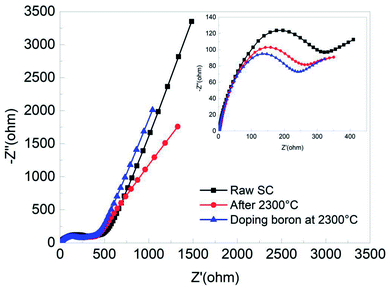 | ||
| Fig. 9 EIS curves of the three electrodes measured in the frequency range from 105 Hz to 10−2 Hz at open circuit voltage. | ||
3.4 Impurity elimination
In this part, a pre-process for impurity elimination was employed. After ball-milling, the raw SC powder was mixed with NaOH (99.5%, Sinopharm), which can react with oxide impurities, at the weight ratio of 1![[thin space (1/6-em)]](https://www.rsc.org/images/entities/char_2009.gif) :
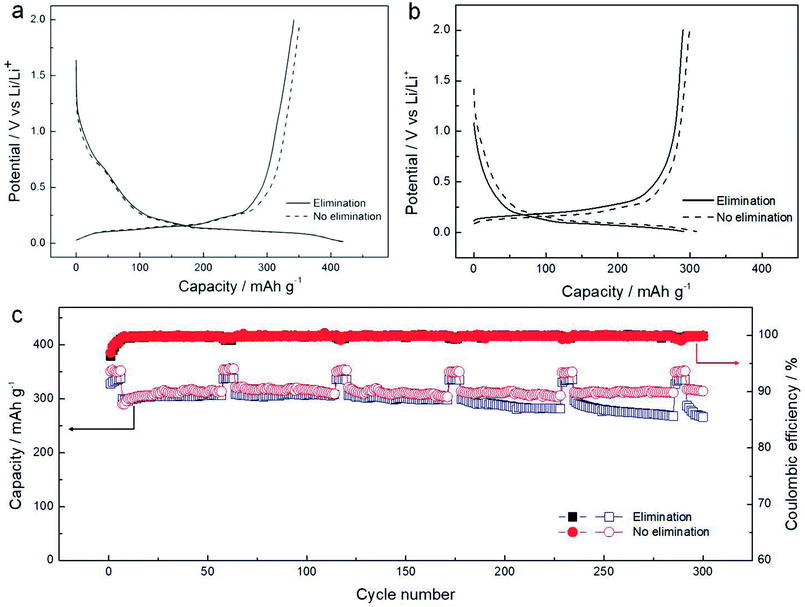
:![[thin space (1/6-em)]](https://www.rsc.org/images/entities/char_2009.gif) 1. Then, the mixed sample was treated at 850 °C under argon gas protection for one hour. After the heat treatment, the powder was put into de-ionized water and stirred for two hours at 80 °C. The treated powder was filtered and washed with de-ionized water to pH-neutral. Lastly, the washed powder was dried at 80 °C in vacuum for 24 hours. After the treatment, the impurities were reduced by around 9 wt%. The dried powder was mixed with 8 wt% boron, and treated at 2300 °C for one hour. Table 3 shows the resistivity of the treated samples, which gives supporting evidence for the XRD patterns. Because of the high degree of graphitization, the CG has the lowest resistivity of 0.0011 Ω cm. The raw SC has the largest resistivity of 0.094 Ω cm. The processed SC, without impurity elimination, has a larger resistivity than the one treated for impurity elimination. This means that the elimination step is effective, which is consistent with the content percentage results given by ICP-AES, as shown in Table 4.
1. Then, the mixed sample was treated at 850 °C under argon gas protection for one hour. After the heat treatment, the powder was put into de-ionized water and stirred for two hours at 80 °C. The treated powder was filtered and washed with de-ionized water to pH-neutral. Lastly, the washed powder was dried at 80 °C in vacuum for 24 hours. After the treatment, the impurities were reduced by around 9 wt%. The dried powder was mixed with 8 wt% boron, and treated at 2300 °C for one hour. Table 3 shows the resistivity of the treated samples, which gives supporting evidence for the XRD patterns. Because of the high degree of graphitization, the CG has the lowest resistivity of 0.0011 Ω cm. The raw SC has the largest resistivity of 0.094 Ω cm. The processed SC, without impurity elimination, has a larger resistivity than the one treated for impurity elimination. This means that the elimination step is effective, which is consistent with the content percentage results given by ICP-AES, as shown in Table 4.
| Sample | Content percentage/wt% | |||||||
|---|---|---|---|---|---|---|---|---|
| B | Si | Al | Ca | Fe | K | Na | Mg | |
| SC (calculated from Fig. 1a) | — | 4.25 | 1.32 | 1.43 | 0.56 | 0.25 | 0.15 | 0.12 |
| Without elimination | 0.4 | 4.2 | 0.03 | 0.06 | 0.1 | 0.03 | 0.03 | 0.05 |
| With elimination | 0.45 | 2.8 | 0.01 | 0.06 | 0.06 | 0.03 | 0.03 | 0.05 |
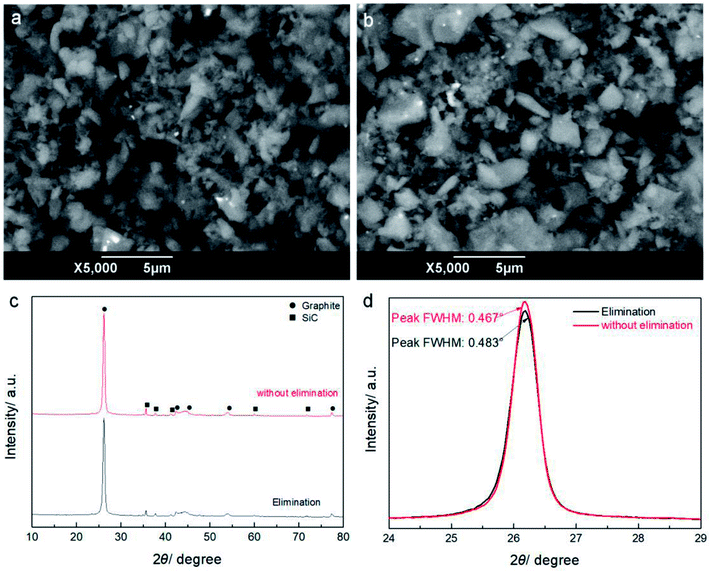
Compared with primary SC, the samples without the impurity elimination process show an obvious loss of metal elements, but little change for Si. Additionally, the samples with and without the impurity elimination process show some differences in the percentage content of Si and Al, because the elimination process mainly aims to remove SiO2 and Al2O3. Most of the other light metals have obviously decreased in percentage content because of their evaporation at high temperature. In addition, there are some Fe residuals which show as white dots in Fig. 10a and b, but the percentage content is decreased to a small value. The XRD patterns in Fig. 10c show that the structures of the samples with and without the elimination process are mainly graphitic and there is little SiC in either sample. The calculated g values are 0.42 and 0.45, and the FWHM values are 0.467° and 0.483° for the samples without and with impurity elimination respectively, displaying small differences in graphitization degree, which should be attributed to the graphitization promotion effect of some elements, such as Si, Al and Fe.
Fig. 11a shows the discharge/charge curves of the samples with and without impurity elimination at 0.1C, which are similar to each other. The sample with impurity elimination has a lower delithiation capacity of 342.0 mA h g−1, compared with the one without elimination (351.5 mA h g−1). The same trend is found at the current density of 1C, as shown in Fig. 11b. The cycle performances are shown in Fig. 11c. The sample with impurity elimination shows the highest specific capacity of 310 mA h g−1 during cycling and the final dilithiation capacity is 266.3 mA h g−1 at the 300th cycle, corresponding to a decline rate of 14.1%. The sample without the impurity elimination process shows the highest specific capacity of 322 mA h g−1 during cycling and maintains a final dilithiation capacity of 314.4 mA h g−1, displaying a low decline rate of 2.4%. This indicates that the process of impurity elimination is not necessary. The heat treatment without impurity elimination can reduce chemical pollution, shorten the production period and reduce the cost.
4. Conclusions
Raw SC powders have an amorphous structure and contain 15 wt% impurities. One-step heat treatment at 2100–2700 °C can eliminate most impurities and simultaneously graphitize the SC powders. Additionally, boron doping can promote the graphitization of SC and micro-quantities of impurities. Comparison experiments show that the SC sample with 8 wt% boron doping and treated at 2300 °C displays the best electrochemical performance as an anode material. Its delithiation capacity reaches 351.5 mA h g−1 at 0.1C and 322 mA h g−1 at 1C, while the capacity is maintained at 314.3 mA h g−1 after 300 cycles at a 1C current with a decline rate of 2.4%.Conflicts of interest
There are no conflicts to declare.Acknowledgements
This work was supported by the National Natural Science Foundation of China (No. 51602246) and the Natural Science Foundation Research Project of Shaanxi Province (No. 2018JQ2002).References
- M. Endo, C. Kim, K. Nishimura, T. Fujino and K. Miyashita, Recent development of carbon materials for Li ion batteries, Carbon, 2000, 38, 183–197 CrossRef CAS.
- M. Noel and V. Suryanarayanan, Role of carbon host lattices in Li-ion intercalation/de-intercalation processes, J. Power Sources, 2002, 111, 193–209 CrossRef CAS.
- M. Wakihara, Recent developments in lithium ion batteries, Mater. Sci. Eng., R, 2001, 33, 109–134 CrossRef.
- T. D. Tran, L. M. Spellman, W. M. Goldberger, X. Song and K. Kinoshita, Lithium intercalation in heat-treated petroleum cokes, J. Power Sources, 1997, 68, 106–109 CrossRef CAS.
- R. Alcantara, P. Lavela, G. F. Ortiz, J. L. Tirado, R. Menendez, R. Santamaria and J. M. Jimenez-Mateos, Electrochemical, textural and microstructural effects of mechanical grinding on graphitized petroleum coke for lithium and sodium batteries, Carbon, 2003, 41, 3003–3013 CrossRef CAS.
- Y. C. Chang, H. J. Sohn, C. H. Ku, Y. G. Wang, Y. Korai and I. Mochida, Anodic performances of mesocarbon microbeads (MCMB) prepared from synthetic naphthalene isotropic pitch, Carbon, 1999, 37, 1285–1297 CrossRef CAS.
- R. Alcantara, F. J. F. Madrigal, P. Lavela, J. L. Tirado, J. M. J. Mateos, C. G. de Salazar, R. Stoyanova and E. Zhecheva, Characterisation of mesocarbon microbeads (MCMB) as active electrode material in lithium and sodium cells, Carbon, 2000, 38, 1031–1041 CrossRef CAS.
- N. Imanishi, H. Kashiwagi, T. Ichikawa, Y. Takeda, O. Yamamoto and M. Inagaki, Charge-Discharge Characteristics of Mesophase-Pitch-Based Carbon-Fibers for Lithium Cells, J. Electrochem. Soc., 1993, 140, 315–320 CrossRef CAS.
- N. Takami, A. Satoh, M. Hara and T. Ohsaki, Rechargeable Lithium-Ion Cells Using Graphitized Mesophase-Pitch-Based Carbon-Fiber Anodes, J. Electrochem. Soc., 1995, 142, 2564–2571 CrossRef CAS.
- E. Buiel, A. E. George and J. R. Dahn, On the Reduction of Lithium Insertion Capacity in Hard-Carbon Anode Materials with Increasing Heat-Treatment Temperature, J. Electrochem. Soc., 1998, 145, 2252–2257 CrossRef CAS.
- E. Buiel and J. R. Dahn, Li-insertion in hard carbon anode materials for Li-ion batteries, Electrochim. Acta, 1999, 45, 121–130 CrossRef CAS.
- Y. Yamada, T. Imamura, H. Kakiyama, H. Honda, S. Oi and K. Fukuda, Characteristics of Meso-Carbon Microbeads Separated from Pitch, Carbon, 1974, 12, 307–319 CrossRef CAS.
- W. Kim, K. Chung, C. Lee, J. Cho, Y. Sung and Y. Choi, Studies on heat-treated MPCF anodes in Li ion batteries, Microchem. J., 2002, 72, 185–192 CrossRef CAS.
- M. Kodama, T. Fujirua, K. Esumi, K. Meguro and H. Honda, Preparation of Meso-Carbon Microbeads with a Narrow Size Distribution, Carbon, 1988, 26, 595–598 CrossRef CAS.
- Y. G. Wang, Y. C. Chang, S. Ishida, Y. Korai and I. Mochida, Stabilization and carbonization properties of mesocarbon microbeads (MCMB) prepared from a synthetic naphthalene isotropic pitch, Carbon, 1999, 37, 969–976 CrossRef CAS.
- M. H. Chen, G. T. Wu, G. M. Zhu, J. K. You and Z. G. Lin, Characterization and electrochemical investigation of boron-doped mesocarbon microbead anode materials for lithium ion batteries, J. Solid State Electrochem., 2002, 6, 420–427 CrossRef CAS.
- C. Kim, K. Nishimura, T. Fujino, K. Miyashita, M. Endo and M. S. Dresselhaus, Structure and anode performance of pristine and B-doped graphites for Li-ion batteries, Mol. Cryst. Liq. Cryst., 2000, 340, 455–460 CrossRef CAS.
- Y. Nishimura, T. Takahashi, T. Tamaki, M. Endo and M. S. Dresselhaus, Anode performance of B-doped mesophase pitch-based carbon fibers in lithium ion secondary batteries, Carbon, 1996, 34, 1163 CrossRef.
- M. Endo, C. Kim, T. Karaki, Y. Nishimura, M. J. Matthews, S. D. M. Brown and M. S. Dresselhaus, Anode performance of a Li ion battery based on graphitized and B-doped milled mesophase pitch-based carbon fibers, Carbon, 1999, 37, 561–568 CrossRef CAS.
- V. A. Nalimova, C. Bindra and J. E. Fischer, Enhanced metastability of high-density Li intercalation in boron-doped graphite, Solid State Commun., 1996, 97, 583–585 CrossRef CAS.
- W. Weisweiler, N. Subramanian and B. Terwiesch, Catalytic influence of metal melts on the graphitization of monolithic glasslike carbon, Carbon, 1971, 9, 755–761 CrossRef CAS.
- C. E. Lowell, Solid Solution of Boron in Graphite, J. Am. Ceram. Soc., 1967, 50, 142–144 CrossRef CAS.
- E. Frackowiak, K. Kierzek, G. Lota and J. Machnikowski, Lithium insertion/deinsertion of boron doped graphitic carbons synthesized by different procedure, J. Phys. Chem. Solids, 2008, 69, 1179–1181 CrossRef CAS.
- S. M. Jang, J. Miyawaki and M. Tsuji, et al., Preparation of a carbon nanofiber/natural graphite composite and an evaluation of its electrochemical properties as an anode material for a Li-ion battery, New Res. Carbon Mater., 2010, 25, 89–96 CrossRef CAS.
- N. Ohta, K. Nagaoka and K. Hoshi, et al., Carbon-coated graphite for anode of lithium-ion rechargeable batteries: Graphite substrates of carbon coating, J. Power Sources, 2009, 194, 985–990 CrossRef CAS.
- I. Camean and A. B. Garcia, Graphite materials prepared by HTT of unburned carbon from coal combustion fly ashes: Performance as anodes in lithium-ion batteries, J. Power Sources, 2011, 196, 4816–4820 CrossRef CAS.
- A. Satoh, N. Takami and T. Ohsaki, Electrochemical Intercalation of Lithium into Graphitized Carbons, Solid State Ionics, 1995, 80, 291–298 CrossRef CAS.
- S. Hossain, Y. K. Kim, Y. Saleh and R. Loutfy, Comparative studies of MCMB and C-C composite as anodes for lithium-ion battery systems, J. Power Sources, 2003, 114, 264–276 CrossRef CAS.
- J. Yao, G. X. Wang, J.-h. Ahn, H. K. Liu and S. X. Dou, Electrochemical studies of graphitized mesocarbon microbeads as an anode in lithium-ion cells, J. Power Sources, 2003, 114, 292–297 CrossRef CAS.
- N. Imanishi, Y. Ono, K. Hanai, R. Uchiyama, Y. Liu, A. Hirano, Y. Takeda and O. Yamamoto, Surface-modified meso-carbon microbeads anode for dry polymer lithium-ion batteries, J. Power Sources, 2008, 178, 744–750 CrossRef CAS.
- J. A. Lely, Darstellung von Einkristallen von Silicium carbid und Beherrschung von Art und Menge der eingebautem Verunreinigungen, Ber. Dtsch. Keram. Ges., 1955, 32, 229–231 Search PubMed.
- X. D. Yang, Y. N. Liu, S. Li, X. Z. Wei, L. Wang and Y. Z. Chen, A direct borohydride fuel cell with a polymer fiber membrane and non-noble metal catalysts, Sci. Rep., 2012, 2, 567 CrossRef.
| This journal is © The Royal Society of Chemistry 2018 |

