
 Open Access Article
 This Open Access Article is licensed under a Creative Commons Attribution-Non Commercial 3.0 Unported Licence
Dendritic nanostructured FeS2-based high stability and capacity Li-ion cathodes†
Zhenxing Yuabc,
Junjie Wanga,
Na Zhangde,
Jungwoo Shina,
Qiye Zhenga,
Subing Qua,
Xiaoqing Hea,
Angus Rocketta,
Hong Yang e and
Paul V. Braun*a
e and
Paul V. Braun*a
aDepartment of Materials Science and Engineering, Materials Research Laboratory, Beckman Institute for Advanced Science and Technology, University of Illinois at Urbana−Champaign, Urbana, Illinois 61801, USA. E-mail: pbraun@illinois.edu
bBGRIMM Technology Group, Beijing 100160, China
cBeijing Easpring Materials Technology CO., LTD, Beijing 100160, China
dBeijing Aerospace Propulsion Institute, Beijing 100076, China
eDepartment of Chemical and Biomolecular Engineering, University of Illinois at Urbana−Champaign, Urbana, Illinois 61801, USA
First published on 19th November 2018
Abstract
Here we show that dendritic architectures are attractive as the basis of hierarchically structured battery electrodes. Dendritically structured FeS2, synthesized via simple thermal sulfidation of electrodeposited dendritic α-Fe, was formed into an electrode and cycled vs. lithium. The reversible capacities of the dendritic FeS2 cathode were 560 mA h g−1 at 0.5C and 533 mA h g−1 at 1.0C after 50 cycles over 0.7–3.0 V. Over 0.7–2.4 V, where the electrode is more stable, the reversible capacities are 348 mA h g−1 at 0.2C and 179 mA h g−1 at 1.0C after 150 cycles. The good cycling performance and high specific capacities of the dendritic FeS2 cathodes are attributed to the ability of a dendritic structure to provide good ion and electron conducting pathways, and a large surface area. Importantly, the dendritic structure appears capable of accommodating volume changes imposed by the lithiation and delithiation process. The presence of a Li2−xFeS2 phase is indicated for the first time by high-resolution transmission electron microscopy (HRTEM) and scanning transmission electron microscopy (STEM) electron energy loss spectroscopy (EELS). We suspect this phase is what enables electrochemical cycling to possess high reversibility over 0.7–2.4 V.
Introduction
In the quest for improved lithium-ion batteries (LIBs), considerable effort has been made to enhance the electrochemical properties of cathode materials.1 Along with development of new material systems,2–5 an increasing number of groups are paying attention to the relationship between the electrochemical properties and the morphology of the active material.6,7 Nanostructuring offers a number of advantages, including shorter solid state ionic and electron transport pathways, and an increased contact area with the electrolyte, which improves the rate performance.8–11 However, this increased surface area can also lead to an increase in solid electrolyte interphase formation, which may be detrimental to the cycle life. Additionally, maintaining both good electron and ion transport pathways in a nanostructured system can be challenging.It would provide a significant advantage if a hierarchical structure which exhibits a stable nanostructure and a robust macrostructure could be synthesized in a single step. Such a structure would provide a large number of active sites, a stable framework, and short diffusion lengths.12,13 Due to the advantages of such a structure, a wide range of hierarchically structured electrodes, which have exhibited excellent cycling performances and high reversible capacities, have been synthesized and studied,14,15 including hierarchical systems based on metal oxides,16–20 LiFePO4 (ref. 21 and 22) and Li4Ti5O12.23 In cases such as Si, the hierarchical structure is also important in preventing volume change induced degradation during lithiation and delithiation.24,25 Notably, dendritic nanostructures, which have been widely studied in other fields, prior to this work, have not been considered for use as electrode materials for Li ion batteries.
Due to their high theoretical capacities, metal sulfides including SnSx,26–28 MoS2,29–32 CuS2,33 and FeS2,34 CoS2,35 and Ni3S2 (ref. 36) are considered promising electrode materials. FeS2 (pyrite) has in particular been commercialized as a lithium battery cathode due to its high theoretical capacity (894 mA h g−1), earth abundance, environmentally benign nature and high temperature stability.37–40 With only a few exceptions however, pyrite has shown poor cyclability owing to its low electrical conductivity and limited reversibility, limiting its use to primary batteries.41,42 If these problems can be overcome, FeS2 will be a much more promising cathode material for next generation lithium-ion batteries.
The pure iron pyrite nanowire cathode materials synthesized by Song et al.38 retained a discharge capacity of 350 mA h g−1 after 50 cycles and 0.1C, possibly because of the improved reaction kinetics provided by the nanostructure. Liu et al.37 coated a carbon layer on octahedral FeS2 nanocrystallites to enhance electrical conductivity and structure stability, and this system exhibited a capacity retention of 495 mA h g−1 after 50 cycles at 0.5C. Wang et al.43 reported hierarchically structured hollow FeS2 microspheres which showed reasonable capacity and cycling performance (392.7 mA h g−1 after 30 cycles at 1C). All of these works emphasized the importance of nanostructuring for improving the electrochemical properties of pyrite cathodes. Here, we describe a facile self-assembly route for preparing dendritically structured pyrite-based Li-ion cathodes. These dendritic FeS2 composite cathodes exhibit high specific capacities and good cycling performance in the voltage window of both 0.7–2.4 V and 0.7–3.0 V. The Li2−xFeS2 phase was observed by high-resolution transmission electron microscopy (HRTEM) and electron energy loss spectroscopy (EELS) in scanning transmission electron microscopy (STEM) mode. Identification of this phase may enable further understanding of the lithiation/delithiation mechanism of FeS2.
Experimental section
1 Synthesis of the hierarchically structured FeS2
Ferrous sulfate heptahydrate (FeSO4·7H2O, Sigma Aldrich) was used to synthesize the dendritically structured α-Fe by an electric-field-induced and electrochemical reduction method.44 The hierarchically structured dendritic pyrite was obtained via thermal sulfidation of the as-synthesized dendritic α-Fe at 450 °C for 4 hours with a heating and cooling rate of 15 °C per minute under a continuous argon gas flow. Elemental sulfur (99.5–100.5%, Sigma Aldrich) was placed at the edge of the furnace, where it reached about 140 °C and formed a melt. The resulting sulphur vapour was carried by the argon gas flow over the dendritic nanostructured α-Fe.2 Material characterization
Sample composition and microstructure were determined by: X-ray diffraction (Philips X'pert XRD system with Cu Kα radiation, λ = 0.15418 nm); scanning electron microscopy and energy dispersive spectroscopy (Hitachi S-4700 SEM, EDS); transmission electron microscopy and high-resolution transmission electron microscopy (JEOL 2100 cryo, TEM and HRTEM); and electron energy loss spectroscopy (EELS) during scanning transmission electron microscopy (JEOL, 2010F STEM). Cycling of TEM and STEM-EELS samples were performed by dispersing the dendritic nanostructured FeS2 into ethanol, placing a couple of droplets on a copper grid with a carbon support film (EMS Acquisition Corp), covered by an identical copper grid and dried 2 h at 80 °C. The two grids were held by a toothless clamp and used as a cathode in a bottle cell. 1 M lithium hexafluorophosphate (LiPF6) in a mixture of ethylene carbonate (EC), dimethyl carbonate (DMC) and diethyl carbonate (DEC) (2![[thin space (1/6-em)]](https://www.rsc.org/images/entities/char_2009.gif) :1:2 in volume) was used as the electrolyte. 10 wt% fluoroethylene carbonate (FEC, Sigma Aldrich) was added to the electrolyte. The counter electrode is lithium foil (Alfa Aesar). After 7 charge/discharge cycles using about 0.2C rates between 0.7–2.4 V, the samples were removed from the electrolyte, and immersed into dimethyl carbonate (DMC) solvent for 30 min to remove the rest of electrolyte. The copper grids were taken out of the glove box, and immediately transferred to the TEM column for analysis.
:1:2 in volume) was used as the electrolyte. 10 wt% fluoroethylene carbonate (FEC, Sigma Aldrich) was added to the electrolyte. The counter electrode is lithium foil (Alfa Aesar). After 7 charge/discharge cycles using about 0.2C rates between 0.7–2.4 V, the samples were removed from the electrolyte, and immersed into dimethyl carbonate (DMC) solvent for 30 min to remove the rest of electrolyte. The copper grids were taken out of the glove box, and immediately transferred to the TEM column for analysis.
3 Fabrication of the composite cathode and electrochemical measurements
Composite electrodes were fabricated through mixing of the as-synthesized dendritic FeS2, carbon black (Super P Conductive, Alfa Aesar), and poly(vinylidene fluoride) (PVDF, MTI) binder (65:25:15 weight ratio) using a homogenizer (GLH-115, OMNI International) for 15 min in N-methylpyrrolidone (NMP, MTI). The resulting slurry was printed onto a conductive carbon-coated copper foil current collector (MTI) with an average FeS2 active material mass loading of 1–1.5 mg cm−2. Then, the composite electrodes were dried for 10 h at 120 °C. 9.5 mm diameter electrode disks were punched and then dried at 100 °C in a vacuum oven for 12 h before cell assembly.
Two-electrode battery-type Swagelok cells were used to test the electrochemical properties of the composite electrode on a VMP3 (Bio-Logic) potentiostat. Cyclic voltammetry (CV) was performed between 0.7–2.4 V and 0.7–3.0 V at a scan rate of 0.2 mV s−1. Electrochemical impedance spectroscopy (EIS) was performed on Swagelok cells after various cycle numbers at 2.4 V over a frequency range of 100 kHz to 10 mHz with an AC amplitude of 5.0 mV. The cells were kept at 2.4 V for 4 h, and allowed to rest for 4 h before taking EIS measurements.
Results and discussion
Fig. 1a–c shows scanning electron microscopy (SEM) images of the as-synthesized FeS2. The dendritic FeS2 particles are 8 to 15 μm in length and 4 to 6 μm in width, and possess a fine nanostructure on the branches and tips (in Fig. 1c). Energy dispersive spectroscopy (EDS) (Fig. S1†) indicates the atomic ratio of S to Fe is 2:1. All peaks in the X-ray diffraction (XRD) pattern (in Fig. 1d) can be indexed to pure cubic FeS2 (JCPDS no. 65-7643, a = 0.5404 nm). No impurities such as elemental Fe, elemental S or marcasite were detected.
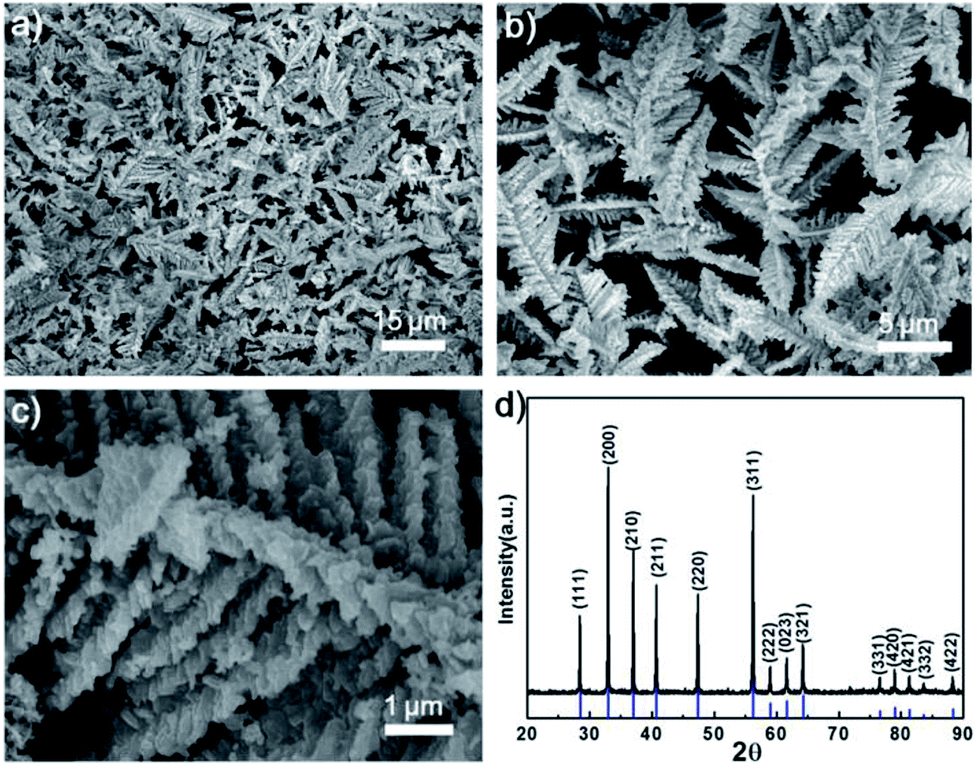 | ||
| Fig. 1 (a) Low, (b) intermediate and (c) high magnification SEM images of dendritic nanostructured FeS2; (d) XRD pattern of as-synthesized FeS2 with JCPDS card 65-7643 included below the spectra. | ||
The electrochemical performance of as-synthesized dendritic nanostructured FeS2 was studied in two-electrode battery-type Swagelok cells. The cycling and rate performance of the composite cathodes containing 60 wt% dendritic FeS2 over the voltage range of 0.7–2.4 V and 0.7–3.0 V (in Fig. 2a and b) were investigated. Fig. 2a shows the cycling performance of the dendritic structural FeS2 composite electrode between 0.7–2.4 V in an electrolyte with 10 wt% fluoroethylene carbonate (FEC) added. The specific capacities of the dendritic FeS2 cathode are 566 mA h g−1 (0.2C) and 449 mA h g−1 (1.0C) in the 1st cycle, and 348 mA h g−1 (0.2C) and 179 mA h g−1 (1.0C) after 150 cycles, exceeding that reported for pyrite nano-wires over 0.7–2.4 V.38
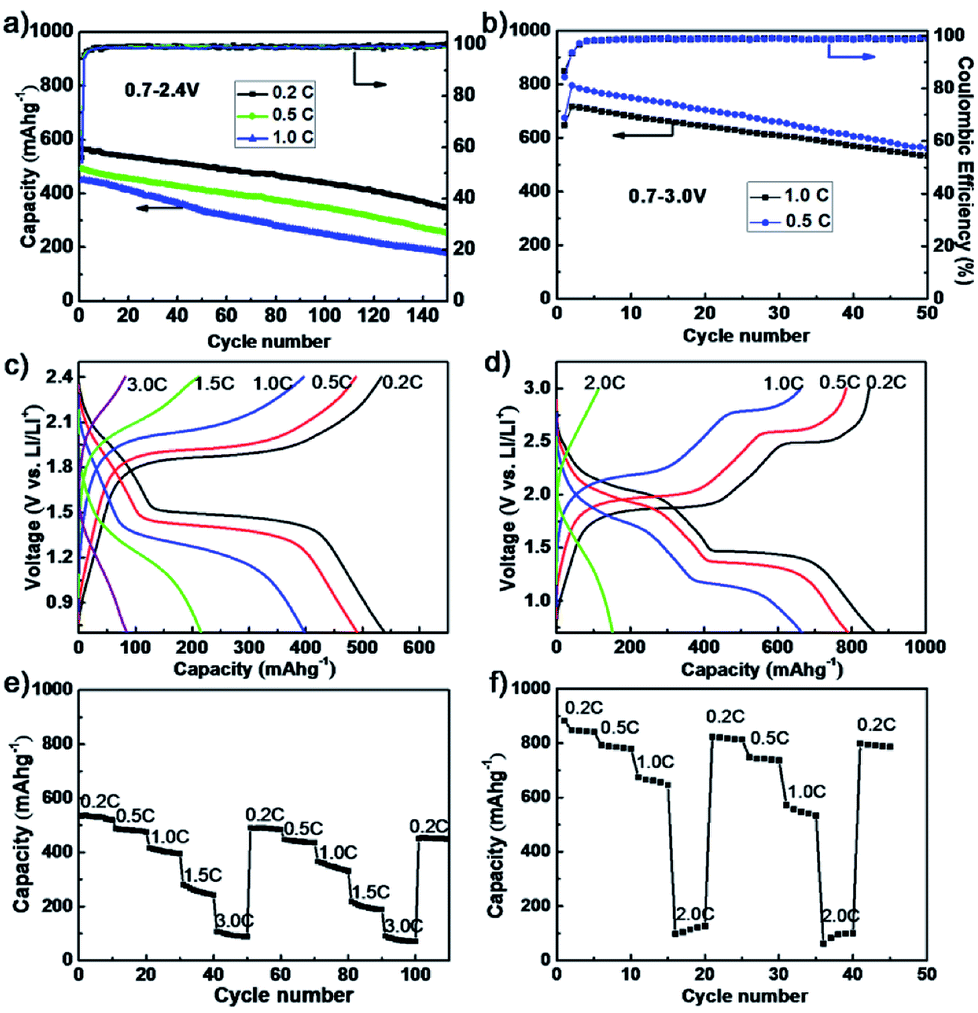 | ||
| Fig. 2 Cycling stability of the dendritic FeS2 composite electrodes (a) between 0.7–2.4 V at 0.2C, 0.5C and 1C, and (b) between 0.7–3.0 V at 0.5C and 1.0C; voltage–capacity curves in (c) 0.7–2.4 V and (d) 0.7–3.0 V range; and consecutive rate capability (e) from 0.2C to 3C over 0.7–2.4 V and (f) from 0.2C to 2C over 0.7–3.0 V. | ||
When cycling over 0.7–3.0 V, the specific capacities (in Fig. 2b) of a dendritic FeS2 composite cathode could reach 796 mA h g−1 (0.5C) and 717 mA h g−1 (1.0C) after the 1st cycle, and 560 mA h g−1 (0.5C) and 533 mA h g−1 (1.0C) after 50 cycles, which is about 70% of the 2nd cycle capacity and superior to the performances of polyacrylonitrile (PNA)-FeS2 (470 mA h g−1 after 50 cycles at 0.1C)45 and FeS2 stabilization with a bis(trifluoromethanesulfonyl)imide (TFSI−) anion-based ionic liquid electrolyte over 1.0–3.0 V,39 but lower than that of pyrite nanocrystals (≥630 mA h g−1) at the slow cycling rate of 200 mA g−1.46 Importantly, the dendritic FeS2 cathodes always show a high coulombic efficiency (CE) for different C rates. The average CE after 5 cycles exceeded 99.5% for 0.7–2.4 V and 98.9% for 0.7–3.0 V, indicating a good electrochemical reversibility. The electrochemical performance of some FeS2-based materials are shown in Table S1.† Fig. 2c shows voltage profiles between 0.7–2.4 V after the 10th cycle at each cycling rate. As the current density increases, the specific capacity decreases from 540 mA h g−1 at 0.2C to 490 mA h g−1, 400 mA h g−1, 220 mA h g−1 and 80 mA h g−1 at 0.5C, 1C, 1.5C and 3C, respectively. Meanwhile, the conversion plateaus become gradually sloped and shorter due to voltage polarization at higher C rates. There is the same change trend for the conversion plateaus in the 0.7–3.0 V range as shown in Fig. 2d. The consecutive rate capability tests (in Fig. 2e and f) also present good cycling stability at each rate. The capacity recovers even after high C rate charge/discharge processes, indicating that high C rates did not damage the electrode.
Cyclic voltammetry (CV) curves of this composite cathode provide some information on the charge/discharge mechanism of FeS2.
As shown in Fig. 3a and c, both CV curves show a broad reduction peak at approximately 1.2 V and a broad oxidation peak at about 2.0 V in the 1st cycle. This broad reduction peak has been suggested to correspond to the following reactions:47
| FeS2 + 2Li+ + 2e− → Li2FeS2 | (1) |
| Li2FeS2 + 2Li+ + 2e− → 2Li2S + Fe0 | (2) |
 | ||
| Fig. 3 Electrochemical properties of the dendritic FeS2 composite cathode at different cycle. CV at a scan rate of 0.2 mV s−1 over (a) 0.7–2.4 V and (c) 0.7–3.0 V; differential capacity versus voltage over (b) 0.7–2.4 V and (d) 0.7–3.0 V at 0.2C. | ||
Due to the relatively slow diffusion of Li+ into FeS2, reactions (1) and (2) proceed simultaneously at room temperature (≤30 °C), and thus only single broad reduction peak appears. The oxidation peak includes the reactions,45,48
| 2Li2S + Fe0 → Li2FeS2 + 2Li+ + 2e− | (3) |
| Li2FeS2 → Li2−xFeS2 + xLi+ + xe−(0 < x < 0.8) | (4) |
Generally, the hexagonal Li2−xFeS2 phase begins to decompose into ortho-FeS2 above 2.4 V as described in reaction (5),38,48
| Li2−xFeS2 → 0.8ortho-FeS2 + 0.2FeS8/7 + 0.175S + (2−x)Li+ + (2−x)e− | (5) |
After the first cycle, subsequent cycles between 0.7–2.4 V show a stable redox couple at 1.35 and 2.15 V corresponding to reactions (2), (3) and (4), respectively. The differential capacity versus voltage curves show that the redox reactions proceed at 1.50 and 1.85 V (Fig. 3b) when cycling at 0.2C. The CV curves of the composite cathode show two stable redox reactions during subsequent cycles when cycling over 0.7–3.0 V. In differential capacity curves (Fig. 3d), the peak at 2.50 V is from reaction (5), while the small broad reduction peak at 2.10 V corresponds to reduction of ortho-FeS2, S and lithium sulphides.45 The S and lithium sulphides are difficult to decompose and dissolve more easily in the electrolyte, which lead to the low reversibility of reaction (5), and probably is the main reason for the rapid capacity fade during cycling between 0.7–3.0 V.38,49 A 3.0 V cut off voltage does provide greater capacity, but also results in fast capacity fade.
We suggest the FeS2 electrochemical performance over 0.7–2.4 V can be attributed to the high reversibility of the intermediate Li2−xFeS2 and dendritic structure of FeS2 which provides a large surface area,50,51 a good electron and ion transport network, and a mechanically robust structure (note, while we cannot extract the active material from a cycled electrode, as Fig. 4a shows, the dendritic structure is retained with cycling). The dendritic structure increases both the reaction area between the active materials and the electrolyte, and shortens the solid-state Li ion diffusion length. These are important parameters at high charge/discharge rates.
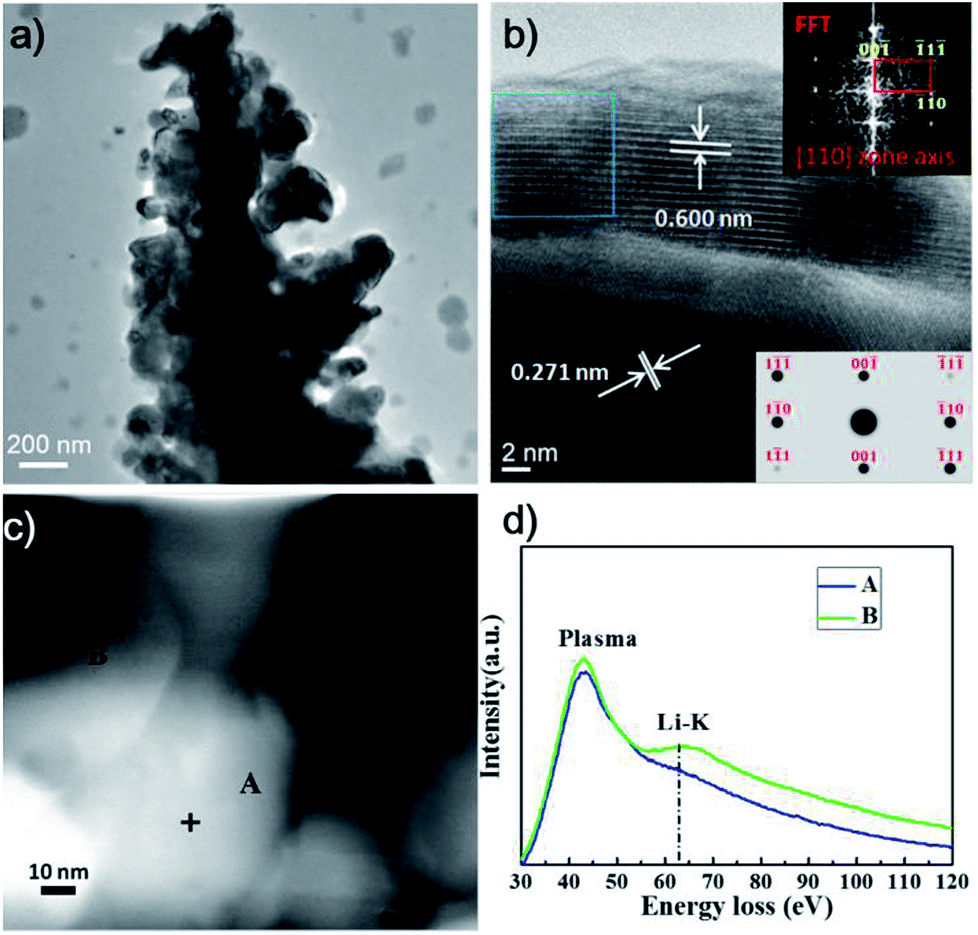 | ||
| Fig. 4 (a) TEM, (b) HRTEM, and (c) STEM-HAADF images of the dendritic FeS2 after 7 cycles at about 0.2C. (d) EELS spectra taken from the indicated regions in (c). | ||
As result above, the dendritic nanostructured FeS2 shows better cycling performance between 0.7 and 2.4 V than between 0.7 and 3.0 V, because of the high reversibility of the intermediate Li2−xFeS2 phase. To study the Li ion lithiation/delithiation process and confirm the formation of Li2−xFeS2, high-resolution transmission electron microscopy (HRTEM) images and scanning transmission electron microscopy energy loss spectroscopy (STEM-EELS) analyses in spot mode were performed on the dendritic FeS2 after 7 cycles at low charge/discharge rates (about 0.2C). The voltage vs. time curve (in Fig. S2†) shows clear charging/discharging conversion plateaus. Fig. 4a shows TEM images of cycled dendritic FeS2, after the final charging to 2.4 V, indicating that the dendritic structure is retained after cycling. HRTEM images in Fig. 4b show a clear phase boundary on the edge of the dendritic FeS2. The majority of inner part of the sample shows a 0.271 nm lattice spacing, corresponding to (200) crystal planes of cubic FeS2. Another HRTEM image after cycling, as well as a HRTEM image before cycling tests is shown in Fig. S3.† These images indicate that after a small number of cycles, the inner parts of the dendrite are still cubic FeS2 that has not reacted with Li. The lattice spacing near the surface is about 0.60 nm, very close to the theoretical value for the (001) planes in hexagonal-close-packed Li2FeS2. The fast Fourier transform (FFT) of the image, shown in top right of Fig. 4b, was taken from the outlined regions in the image and can be indexed to the [110] zone axis of the Li2FeS2 phase (crystal data adopted from the International Crystal Structural Database (ISCD #68380)). A simulated electron diffraction pattern of the Li2FeS2 phase along the [110] zone axis using the CrystalMaker™ software (right bottom inset in Fig. 4b) is in good agreement with the experimental FFT pattern, suggesting that the outside layer of the structure is the Li2FeS2 phase. Due to the low cut off voltage of 0.7 V, lithiation is incomplete, and the material is likely to be Li2−xFeS2, which possess the same crystal structure as Li2FeS2.
Fig. 4d shows the EELS spectra taken from the body (position A) and edge (position B) of cycled dendritic FeS2, as indicated in the STEM high angle annular dark field (HAADF) image in Fig. 4c. After background subtraction, a clear wide peak at about 63.5 eV is observed at the edge of cycled dendritic FeS2, which corresponds to the Li K-edge.52 The corresponding peak is not found in the intact inner region, indicating that only the outside part of dendrite is lithiated. Our TEM data provide direct evidence that the lithium ions are incorporated into the dendritic FeS2 nanostructure, resulting in the formation of the Li2−xFeS2 phase during the lithiation process.
Besides of the high reversible intermediate Li2−xFeS2 phase, the robust dendritic structure is the other key factor of dendritic FeS2's good cycling properties. The architecture of FeS2 provides a large surface area, a good electron and ion transport network, and reduce losing of active materials during cycle process. In order to confirming the importance of dendritic structure, the cycling performance of dendritic FeS2 composite cathode were tested in an electrolyte without FEC. The presence of FEC results in formation of a thin and stable SEI (Fig. S4 and Table S2†); which both enhances cycling reversibility, and appears to be an important contributor to retaining the dendritic structure of the electrode (Fig. 5). In a FEC-free electrolyte, the specific capacity of the dendritic FeS2 cathode fades quickly, with the fall-off appearing to increase after about 100 cycles. After 150 cycles at 0.2C, the dendritic structure of FeS2 appears considerably damaged (Fig. 5c) relative to the initial dendritic structure (Fig. 5b). In a 10 wt% FEC-containing electrolyte as already discussed, the dendritic FeS2 composite cathode exhibits a much improved cycling performance (Fig. 2a). What we observe via SEM, is that the dendritic structure is retained in this case (Fig. 5d), a strong indication that the dendritic structure plays an important role in cycling performance.
 | ||
| Fig. 5 (a) Cycling performances of the composite FeS2 cathode in a FEC-free electrolyte at different C rates in 0.7–2.4 V range. SEM images of the dendritic FeS2 composite cathode (b) before the cycling test, (c) after 150 cycles at 0.2C in FEC-free electrolyte and (d) after 150 cycles at 0.2C in 10 wt% FEC-containing electrolyte. | ||
Conclusions
We find that composite cathodes containing dendritic FeS2 demonstrate good reversible capacity and stable cycling over 0.7–2.4 V, and an enhanced capacity but diminished cycling stability over 0.7–3.0 V. The reversible capacities of the dendritic FeS2 cathodes were 560 mA h g−1 (0.5C) and 533 mA h g−1 (1.0C) after 50 cycles over 0.7–3.0 V, and 348 mA h g−1 (0.2C) after 150 cycles over 0.7–2.4 V. We propose that the reasonable cycling performance of the dendritic FeS2 cathode at different C rates is due to the hierarchical structure, which shortens the Li+ diffusion length and increases the contact area with the electrolyte in an architecture that is stable under volume changes due to lithiation and delithiation. The use of an FEC-containing electrolyte significantly improved the cycling performance, presumably by resulting in a thin and dense SEI. However, we still observe a steady capacity fade, indicating probably that a more stable SEI is still required, and that a robust artificial SEI, for example such as one formed via atomic layer deposition, might be required to stabilize the dendritic structure over many cycles. We postulate that the Li2−xFeS2 phase, which was observed by HRTEM and STEM-EELS, is one reason that the dendritic FeS2 shows better cycling performance over 0.7–2.4 V than over 0.7–3.0 V, where electrolyte-soluble products are formed.Conflicts of interest
There are no conflicts to declare.Acknowledgements
The authors acknowledge support of an AFOSR MURI (FA9550–12–1–0471) and experimental assistance from Dr Ke Sun and Dr Yang Hu. Z. Yu is grateful for fellowship support from the China Scholarship Council.References
- H. Li, Z. Wang, L. Chen and X. Huang, Adv. Mater., 2009, 21, 4593–4607 CrossRef CAS.
- P. L. Taberna, S. Mitra, P. Poizot, P. Simon and J. M. Tarascon, Nat. Mater., 2006, 5, 567–573 CrossRef CAS PubMed.
- H. Zhang, X. Yu and P. V. Braun, Nat. Nanotechnol., 2011, 6, 277–281 CrossRef CAS PubMed.
- Y. Xing, S. Wang, B. Fang, G. Song, D. P. Wilkinson and S. Zhang, J. Power Sources, 2018, 385, 10–17 CrossRef CAS.
- Y. Xing, S. Wang, B. Fang, Y. Feng and S. Zhang, Microporous Mesoporous Mater., 2018, 261, 237–243 CrossRef CAS.
- P. G. Bruce, B. Scrosati and J.-M. Tarascon, Angew. Chem., Int. Ed., 2008, 47, 2930–2946 CrossRef CAS PubMed.
- K. Olszowska, J. Pang, P. S. Wrobel, L. Zhao, H. Q. Ta, Z. Liu, B. Trzebicka, A. Bachmatiuk and M. H. Rummeli, Synth. Met., 2017, 234, 53–85 CrossRef CAS.
- B. Kang and G. Ceder, Nature, 2009, 458, 190–193 CrossRef CAS PubMed.
- A. S. Arico, P. Bruce, B. Scrosati, J.-M. Tarascon and W. van Schalkwijk, Nat. Mater., 2005, 4, 366–377 CrossRef CAS PubMed.
- C. Jiang, E. Hosono and H. Zhou, Nano Today, 2006, 1, 28–33 CrossRef.
- Y. Shao-Horn, S. Osmialowski and Q. C. Horn, J. Electrochem. Soc., 2002, 149, A1499–A1502 CrossRef CAS.
- Y.-G. Guo, J.-S. Hu and L.-J. Wan, Adv. Mater., 2008, 20, 2878–2887 CrossRef CAS.
- X. M. Yin, C. C. Li, M. Zhang, Q. Y. Hao, S. Liu, L. B. Chen and T. H. Wang, J. Phys. Chem. C, 2010, 114, 8084–8088 CrossRef CAS.
- J. Jiang, Y. Li, J. Liu, X. Huang, C. Yuan and X. W. Lou, Adv. Mater., 2012, 24, 5166–5180 CrossRef CAS PubMed.
- J. Zai, K. Wang, Y. Su, X. Qian and J. Chen, J. Power Sources, 2011, 196, 3650–3654 CrossRef CAS.
- L. Mai, L. Xu, C. Han, X. Xu, Y. Luo, S. Zhao and Y. Zhao, Nano Lett., 2010, 10, 4750–4755 CrossRef CAS PubMed.
- S. Gao, S. Yang, J. Shu, S. Zhang, Z. Li and K. Jiang, J. Phys. Chem. C, 2008, 112, 19324–19328 CrossRef CAS.
- L.-Y. Jiang, X.-L. Wu, Y.-G. Guo and L.-J. Wan, J. Phys. Chem. C, 2009, 113, 14213–14219 CrossRef CAS.
- J. S. Chen, Y. L. Tan, C. M. Li, Y. L. Cheah, D. Luan, S. Madhavi, F. Y. C. Boey, L. A. Archer and X. W. Lou, J. Am. Chem. Soc., 2010, 132, 6124–6130 CrossRef CAS PubMed.
- B. Wang, J. S. Chen, H. B. Wu, Z. Wang and X. W. Lou, J. Am. Chem. Soc., 2011, 133, 17146–17148 CrossRef CAS PubMed.
- H. Yang, X.-L. Wu, M.-H. Cao and Y.-G. Guo, J. Phys. Chem. C, 2009, 113, 3345–3351 CrossRef CAS.
- C. M. Doherty, R. A. Caruso, B. M. Smarsly and C. J. Drummond, Chem. Mater., 2009, 21, 2895–2903 CrossRef CAS.
- L. Shen, C. Yuan, H. Luo, X. Zhang, K. Xu and Y. Xia, J. Mater. Chem., 2010, 20, 6998–7004 RSC.
- A. Magasinski, P. Dixon, B. Hertzberg, A. Kvit, J. Ayala and G. Yushin, Nat. Mater., 2010, 9, 353–358 CrossRef CAS PubMed.
- Y. Zhao, X. Liu, H. Li, T. Zhai and H. Zhou, Chem. Commun., 2012, 48, 5079–5081 RSC.
- Y. Li, J. P. Tu, X. H. Huang, H. M. Wu and Y. F. Yuan, Electrochim. Acta, 2006, 52, 1383–1389 CrossRef CAS.
- S. Liu, X. Yin, L. Chen, Q. Li and T. Wang, Solid State Sci., 2010, 12, 712–718 CrossRef CAS.
- J.-W. Seo, J.-T. Jang, S.-W. Park, C. Kim, B. Park and J. Cheon, Adv. Mater., 2008, 20, 4269–4273 CrossRef CAS.
- L. Yang, S. Wang, J. Mao, J. Deng, Q. Gao, Y. Tang and O. G. Schmidt, Adv. Mater., 2013, 25, 1180–1184 CrossRef CAS PubMed.
- S. Ding, D. Zhang, J. S. Chen and X. W. Lou, Nanoscale, 2012, 4, 95–98 RSC.
- M. Wang, G. Li, H. Xu, Y. Qian and J. Yang, ACS Appl. Mater. Interfaces, 2013, 5, 1003–1008 CrossRef CAS PubMed.
- H. Hwang, H. Kim and J. Cho, Nano Lett., 2011, 11, 4826–4830 CrossRef CAS PubMed.
- C.-H. Lai, K.-W. Huang, J.-H. Cheng, C.-Y. Lee, B.-J. Hwang and L.-J. Chen, J. Mater. Chem., 2010, 20, 6638–6645 RSC.
- Y. Zhu, X. Fan, L. Suo, C. Luo, T. Gao and C. Wang, ACS Nano, 2016, 10, 1529–1538 CrossRef CAS PubMed.
- Q. Wang, L. Jiao, Y. Han, H. Du, W. Peng, Q. Huan, D. Song, Y. Si, Y. Wang and H. Yuan, J. Phys. Chem. C, 2011, 115, 8300–8304 CrossRef CAS.
- C.-H. Lai, K.-W. Huang, J.-H. Cheng, C.-Y. Lee, W.-F. Lee, C.-T. Huang, B.-J. Hwang and L.-J. Chen, J. Mater. Chem., 2009, 19, 7277–7283 RSC.
- J. Liu, Y. Wen, Y. Wang, P. A. van Aken, J. Maier and Y. Yu, Adv. Mater., 2014, 26, 6025–6030 CrossRef CAS PubMed.
- L. Li, M. Caban-Acevedo, S. N. Girard and S. Jin, Nanoscale, 2014, 6, 2112–2118 RSC.
- T. Evans, D. M. Piper, S. C. Kim, S. S. Han, V. Bhat, K. H. Oh and S.-H. Lee, Adv. Mater., 2014, 26, 7386–7392 CrossRef CAS PubMed.
- Z. Tomczuk, B. Tani, N. C. Otto, M. F. Roche and D. R. Vissers, J. Electrochem. Soc., 1982, 129, 925–931 CrossRef CAS.
- D. Zhang, Y. J. Mai, J. Y. Xiang, X. H. Xia, Y. Q. Qiao and J. P. Tu, J. Power Sources, 2012, 217, 229–235 CrossRef CAS.
- Y. Shao-Horn, S. Osmialowski and Q. C. Horn, J. Electrochem. Soc., 2002, 149, A1547–A1555 CrossRef CAS.
- Y. Wang, X. Qian, W. Zhou, H. Liao and S. Cheng, RSC Adv., 2014, 4, 36597–36602 RSC.
- Z. Yu, Z. Yao, N. Zhang, Z. Wang, C. Li, X. Han, X. Wu and Z. Jiang, J. Mater. Chem. A, 2013, 1, 4571–4576 RSC.
- S.-B. Son, T. A. Yersak, D. M. Piper, S. C. Kim, C. S. Kang, J. S. Cho, S.-S. Suh, Y.-U. Kim, K. H. Oh and S.-H. Lee, Adv. Energy Mater., 2014, 4, 1300961 CrossRef.
- M. Walter, T. Zund and M. V. Kovalenko, Nanoscale, 2015, 7, 9158–9163 RSC.
- S. K. Preto, Z. Tomczuk, S. von Winbush and M. F. Roche, J. Electrochem. Soc., 1983, 130, 264–273 CrossRef CAS.
- R. Fong, J. R. Dahn and C. H. W. Jones, J. Electrochem. Soc., 1989, 136, 3206–3210 CrossRef CAS.
- K. Kammer Hansen and K. West, 192nd International Meeting of The Electrochemical Society, pp. 124–132 Search PubMed.
- Z. Yu, N. Zhang, Z. Yao, X. Han and Z. Jiang, J. Mater. Chem. A, 2013, 1, 12462–12470 RSC.
- Z. Yu, Z. Yao, N. Zhang and Z. Jiang, RSC Adv., 2015, 5, 25266–25272 RSC.
- F. Wang, H.-C. Yu, M.-H. Chen, L. Wu, N. Pereira, K. Thornton, A. Van der Ven, Y. Zhu, G. G. Amatucci and J. Graetz, Nat. Commun., 2012, 3, 1201 CrossRef PubMed.
Footnote |
| † Electronic supplementary information (ESI) available: Energy Dispersive Spectroscopy (EDS), more electrochemical tests (including electrochemical impedance spectroscopy (EIS), cycling performance tests and cyclic voltammetry (CV) tests) and high-resolution transmission electron microscopy (HRTEM) images are available. See DOI: 10.1039/c8ra07606e |
| This journal is © The Royal Society of Chemistry 2018 |