 Open Access Article
The kinetics process of a Pb(II)/Pb(0) couple and selective fabrication of Li–Pb alloys in LiCl–KCl melts
Wei Han *,
Wenjuan Wang,
Yongchang Dong,
Mei Li*,
Xiaoguang Yang and
Milin Zhang
Key Laboratory of Superlight Materials and Surface Technology, Ministry of Education, College of Material Science and Chemical Engineering, Harbin Engineering University, Harbin 150001, China. E-mail: weihan@hrbeu.edu.cn; Fax: +86 451 8253 3026; Tel: +86 451 8256 9890
First published on 29th August 2018
Abstract
The electrode reaction of Pb(II) and co-reduction of Li(I) and Pb(II) were investigated on a tungsten electrode in LiCl–KCl eutectic melts by a range of electrochemical techniques. From cyclic voltammetry and square wave voltammetry measurements, the reduction of Pb(II) was found to be a one-step diffusion-controlled reversible process with the exchange of 2 electrons. The diffusion coefficients of Pb(II) were computed, and they obey the Arrhenius law. Using the linear polarization technique, the kinetic parameters, such as exchange current intensity (j0), standard rate constant (k0) and charge transfer resistance (Rct) for the Pb(II)/Pb(0) couple on a tungsten electrode were studied at different temperatures, and the activation energy is 27.32 kJ mol−1, smaller than the one for diffusion of Pb(II), which further confirmed that the reduction of Pb(II) was controlled by diffusion. A depolarisation effect for Li(I) reduction was observed from the results of cyclic voltammetry, square wave voltammetry and chronopotentiometry due to the formation of Li–Pb alloys by co-reduction of Li(I) and Pb(II). Furthermore, five Li–Pb intermetallic compounds, LiPb, Li8Pb3, Li3Pb, Li10Pb3 and Li17Pb4 characterized by scanning electronic microscopy and X-ray diffraction, were selectively prepared by potentiostatic electrolysis on a tungsten electrode and galvanostatic electrolysis on a liquid Pb electrode, respectively.
Introduction
A nuclear fusion reactor is considered to be a promising candidate for a future power source. As a tritium breeding blanket material for fusion reactors, Li and Pb alloy with Li 15.7–16.7 at%, namely, Li17Pb83 has attracted considerable interest,1 because of its advantages,2–4 such as good tritium breeding, low Li vapor pressure, moderate melting temperature and high blanket energy multiplication. Therefore, Li–Pb alloy has been widely studied, for example, in studies on the solubility of hydrogen in Li–Pb eutectic alloy,5–11 the density and surface tension of Li–Pb melts,12 the compatibility of structural materials with the liquid Li–Pb alloy13,14 the thermodynamic properties of Li–Pb alloys,15–19 etc.At present, the preparation of Li–Pb alloy was performed using a rapid cooling of the melt of Li–Pb alloy with an atomic ratio of 17![[thin space (1/6-em)]](https://www.rsc.org/images/entities/char_2009.gif) :
:![[thin space (1/6-em)]](https://www.rsc.org/images/entities/char_2009.gif) 83. However, during the manufacturing process of the Li–Pb alloy, a loss of Li through oxidation results in the formation of eutectic structures being inhibited. In order to ensure the efficient mixing of metallic Li and Pb and avoid the reaction of high reactivity Li with O2, Pascual et al.20 studied the optimum process conditions for the preparation of Li–Pb eutectic alloys.
83. However, during the manufacturing process of the Li–Pb alloy, a loss of Li through oxidation results in the formation of eutectic structures being inhibited. In order to ensure the efficient mixing of metallic Li and Pb and avoid the reaction of high reactivity Li with O2, Pascual et al.20 studied the optimum process conditions for the preparation of Li–Pb eutectic alloys.
As a new preparation method, electrochemical formation of metal or alloy has been investigated in molten salts because of some promising advantages.21 One of the most promising advantages is that the alloy composition could be controlled by selecting electrochemical parameters, which was confirmed by some investigators.22–27
So far, the electrochemical behavior of Pb(II) has been explored in molten chlorides by some investigators.28–35 They reported that the reduction reaction of Pb(II) is limited by mass transport of Pb(II) in molten AlCl3–NaCl–KCl,28 LiCl–KCl,29–33 NaCl–KCl34 and ZnCl2–2NaCl35 melts. Meanwhile, the diffusion coefficients for Pb(II) ions were calculated at different temperatures by cyclic voltammetry (CV) and chronopotentiometry (CP). Haarberg et al.33 determined the activation energy for the diffusion process of Pb(II) and found it to be 35.8 kJ mol−1. However, there is sparse information about the electrochemical formation of Pb based alloys in molten salts. Only the preparation of Al–Pb alloys28 and Mg–Li–Pb alloys31 has been reported in molten AlCl3–NaCl–KCl and LiCl–KCl–PbCl2–MgCl2 melts, respectively.
According to the review mentioned above, it was found that the kinetics of electrode reaction for Pb(II)/Pb(0) couple on W electrode and electrochemical formation of Li–Pb alloy have never been investigated in molten salts. So, the electrode reaction of Pb(II) was firstly investigated on tungsten electrode, and the kinetic properties, such as exchange current densities, standard rate constants and charge transfer resistances for Pb(II)/Pb(0) couple were estimated in the temperature range from 663 K to 753 K. Then, the co-reduction mechanism of Li(I) and Pb(II) was studied on tungsten electrode by various electrochemical methods. Furthermore, Li–Pb alloys were selective formed by potentiostatic electrolysis on tungsten electrode and galvanostatic electrolysis on liquid Pb electrode, and characterized by X-ray diffraction (XRD) and scanning electronic microscopy (SEM).
Experimental
Salt preparation
All electrochemical tests and samples preparation were performed in an argon-atmosphere glove box (less than 5 ppm O2 and H2O). Anhydrous LiCl (99.9%) was purchased from Shanghai Baishi Chemical Engineering Limited Company, KCl (99.9%) from Tianjin Yongda Chemical Reagent Limited Company and PbCl2 (99.9%) from Shanghai Aladdin Reagent Limited Company. The mixed salts of LiCl–KCl with eutectic composition (45.8![[thin space (1/6-em)]](https://www.rsc.org/images/entities/char_2009.gif) :
:![[thin space (1/6-em)]](https://www.rsc.org/images/entities/char_2009.gif) 54.2 mass) and PbCl2 were dehydrated under vacuum at 473 K for 72 h to remove the residual water. Then, pre-electrolysis was carried out at −2.1 V (vs. Ag/AgCl) for 5 h to remove metal ion impurities in LiCl–KCl eutectic. The melts temperature was measured using a chromel–alumel thermocouple sheathed by an alumina tube.
54.2 mass) and PbCl2 were dehydrated under vacuum at 473 K for 72 h to remove the residual water. Then, pre-electrolysis was carried out at −2.1 V (vs. Ag/AgCl) for 5 h to remove metal ion impurities in LiCl–KCl eutectic. The melts temperature was measured using a chromel–alumel thermocouple sheathed by an alumina tube.
Experimental set-up
A three electrode system was established to conduct electrochemical measurement. Spectral pure graphite rod with a diameter of 6.0 mm and tungsten wire (99.9%) with a diameter of 1.0 mm were served as counter electrode and working electrode, respectively. As for the reference electrode, a silver wire with a diameter of 1.0 mm was dipped into eutectic LiCl–KCl containing 1.0 wt% of AgCl (99.99%), which was placed into a Pyrex tube. The measured potentials were relative to this Ag/AgCl reference couple. After each electrochemical test, the active electrode area was measured by measuring the immersed depth of the electrode in the molten salts. However, liquid Pb electrode was used as working electrode to investigate the electrochemical formation of Li–Pb alloys. Liquid Pb working electrode consisted of a pool of liquid Pb (99.99%) in an alumina crucible. Tungsten wire with a diameter of 1.0 mm was served for electrical connections. Metrohm Electrochemical Workstation (Autolab PGSTAT302N) with electrochemical software (NOVA 1.10) was used to perform the electrochemical tests.Instrumentation
The Li–Pb alloys were fabricated by potentiostatic and galvanostatic electrolysis, respectively. After electrolysis, the cathodic deposits were washed with ethylene oxide (99.7%) to remove solidified salt attached to their surface. These deposits were analyzed by X-ray diffraction (XRD, Rigaku D/max-TTR-III diffractometer) by Cu-Kα radiation at 40 kV, 150 mA and scanning electronic microscopy (SEM, JSM-6480A; JEOL Co., Ltd) to characterize the composition and morphology of Li–Pb alloys.Results and discussion
Electrode reaction of Pb(II) on tungsten electrode
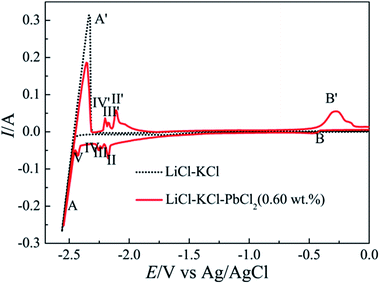 | ||
| Fig. 1 Cyclic voltammograms of LiCl–KCl melts before (dotted curve) and after the addition of PbCl2 (0.60 wt%) (red curve) at 723 K on tungsten electrode (0.322 cm2) at scan rate of 0.1 V s−1. | ||
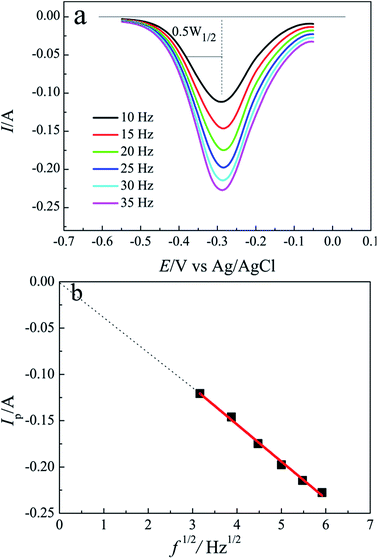
Square wave voltammetry (SWV) has a higher sensitivity and resolution than CV,36–40 it is usually applied to estimate the number of exchanged electrons in electrochemical reaction. For a simple reversible electrode reaction, the width of the half peak W1/2 is related to the number of exchanged electrons by the following equation:41,42
| W1/2 = 3.52RT/nF | (1) |
To further research the electrochemical reaction of Pb(II) ion on tungsten electrode, SWV was conducted and a series of square wave voltammograms of Pb(II) acquired on tungsten electrode at different frequencies are presented in Fig. 2(a). Because the peak currents exhibit a linear dependence with the square root of frequency and the intercept is nearly zero shown in Fig. 2(b), eqn (1) can be used to compute the number of transferred electrons. The average width of half peak is about 0.13 V and the number of electron exchanged is found to be 1.7, closed to 2.0. The result illustrates that the reduction of Pb(II) ion to Pb metal on tungsten electrode proceeds in one step with the exchange of 2-electron.
| Pb(II) + 2e− → Pb(0) | (2) |
For a revisable system, the Berzins and Delahay equation43 can be applied to calculate diffusion coefficient D.
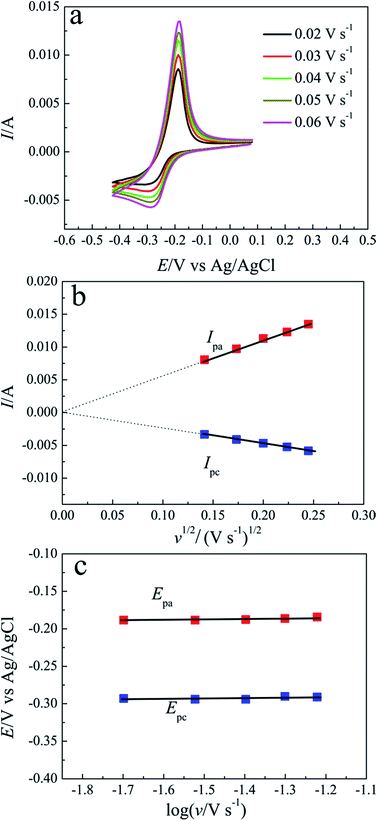
| Ip = −0.611SC0(nF)3/2(Dv/RT)1/2 | (3) |
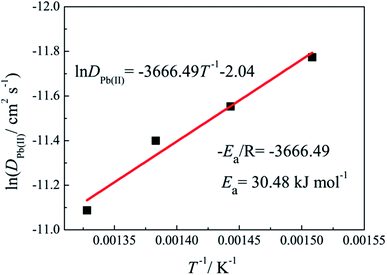
According to the eqn (3), the diffusion coefficients of Pb(II) in LiCl–KCl–PbCl2 melts were calculated in the temperature range of 663–753 K. The comparison of the calculated results and the ones from ref. 29, 32, 33 and 35 are listed in Table 1. It can be seen from Table 1, our results are agreement with the data acquired by Haarberg et al.33 using CV and CP. However, they are slightly smaller than those achieved by Castrillejo et al.35 using cyclic voltammetry and chronopotentiometry. The difference may be caused by different chloride melts and concentration of Pb(II) ions. A linear relationship between the logarithm of diffusion coefficients and the reciprocal of temperatures are acquired from Fig. 4, in line with Arrhenius formula. Therefore, eqn (4) can be applied to estimate the activation energy for diffusion of Pb(II), and value is found to be 30.48 kJ mol−1, slightly smaller than that calculated by Haarberg et al.33 The reason caused the difference may be that the measured temperature range is different.
D = D0![[thin space (1/6-em)]](https://www.rsc.org/images/entities/char_2009.gif) exp(−Ea/RT) exp(−Ea/RT)
| (4) |
 | (5) |
For a small value of x, the exponential ex can be approximated as 1 + x. Thus, for sufficiently small η, eqn (5) can be expressed as follows:
| j = −j0(nF/RT)η | (6) |
In analogy to Ohm's law, the charge transfer resistance Rct can be computed using eqn (7).44
| Rct = (dη/di)η→0 = RT/nFSj0 | (7) |
Meanwhile, the standard reaction rate constant (k0) is also calculated according to eqn (8).44
| j0 = nFSk0C0 | (8) |
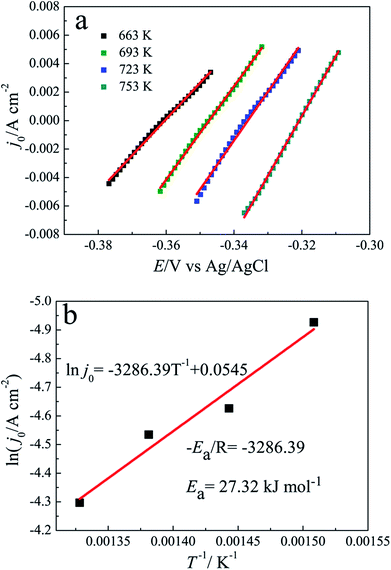
Fig. 5(a) shows the linear polarization curve recorded at the equilibrium potential of Pb(II)/Pb(0) on tungsten electrode at scan rate of 5 mV s−1 and overpotentials of ±15 mV in the temperature of 663–753 K. The slopes of fitted line are employed to evaluate the exchange current density j0. Meanwhile, according to eqn (7) and (8), the charge transfer resistance Rct and standard reaction rate constant k0 are also estimated and listed in Table 2. It is obvious that the charge transfer resistance significantly decreased, the exchange current densities and standard reaction rates increase with the increasing of temperature. The values of standard reaction rates are in the order of 10−3. The relationship between the reciprocal of the temperature and the logarithm of exchange current density is presented in Fig. 5(b), which obeys to Arrhenius law. Thus, the activation energy for the electrode reaction of Pb(II)/Pb(0) couple can be acquired.
ln![[thin space (1/6-em)]](https://www.rsc.org/images/entities/char_2009.gif) j0 = −Ea/RT + ln j0 = −Ea/RT + ln![[thin space (1/6-em)]](https://www.rsc.org/images/entities/char_2009.gif) A A
| (9) |
| T/K | 663 | 693 | 723 | 753 |
| j0 × 102/A cm−2 | 0.73 ± 0.0075 | 0.98 ± 0.0073 | 1.1 ± 0.015 | 1.4 ± 0.0078 |
| Rct/Ω | 12.15 ± 0.12 | 9.46 ± 0.07 | 8.79 ± 0.12 | 7.19 ± 0.04 |
| k0 × 103/cm s−1 | 1.03 ± 0.01 | 1.41 ± 0.01 | 1.59 ± 0.02 | 2.05 ± 0.01 |
| Ea/kJ mol−1 | 27.32 ± 0.44 | |||
Using eqn (9), the activation energy for the electrode reaction of Pb(II)/Pb(0) couple is estimated to be 27.32 kJ mol−1, which is smaller than the one for diffusion of Pb(II) in LiCl–KCl melts. The result can further identify that the electroreduction of Pb(II) on tungsten electrode is diffusion-controlled process.
| Li(I) + xPb(II) + (1 + 2x)e− → LiPbx | (10) |
| Peak or plateau | I (LiPb) | II (Li8Pb3) | III (Li3Pb) | IV (Li10Pb3) | V (Li17Pb4) |
|---|---|---|---|---|---|
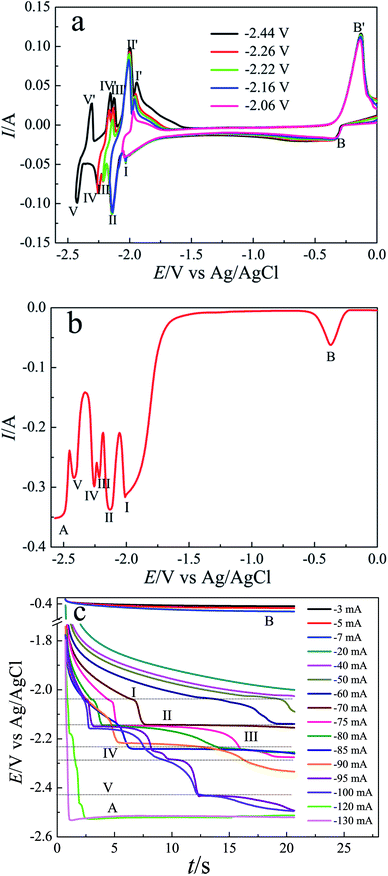
| CV/V | −2.03 | −2.14 | −2.21 | −2.25 | −2.43 |
| SWV/V | −2.01 | −2.13 | −2.22 | −2.25 | −2.42 |
| CP/V | −2.14 | −2.14 | −2.23 | −2.28 | −2.43 |
To investigate the co-reduction of Li(I) and Pb(II) on tungsten electrode in LiCl–KCl–PbCl2 (0.60 wt%) melts, SWV was conducted at a frequency of 20 Hz and step potential of 5 mV shown in Fig. 6(b). Seven current peaks are recorded around at −2.01 V, −2.13 V, −2.22 V, −2.25 V and −2.42 V, respectively. Cathodic peaks A and B are associated with the deposition of metallic Li and Pb, respectively. The others between peaks A and B should pertain to the formation of five Li–Pb compounds. These reduction potentials are also displayed in Table 3. It is obvious that these potentials are consistent with those from cyclic voltammogram shown in Fig. 6(a).
Fig. 6(c) depicts a range of chronopotentiograms recorded in LiCl–KCl–PbCl2 (0.60 wt%) melts on tungsten electrode at different current intensities. Six potential plateaus are detected in chronopotentiograms. The first potential plateau (I) recorded at about −2.04 V is ascribed to the formation of LiPb intermetallic compound when the cathodic current reaches −30 mA. While the cathodic current is more positive than −70 mA, the second potential plateau II occurs at around −2.14 V due to the deposition of Li8Pb3 intermetallic compound. At the cathodic current intensity of −95 mA, three potential plateaus (III, IV and V) appear at about −2.23 V, −2.28 V, −2.43 V, corresponding to the formation of Li3Pb, Li10Pb3 and Li4Pb intermetallic compounds, respectively. The last potential plateau of A is detected at around −2.51 V, associated with the deposition of metallic Li. The deposition potentials of the formation of Li–Pb intermetallic compounds are also presented in Table 3. It is clear that the potential ranges for the formation of Li–Pb intermetallic compounds are in accordance with those observed in other electrochemical tests.
Preparation and characterization of Li–Pb alloys on different electrodes
In order to confirm the attribution of five reduction peaks/plateaus, potentiostatic electrolysis was carried out at different applied potentials in term of the deposition potentials of Li–Pb intermetallic compounds acquired by CV, SWV and CP (listed in Table 3) at 723 K. Fig. 7 displays the XRD patterns of deposits prepared by co-reduction of Li(I) and Pb(II) using potentiostatic electrolysis at −2.04 V, −2.14 V, −2.28 V and −2.43 V for 6 h on tungsten electrode (0.322 cm2) in LiCl–KCl–PbCl2 (6 wt%) melts. The results of XRD indicate that five Li–Pb intermetallic compounds, including LiPb, Li8Pb3, Li3Pb, Li10Pb3 and Li17Pb4, were produced. It can be seen from Fig. 7(a) that only one intermetallic compound of LiPb was generated by potentiostatic electrolysis at −2.04 V, which can ascertain the peak/plateau I detected at about −2.04 V in Fig. 6 is related to the formation of LiPb compound, which reveal that eutectic Li–Pb alloy can be produced by potentiostatic electrolysis at −2.04 V. We can find that metallic Pb is dominant. The reason may be that the pre-deposited Pb did not react completely.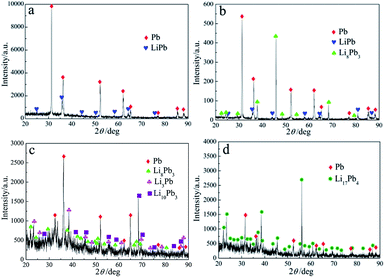 | ||
| Fig. 7 XRD patterns of deposits attained on tungsten electrode (0.322 cm2) in LiCl–KCl–PbCl2 melts by potentiostatic electrolysis at (a) −2.04 V, (b) −2.14 V, (c) −2.28 V and (d) −2.43 V for 6 h. | ||
While the applied potential increased to −2.14 V, two Li–Pb compounds, LiPb and Li8Pb3, were formed shown in Fig. 7(b). Thus, the peak/plateau II in Table 3 is related to the deposition of Li8Pb3. Since the reduction potentials of peaks/plateaus III and IV shown in Fig. 6 are very close, the potentiostatic electrolysis was conducted at −2.28 V for 6 h. Two new Li–Pb compounds, Li3Pb and Li10Pb3, are characterized by XRD (see Fig. 7(c)). Thus, the two peaks/plateaus III and IV shown in Fig. 6 should pertain to the formation of Li3Pb and Li10Pb3, respectively. When applied potential at −2.43 V, Li17Pb4 was prepared shown in Fig. 7(d), which reveal the peak/plateau of IV shown in Fig. 6 pertaining to the deposition of Li17Pb4 compound. The results of potentiostatic electrolysis show that different Li–Pb compounds could be formed by controlling deposition potential. Because Li atom is too light to be determine by EDS (energy dispersive spectrometry) mapping analysis the microstructure of the Li–Pb alloys attained by potentiostatic electrolysis at different applied potential was detected by SEM shown in Fig. 8. It is clear that distinct regions are observed from the surface of the sample, which indicates the formation of different Li–Pb phases.
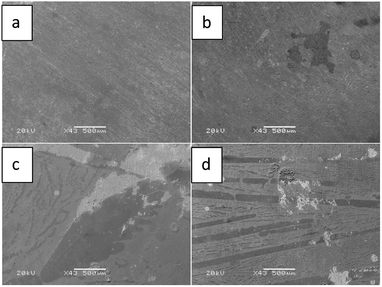
In order to investigate the preparation of Li–Pb intermetallic compounds, galvanostatic electrolysis was also carried out on liquid Pb electrode at 1.0 A. On the basis of the result of chronopotentiogram, 1.0 A is far larger than the deposited current of metallic Li, thus, the Li-rich Li–Pb compounds could be prepared with prolonging the run time. Fig. 9 illustrates the SEM image of Li–Pb alloys gained by galvanostatic electrolysis at 1.0 A for 4 h, 6 h, 7 h and 9 h, respectively. Two different zones, a light zone and dark one, are observed, which correspond to the formation of different phases.
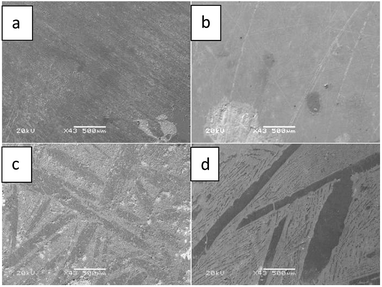 | ||
| Fig. 9 SEM images of the surface of Li–Pb alloys prepared on liquid Pb electrode in LiCl–KCl–PbCl2 melts by galvanostatic electrolysis at 1.0 A for (a) 4 h, (b) 6 h, (c) 7 h, and (d) 9 h. | ||
The results of XRD patterns illustrate that galvanostatic electrolysis was operated at 1.0 A for 4 h, only one Li–Pb intermetallic compound LiPb is produced shown in Fig. 10(a). While prolonging the electrolysis time to 6 h, two compounds of LiPb and Li8Pb3 can be prepared (shown in Fig. 10(b)). With prolonging the deposition time, Li3Pb, Li10Pb3 and Li17Pb4 phases are formed and shown in XRD patterns of Li–Pb samples (Fig. 10(c) and (d)). The results indicate that five Li–Pb compounds and the eutectic Li–Pb alloy can be produced by galvanostatic electrolysis at 1.0 A by controlling electrolysis time.
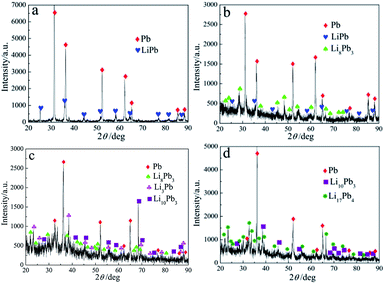 | ||
| Fig. 10 XRD patterns of the samples obtained on a liquid Pb electrode in LiCl–KCl–PbCl2 melts by galvanostatic electrolysis at 1.0 A for (a) 4 h, (b) 6 h, (c) 7 h and (d) 9 h at 723 K. | ||
Conclusions
The electrode reaction of Pb(II) was investigated on an inert tungsten electrode in LiCl–KCl eutectic melts using CV and SWV. The results displayed that the reduction of Pb(II) is a one-step reversible process with the exchange of two electrons. The diffusion coefficients were computed using the Berzins–Delahay equation in the temperature range from 663 K to 753 K, and the activation energy for diffusion of Pb(II) was found to be 30.48 kJ mol−1. Using the linear polarization method, the kinetic parameters, such as exchange current intensity (j0), standard rate constant (k0) and charge transfer resistance (Rct) for the Pb(II)/Pb(0) couple were evaluated, and the temperature dependence of j0 was investigated to evaluate the activation energy for the electrode of the Pb(II)/Pb(0) couple and it was found to be 27.32 kJ mol−1. Since the activation energy for diffusion of Pb(II) is larger than the one for the electrode reaction of the Pb(II)/Pb(0) couple, the electrochemical reaction of Pb(II) is controlled by diffusion.A depolarisation effect was observed when Li(I) was reduced on pre-deposited Pb metal proving that five Li–Pb intermetallics are formed by co-reduction of Li(I) and Pb(II) using various electrochemical techniques. The Li–Pb alloys were generated by potentiostatic electrolysis at different deposition potentials on tungsten electrode and galvanostatic electrolysis on liquid Pb electrode. The five intermetallics, LiPb, Li8Pb3, Li3Pb, Li10Pb3 and Li17Pb4 characterized by XRD and SEM, could be produced, which proves the feasibility to selectively prepare Li–Pb alloys by controlling deposition potentials and time.
Conflicts of interest
There are no conflicts to declare.Acknowledgements
The work was financially supported by the National Natural Science Foundation of China (11675044, 11575047 and 21790373), the Major Research plan of the National Natural Science Foundation of China (91326113 and 91226201) and the Fundamental Research funds for the Central Universities (HEUCFP201849).References
- E. Mas de les Valls, L. A. Sedano, L. Batet, I. Ricapito, A. Aiello, O. Gastaldi and F. Gabriel, J. Nucl. Mater., 2008, 376, 353–357 CrossRef.
- C. H. Wu, J. Nucl. Mater., 1983, 114, 30–33 CrossRef.
- P. Hubberstey, T. Sample and M. G. Barker, J. Nucl. Mater., 1992, 191–194, 283–287 Search PubMed.
- S. Fukada, M. Okada, Y. Edao, H. Okitsu and S. Yoshimura, Fusion Sci. Technol., 2013, 64, 636–640 CrossRef.
- F. Reiter, Fusion Eng. Des., 1991, 14, 207–211 CrossRef.
- P. Fauvet and J. Sannier, J. Nucl. Mater., 1988, 155–157, 516–519 CrossRef.
- Y. C. Chan and E. Veleckis, J. Nucl. Mater., 1984, 122–123, 935–940 CrossRef.
- R. Schumacher and A. Weiss, Ber. Bunsenges. Phys. Chem., 1990, 94, 684–691 CrossRef.
- A. Aiello, A. Ciampichetti and G. Benamati, Fusion Eng. Des., 2006, 81, 639–644 CrossRef.
- H. Katsuta, H. Iwamoto and H. Ohno, J. Nucl. Mater., 1985, 133–134, 167–170 CrossRef.
- A. Pozio, M. Carewska, A. Santucci and S. Tosti, Int. J. Hydrogen Energy, 2017, 42, 1053–1062 CrossRef.
- V. N. Lesev and V. A. Sozayev, Bull. Russ. Acad. Sci.: Phys., 2016, 80, 1367–1371 Search PubMed.
- B. A. Pint and K. A. Unocic, J. Nucl. Mater., 2013, 442, S572–S575 CrossRef.
- U. Jain, A. Mukherjee, S. Sonak, S. Kumar, R. Mishra and N. Krishnamurthy, Fusion Eng. Des., 2014, 89, 2554–2558 CrossRef.
- S. Terlicka, A. Dębski and W. Gąsior, J. Mol. Liq., 2018, 249, 66–72 CrossRef.
- J. Saar and H. Ruppersberg, J. Phys. F: Met. Phys., 1987, 17, 305–314 CrossRef.
- M. L. Saboungi, J. Marr and M. Blander, J. Chem. Phys., 1978, 68, 1375–1384 CrossRef.
- W. Gasior and Z. Moser, J. Nucl. Mater., 2001, 29, 77–83 CrossRef.
- J. Wang, P. King and R. A. Huggins, Solid State Ionics, 1986, 20, 185–189 CrossRef.
- L. Pascual, M. I. Barrena, J. M. Gomez de Salazar, A. Soria, M. Fernández, E. Conde and J. Quinones, Fusion Eng. Des., 2014, 89, 1269–1273 CrossRef.
- T. Iida, T. Nohira and Y. Ito, Electrochim. Acta, 2003, 48, 1531–1536 CrossRef.
- M. Gibilaro, L. Massot, P. Chamelot and P. Taxil, Electrochim. Acta, 2009, 55, 281–287 CrossRef.
- Y. L. Liu, L. Y. Yuan, G. A. Ye, K. Liu, L. Zhu, M. L. Zhang, Z. F. Chai and W. Q. Shi, Electrochim. Acta, 2014, 147, 104–113 CrossRef.
- M. Li, Q. Q. Gu, W. Han, Y. D. Yan, M. L. Zhang, Y. Sun and W. Q. Shi, Electrochim. Acta, 2015, 167, 139–146 CrossRef.
- L. X. Luo, Y. L. Liu, N. Liu, L. Wang, L. Y. Yuan, Z. F. Chai and W. Q. Shi, Electrochim. Acta, 2016, 191, 1026–1036 CrossRef.
- M. Li, B. Liu, N. Ji, Y. Sun, W. Han, T. Jiang, S. Peng, Y. D. Yan and M. L. Zhang, Electrochim. Acta, 2016, 193, 54–62 CrossRef.
- Y. C. Wang, M. Li, W. Han, M. L. Zhang, T. Jiang, S. M. Peng and Y. D. Yan, J. Alloys Compd., 2017, 695, 3484–3494 CrossRef.
- M. Jafarian, I. Danaee, A. Maleki, F. Gobal and M. G. Mahjani, J. Alloys Compd., 2009, 478, 83–88 CrossRef.
- R. J. Heus and J. J. Egan, J. Electrochem. Soc., 1960, 107, 824–828 CrossRef.
- G. M. Haarberg, L. E. Owe, B. Qin, J. Wang and R. Tunold, ECS Trans., 2012, 50, 215–219 CrossRef.
- M. L. Zhang, L. J. Chen, W. Han, Y. D. Yan and P. Cao, Trans. Nonferrous Met. Soc. China, 2012, 22, 711–716 CrossRef.
- H. A. Laitinen and H. C. Gaur, Anal. Chim. Acta, 1958, 18, 1–13 CrossRef.
- G. M. Haarberg, T. Støre and R. Tunold, Electrochim. Acta, 2012, 76, 256–261 CrossRef.
- R. B. Stein, J. Electrochem. Soc., 1959, 106, 528 CrossRef.
- Y. Castrillejo, S. Palmero, M. A. Garcia, L. Deban and P. Sanchez Batanero, Electrochim. Acta, 1996, 41, 2461–2468 CrossRef.
- L. Ramaley and M. S. Krause, Anal. Chem., 1969, 41, 1362–1365 CrossRef.
- J. J. O′Dea, J. Osteryoung and R. A. Osteryoung, J. Chem. Phys., 1983, 87, 3911–3918 CrossRef.
- J. J. O′Dea, K. Wikiel and J. Osteryoung, J. Chem. Phys., 1990, 94, 3628–3636 CrossRef.
- S. P. Kounaves, J. J. O′Dea and P. Chandresekhar, Anal. Chem., 1986, 58, 3199–3202 CrossRef.
- J. H. Christle, J. A. Turner and R. A. Osteryoung, Anal. Chem., 1977, 49, 1899–1903 CrossRef.
- J. G. Osteryoung and R. A. Osteryoung, Anal. Chem., 1985, 57, 101A–110A CrossRef.
- L. Ramaley and M. S. Krasue, Anal. Chem., 1969, 41, 1362–1365 CrossRef.
- T. Berzins and P. Delahay, J. Am. Chem. Soc., 1953, 75, 555–559 CrossRef.
- A. J. Bard and L. R. Faulkner, Electrochemical Methods: Fundamentals and Applications, John Wiley & Sons, New York, 2nd edn, 2001, pp. 61–80 Search PubMed.
| This journal is © The Royal Society of Chemistry 2018 |

