
 Open Access Article
 This Open Access Article is licensed under a Creative Commons Attribution-Non Commercial 3.0 Unported Licence
Hypoglycemic, hypolipidemic and antioxidant effects of iridoid glycosides extracted from Corni fructus: possible involvement of the PI3K–Akt/PKB signaling pathway†
Jiefang Kang‡
a,
Chen Guo‡ a,
Rodolfo Thomeb,
Ning Yanga,
Yuan Zhanga,
Xing Li*a and
Xiaoyan Cao*a
a,
Rodolfo Thomeb,
Ning Yanga,
Yuan Zhanga,
Xing Li*a and
Xiaoyan Cao*a
aKey Laboratory of the Ministry of Education for Medicinal Resources and Natural Pharmaceutical Chemistry, National Engineering Laboratory for Resource Development of Endangered Crude Drugs in Northwest of China, College of Life Sciences, Shaanxi Normal University, Xi'an, Shaanxi, China. E-mail: caoxiaoyan@snnu.edu.cn
bDepartment of Neurology, Thomas Jefferson University, Philadelphia, PA 19107, USA. E-mail: xingli_xian@126.com
First published on 29th August 2018
Abstract
Iridoid glycosides (CIG) are the major component of Corni fructus. In this work, we researched the antioxidative, hypoglycemic and lowering blood lipids effects of CIG on diabetic mice induced by a high-fat diet (HFD) and streptozotocin (STZ). Furthermore, to investigate the molecular mechanism of action, the phosphorylation and protein expression of phosphoinositide 3-kinase (PI3K) and its downstream proteins, such as insulin receptor (INSR), protein kinase B (Akt/PKB) and glucose transporter 4 (GLUT4) have been detected. The results showed that CIG significantly improved oral glucose tolerance in diabetic mice. Biochemical indices also revealed that CIG had a positive effect on lipid metabolism and oxidative stress. In addition, CIG can significantly enhance the expression level of the PI3K–Akt/PKB pathway related proteins in skeletal muscle, which is the key pathway of insulin metabolism. These findings show that CIG can improve the hyperglycemia and hyperlipidemia of HFD–STZ-induced diabetic mice through the PI3K–Akt/PKB signaling pathway, and CIG might be a potential medicine or functional food for type 2 diabetes mellitus remedies.
1. Introduction
Diabetes is one of the most common chronic diseases in the world, and its prevalence is increasing dramatically. It was estimated that there were 425 million people with diabetes across the world in 2017, according to the International Diabetes Federation (IDF) programs, and this figure is expected to increase to 642 million by 2040.1 About 90% of these patients with diabetes have type 2 diabetes mellitus (T2DM).2 T2DM is a metabolic disease based on hyperglycemia characters and is due to insulin resistance (IR) caused by a progressive insulin secretory defect or by a lack of response of insulin receptors.3 Persistently high blood glucose levels may lead to a variety of long-term complications, which include but are not limited to cardiovascular and renal diseases, retinopathy, and poor blood flow.4 Although the existing management strategies for T2DM have achieved great results, the tolerability and obvious side effects still cannot be ignored.5–7Natural products with fewer side effects that are relatively inexpensive to use as novel therapies to treat diabetes are the focus of recent research.8,9 Corni fructus, the dried fruit of Cornus officinalis Sieb. et Zucc., also known as “Shan Zhu Yu” in Chinese, is an important crude herb used in Chinese medicine that possesses a variety of biological activities, such as anti-hyperglycemia,10 anti-inflammation,11 anti-oxidant,12 anti-aging,13 and liver, neural and kidney protection.14,15 There are many chemical components in Corni fructus, including iridoid glycosides, flavonoids, organic acids, saccharides, and tannins.16 Iridoid glycosides are a group of active substance such as morroniside, loganin, cornuside and sweroside. Previously studies demonstrated that loganin had a protective effect against hepatic oxidative stress,17 morroniside showed effective anti-inflammatory properties in AMI rats,18 sweroside could ameliorate liver injury by decreasing oxidative damage and inhibiting the production of proinflammatory kinases,19,20 and cornuside has been reported to possess immunomodulatory and anti-inflammatory activities.21,22 However, the underlying mechanisms of the therapeutic potential of CIG for diabetes have yet to be elucidated.
IR, a remarkable feature of T2DM, which was defined as a reduction in the physiological level of insulin by cells or tissues. is.23 Insulin signal transduction begins with the binding of insulin to insulin receptor (INSR) and involves the fine regulation of phosphorylation and dephosphorylation of signal molecules in intracellular signal transduction.24,25 Tyrosine phosphorylation of insulin receptor substrate is induced through the combining of insulin and insulin receptor, followed by transduction of downstream enzymes, such as PI3K.26 PI3K is an intracellular phosphatidyl inositol kinase, with serine/threonine (Ser/Thr) kinase activity. A major effector of PI3K downstream signaling network is Akt, also named as PKB, a serine/threonine kinase.27 Studies have shown that PI3K–Akt/PKB pathway could be induced by insulin and act as an indispensable effector.28 Akt/PKB can activate a large number of downstream molecules, such as translocating glucose transporters (GLUTs), especially by inducing GLUT4 to cell membrane to increase glucose consumption.29 Therefore, any defect in the Akt/PKB pathway and downstream molecules may lead to IR.30 Overall, activation of the PI3K–Akt/PKB pathway is necessary to promote peripheral glucose uptake and utilization.
Under this background, this study intended to probe the therapeutic role of CIG against HFD–STZ induced diabetic mice. Further explored is the underlying mechanism of anti-diabetic effects conveyed by CIG.
2. Materials and methods
2.1. Chemicals and regents
Crude CF were collected in Foping (Shaanxi, China), as areas in which the best quality of the herbs can be guaranteed. Raw materials were authenticated macroscopically and microscopically according to The Pharmacopoeia of the People's Republic of China (2015 Edition). Voucher specimens were deposited at the herbarium at College of Life Science, Shaanxi Normal University, China (the specimen number is CMQDA 201700011).Streptozocin (STZ) was purchased from Sigma Chemical Co. (St Louis, MO, USA). Research Diets D12492 60 kcal% fat were purchased from Yes Service Biotech (Shanghai, China). Morroniside, loganin, sweroside, and cornuside were obtained from Sigma Chemical Co. (St Louis, MO, USA). All antibodies were supplied by Cell Signaling Technology (Danvers, MA, USA), and all other chemicals and reagents were of the highest commercially available grade.
2.2. Extraction of CIG
Corni fructus powder was extracted with 80% methyl alcohol (1![[thin space (1/6-em)]](https://www.rsc.org/images/entities/char_2009.gif) :20) for 9 min using an ultrasonic-microwave synergistic extraction system with a microwave power of 641 W and an ultrasonic power of 360 W. The pooled extract was filtered and the solvent was removed by a vacuum rotary evaporator. Dissolved the concentrate in distilled water and purified using D101 macroporous resin elution with 50% ethanol to obtain CIG. Quantification of CIG was performed by HPLC using a Shimadzu LC-2010A HPLC system (SHIMADZU, Kyoto, Japan). CIG was eluted with acetonitrile and 0.2% acetic acid, the flow rate was 1.0 mL min−1, the column temperature was 35 °C. The absorbance wavelength was set at 240 nm for quantification.
:20) for 9 min using an ultrasonic-microwave synergistic extraction system with a microwave power of 641 W and an ultrasonic power of 360 W. The pooled extract was filtered and the solvent was removed by a vacuum rotary evaporator. Dissolved the concentrate in distilled water and purified using D101 macroporous resin elution with 50% ethanol to obtain CIG. Quantification of CIG was performed by HPLC using a Shimadzu LC-2010A HPLC system (SHIMADZU, Kyoto, Japan). CIG was eluted with acetonitrile and 0.2% acetic acid, the flow rate was 1.0 mL min−1, the column temperature was 35 °C. The absorbance wavelength was set at 240 nm for quantification.
2.3. Animals
Seven-week-old male ICR mice (weight 18 ± 2 g) were obtained from the College of Medicine, Xi'an Jiaotong University (Xi'an, China). The mice were allowed to freely access to a standard laboratory rodent food and drinking water. All animals were maintained in a controlled environment at 25 ± 1 °C and 60 ± 5% relative humidity in a 12 h dark–light cycles and acclimatized for one week prior to use. All experiments using mice were performed in accordance with the National Institute of Health's Guide for the Care and Use of Laboratory Animals and were approved by the university's Institutional Animal Care and Use Committee of Shaanxi Normal University (Xi'an, China).2.4. Development of T2DM
Before the experiments, all animals were accommodated to the laboratory environment for one week. T2DM mouse model was induced according to the previously published method with some modifications.31 Excluding the normal control (NC) group fed with normal diet (standard laboratory rodent food), other mice with a high fat diet (HFD) with 60% kcal% fat for 4 weeks. To induce diabetes, HFD-fed mice were fasted for 12 h before intraperitoneal injection of STZ solution (in citrate buffer, pH 4.2–4.5) at a dose of 40 mg per kg body weight (bw), 5 times within one week; and the NC group received the citrate buffer alone in parallel. Seventy-two hours after the last injection, blood samples were removed from the tail vein of the over-night fasted mice. We elected mice with FBG >11.1 mmol L−1 for future study, which were recognized as T2DM.2.5. Experimental groups
After the T2DM model was built successfully, the diabetic mice were randomized into 5 groups of 10 mice each. Grouping and treatment protocol was listed in Fig. 1. All mice were feeding for four weeks in a drinking and free drinking water. All mice weight and fasting blood glucose (FBG) were measured every week during the experiment. On the 29th day of the experiment, the mice were fasting for the night and collecting blood samples via the retro-orbital sinus of mice and separation of serum by centrifugation and were promptly placed in an environment of −20 °C for later research. Following the mice were sacrificed via anaesthesia, tissues of pancreas, liver and muscle were carefully separated and washed with icy saline, and each part was fixed in 10% formalin (pH 7.4) for biochemical and histological examinations.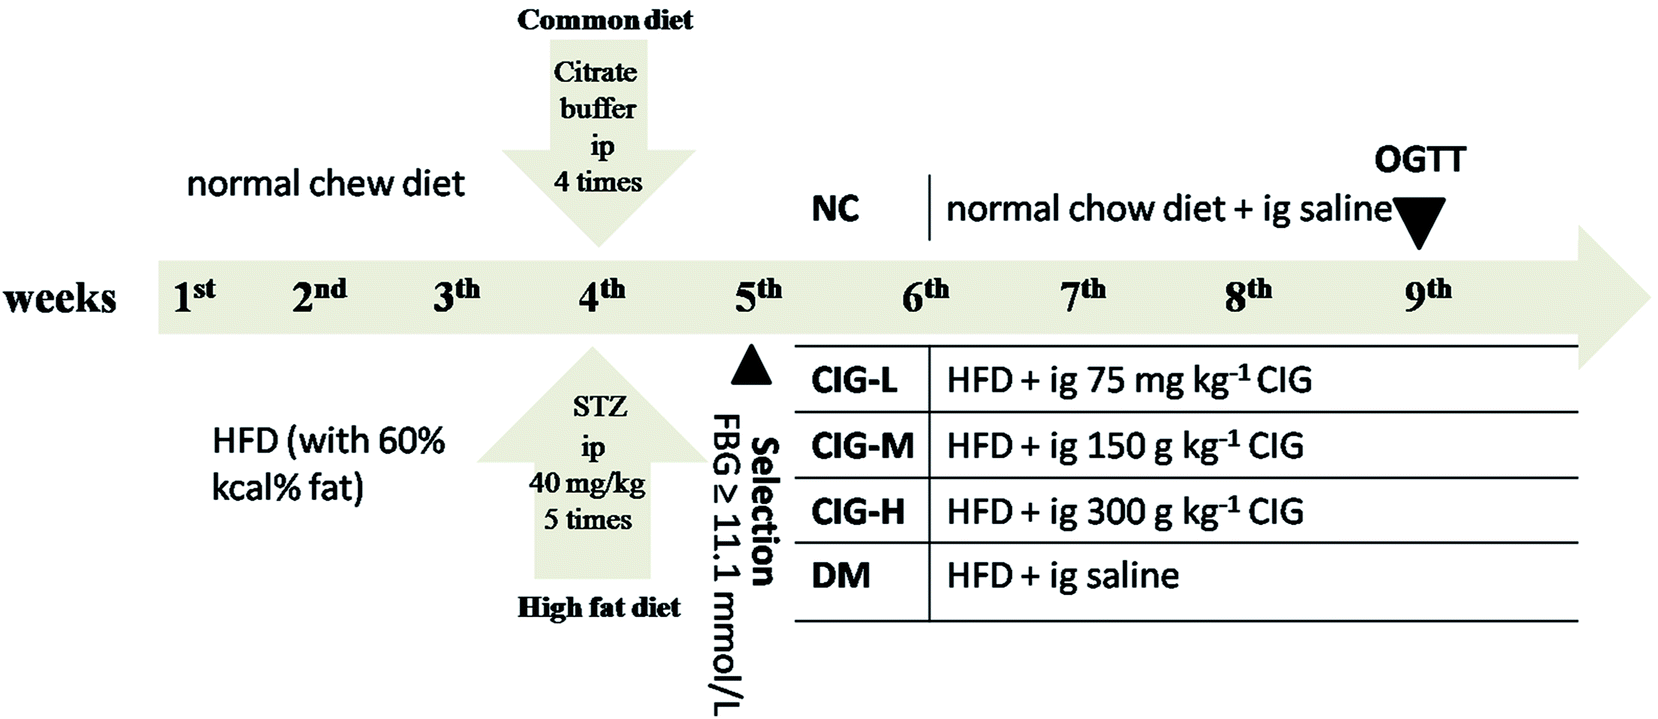 | ||
| Fig. 1 Experimental design. ip, intraperitoneal injection; ig, intragastric administration. | ||
2.6. Oral glucose tolerance test (OGTT)
OGTT was performed in overnight-fasted mice from all groups. Twenty minutes after sample administration (NC and DM groups were oral ingestion with normal saline), the mice were daily administered with glucose 2.0 g kg−1 bw. The samples of blood were harvested from the tail vein at 0 (before glucose administration), 30, 60, 120 and 180 min after glucose administration using One-Touch glucometer, which was purchased from HMD Bio Medical Co. (Taiwan, China). The result of OGTT was represented by an integrated area under the curve (AUC) calculated by GraphPad Prism version 6.0.2.7. Biochemical assay
Serum total cholesterol (TC), serum triglycerides (TG), low-density lipoprotein cholesterol (LDL-C), high-density lipoprotein cholesterol (HDL-C), superoxide dismutase (SOD), and methylene dioxyamphetamine (MDA) were measured using the marketing diagnostic kit (Nanjing Jiancheng Bioengineering Institute, China). The serum fasting insulin level (FINS, as biochemical makers for serum insulin) and inflammatory cytokines (tumor necrosis factor (TNF)-α, interleukin (IL)-6, C-reactive protein (CRP)) were determined by ELISA assay kits (Tianjin Anoric Bio-technology CO., Ltd, Tianjin, China). All measurements were carried out according to the manufacturer's protocol of the corresponding kits. The homeostasis model assessment-insulin sensitivity index (HOMA-IS) and homeostasis model assessment-insulin resistance index (HOMA-IR) were calculated following the formulas HOMA-IS = Ln (1/FINS × FBG), HOMA-IR = (FBG × FINS)/22.5, separately.2.8. H&E staining
Liver and pancreas from different groups were first fixed with 10% buffered formalin for 24 h, and then buried in paraffin. Final sliced and stained with hematoxylin and eosin (H&E). Histopathological changes of liver and pancreas were observed under a light microscope.2.9. Western-blotting
After the mice were sacrificed, the protein concentration in muscle samples was determined by a BCA protein assay kit (Thermo Scientific, Waltham, MA, USA). And western blot were analyzed according to the previously method with some modification.32 Briefly, following the tissue was lysed by (radio immunoprecipitation assay) RIPA buffer on ice, the protein samples were then separated on a 10% sodium dodecyl sulfate polyacrylamide gel electrophoresis (SDS-PAGE), transferred to nitrocellulose membrane (Millipore, MA, USA), and blotted with primary antibodies at 4 °C overnight. The following primary antibodies were used: INSR, p-INSR, PI3K, p-PI3K, Akt/PKB, p-Akt/PKB, and GLUT4. The membranes were shaken in a solution of secondary antibody (peroxidase-conjugated affinipure goat anti-rabbit or anti-mouse IgG) for 1 h. Infrared fluorescence were conducted on an Odyssey infrared imaging system (Li-cor Bioscience, Lincoln, NE, USA). Anti-β-actin was used to ensure equal loading. Quantification was performed using the computerized imaging program, Quantity One (Bio-Rad).2.10. Statistical analysis
Statistical analysis was performed using GraphPad.Prism.v.5.0. All determinations were done at least in triplicate and all were averaged. Values were expressed as means ± standard deviations (SD). Analysis of variance (ANOVA) was employed to determine the statistical significance. And a value of p < 0.05 was considered to be statistically significant.3. Results
3.1. HPLC analysis
As shown in Fig. 2 and Table 1, CIG was purified by a multistep purification procedure including EtOH extraction and D-101 macroporous adsorption resin purification. The contents of morroniside, loganin, sweroside, and cornuside at concentrations of 1.523%, 0.696%, 0.059%, and 0.169% of the dried fruit, respectively. The employed HPLC method was validated in performing the quantitative analysis (Table 2). These results for method validation suggested that the HPLC method established in our study was reliable for evaluating CIG of Corni fructus. | ||
| Fig. 2 HPLC chromatogram of (A) reference substances and (B) iridoid glycosides from Corni fructus. Peaks: 1, morroniside; 2, loganin; 3, sweroside; 4, cornuside. | ||
| Peak no. | Assigned identity | Retention time (min) | Contents in CIG (mg g−1) |
|---|---|---|---|
| 1 | Morroniside | 9.71 | 76.63 |
| 2 | Loganin | 13.62 | 25.26 |
| 3 | Sweroside | 14.16 | 2.98 |
| 4 | Cornuside | 26.14 | 8.45 |
| Chemical | Calibration curve | Correlation factor (r2) | Linearity (μg mL−1) | Precision RSD (%) | Repeatability RSD (%) | Recovery (%) |
|---|---|---|---|---|---|---|
| a These samples were subjected to HPLC analysis. The calibration curve was used to calibrate the concentration of various chemical constituents. The mean values were expressed here, and the standard error of the mean (SEM) values of the six tested chemicals were less than 5% of the mean. The calibration was repeated 3 times (n = 3). | ||||||
| Morroniside | Y = 3 × 10⁶x + 505234 | 0.9999 | 2.00–18.00 | 0.23 | 2.1 | 98.9 |
| Loganin | Y = 2 × 10⁶x + 332451 | 0.9999 | 1.00–8.00 | 0.05 | 1.6 | 99.2 |
| Sweroside | Y = 578827x − 487447 | 0.9997 | 0.10–1.60 | 0.25 | 1.7 | 100.2 |
| Cornuside | Y = 456367x − 7274.9 | 0.9996 | 0.40–2.80 | 0.19 | 2.2 | 98.7 |
3.2. Effect of CIG on body weight and organ index
In this study, the concentration of selected CIG extract dose (75, 150, 300 mg kg−1) were basing on previous studies,33 where the extracts researched have similar composition as CIG and show a hypoglycemic effect. The body weight of each group was shown in Table 3. The mice in DM group was significantly lighter than that of the NC group during the experiment period (p < 0.05). Diabetic mice that received 4 weeks of CIG were significantly increased in body weight compared to that of DM group (p < 0.05). After CIG gavage, the weight of the mice in this group began to increase, which could be due to the increase of unused fat-intake; however, these weights started to decrease after second week, which might be the result of diabetes severity.| Group | Body weight (g) | ||||
|---|---|---|---|---|---|
| Initial | 1 week | 2 week | 3 week | 4 week | |
| a Values are expressed as means ± SD of 10 mice in each group, where p < 0.05 denotes statistically significant difference with respect to. *, NC group; #, DM group. | |||||
| NC | 31.72 ± 2.26 | 32.49 ± 2.20 | 33.18 ± 1.54# | 34.22 ± 2.10# | 35.18 ± 2.60# |
| CIG-L | 30.50 ± 1.93 | 30.77 ± 0.63 | 30.75 ± 1.31 | 30.6 ± 0.78 | 30.45 ± 0.54 |
| CIG-M | 31.45 ± 0.88 | 31.80 ± 1.48 | 30.0 ± 1.62* | 30.5 ± 1.95 | 30.19 ± 2.27 |
| CIG-H | 31.33 ± 1.54 | 31.53 ± 1.36 | 30.78 ± 2.24* | 31.2 ± 2.66# | 31.12 ± 2.66# |
| DM | 31.62 ± 2.43 | 30.23 ± 2.48 | 29.5 ± 2.28* | 28.0 ± 1.97* | 27.3 ± 1.78* |
The liver, kidney and spleen index of group DM was significantly higher than that of group NC (p < 0.05). However, after administration of CIG for 4 weeks, CIG restraining these trends and the related tissue index returned to normal level (Fig. 3).
 | ||
| Fig. 3 Effects of CIG on organ weight index of experimental mice. (A) Liver index; (B) spleen index; (C) kidney index; NC, normal control group; CIG-L, diabetes mice treated with 75 mg kg−1 CIG per day; CIG-M, diabetes mice treated with 150 mg kg−1 CIG per day; CIG-H, diabetes mice treated with 300 mg kg−1 CIG per day; DM, diabetic mice treated with drinking water. We evaluated p < 0.05 denotes statistically significant difference with respect to. *, NC group; #, DM group. | ||
3.3. FBG, OGTT and FINS levels
Abnormal glycemic change is a typical characteristic of diabetes. As shown in Fig. 4, there was a notable increase in FBG of DM group when compared to NC group. Compared with the DM group, the FBG levels in CIG-treated group decreased significantly after 4 weeks. Accordingly, OGTT showed that the blood glucose reached its peak within 30 min and gradually decreased in the NC group. The CIG-H group exhibited a lower FBG than DM group at 30 min, which indicates that CIG effective inhibition of the peak of glucose. A lower AUC indicates the higher efficiency of OGTT and our data show that all the CIG groups had a remarkable low-level of AUC values compared to DM control. These results indicate that CIG have a positive effect on blood glucose regulation.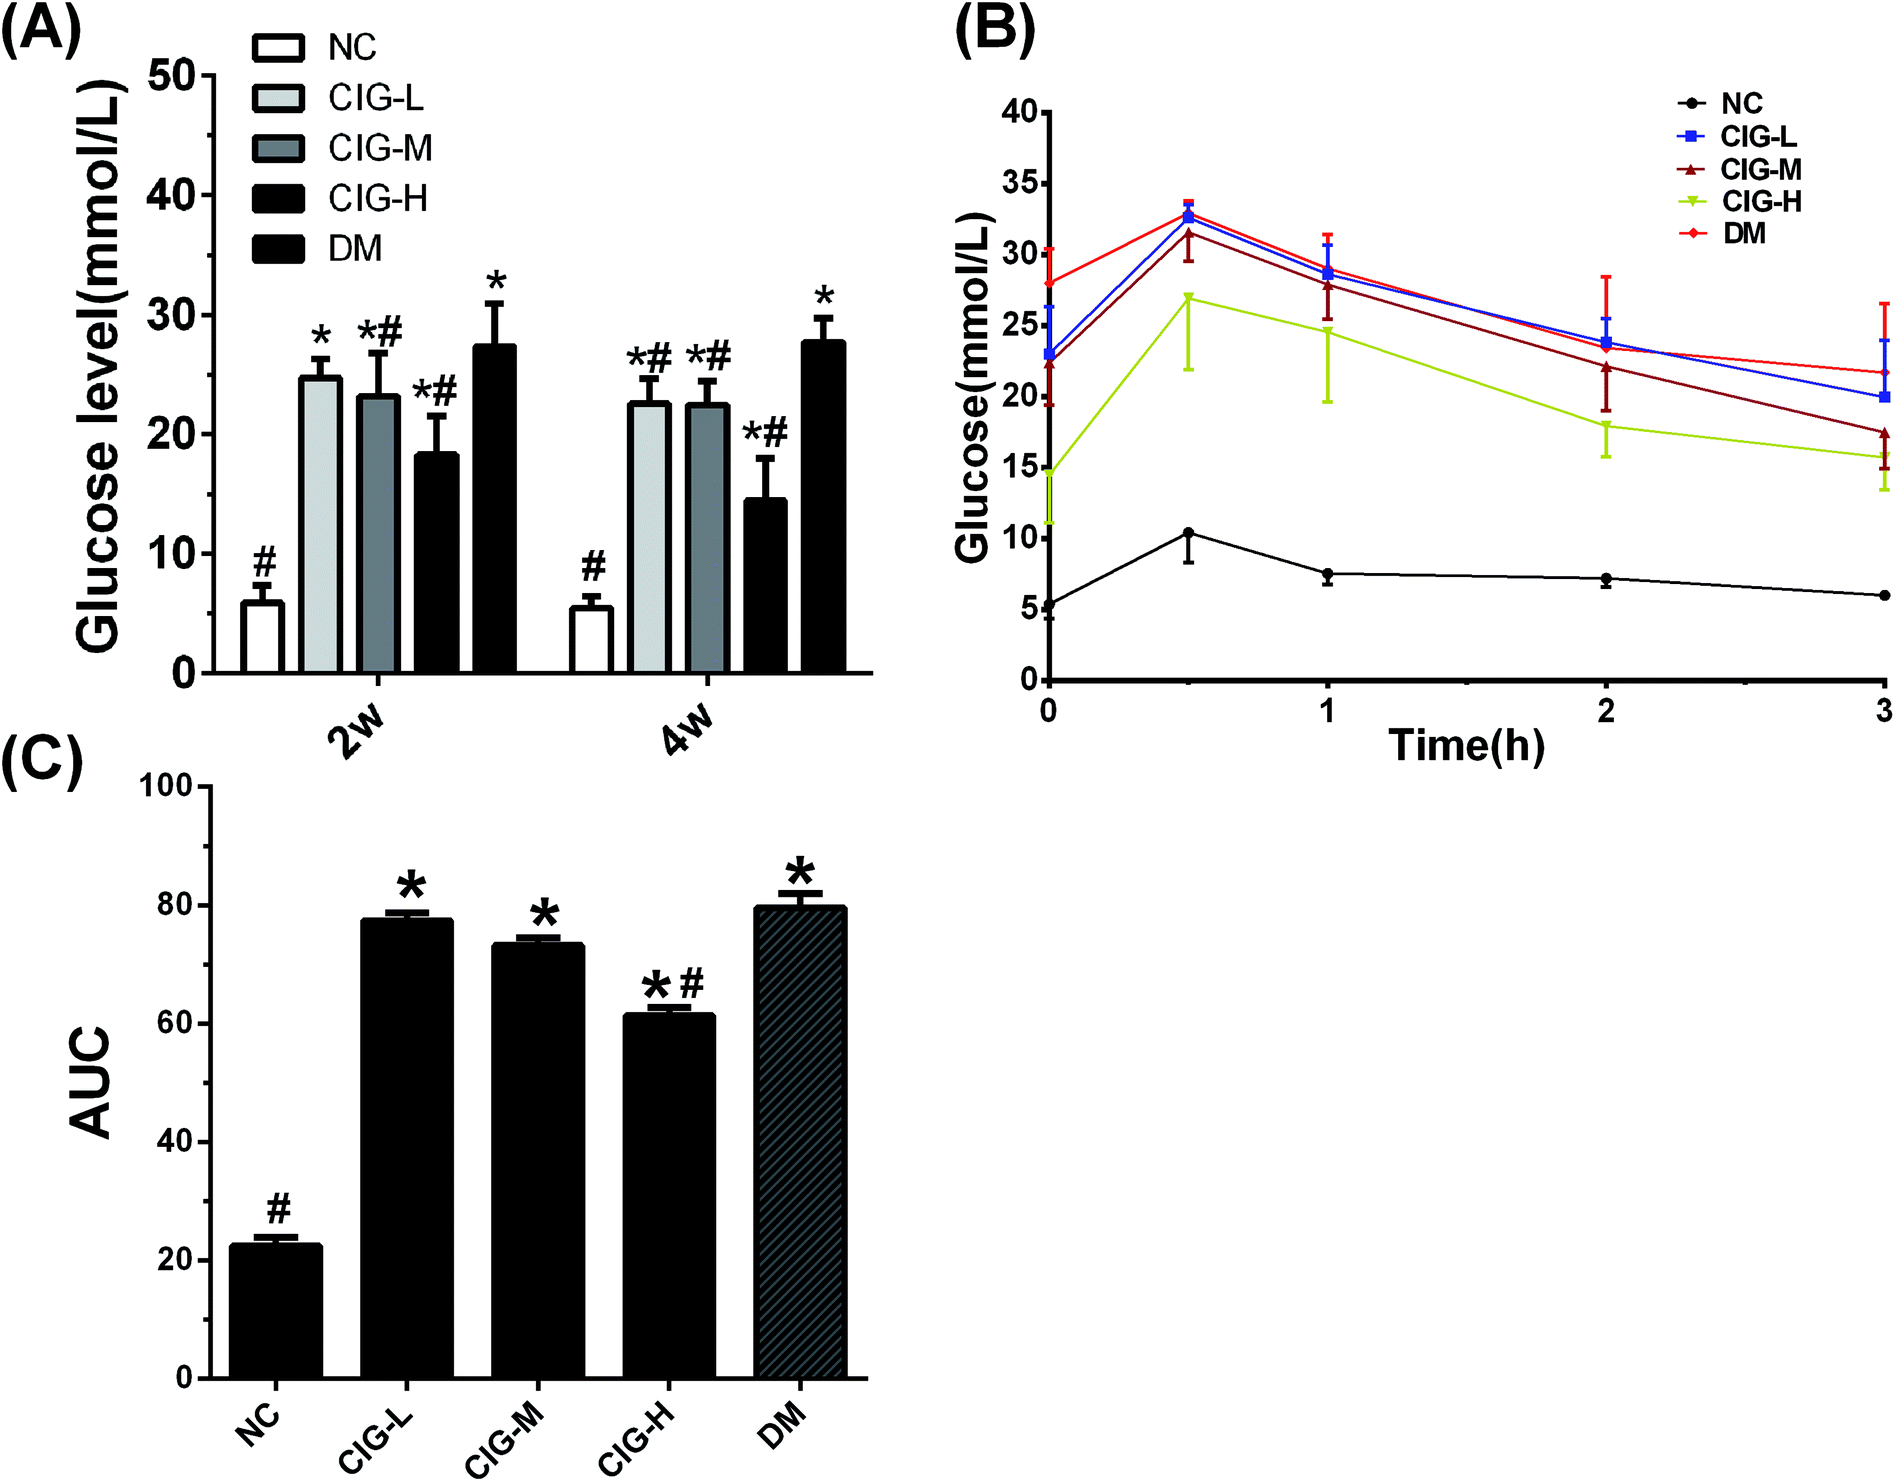 | ||
| Fig. 4 Effects of CIG on glycemic modulation of experimental mice. (A) FBG; (B) OGTT; (C) AUC; NC, normal control group; CIG-L, diabetes mice treated with 75 mg kg−1 CIG per day; CIG-M, diabetes mice treated with 150 mg kg−1 CIG per day; CIG-H, diabetes mice treated with 300 mg kg−1 CIG per day; DM, diabetic mice treated with drinking water. We evaluated p < 0.05 denotes statistically significant difference with respect to. *, NC group; #, DM group. | ||
FINS level of the mice in DM group was abnormally lower than the NC group (p < 0.05) (Table 4), which shown that the islets were destroyed. However, this trend has been markedly suppressed by CIG and the FINS level has been raised in CIG-treated groups (CIG-L increased by 11.11%, CIG-M increased by 29.20%, CIG-H increased by 50.85%, p < 0.05). In addition, the study investigated whether or not CIG could exert an insulin sensitivity and resisting activity in T2DM mice. As shown in Table 4, in the presence of CIG, the diabetic mice showed a tendency of enhanced HOMA-IS and HOMA-IR. These results indicated that CIG ameliorates IR in diabetic mice.
| NC | CIG-L | CIG-M | CIG-H | DM | |
|---|---|---|---|---|---|
| a Data are expressed as the means ± standard deviation (SD) for 10 mice in each group, where p < 0.05 denotes statistically significant difference with respect to, *, NC group, #, DM group. HOMA-IR = (FBG × FINS)/22.5. HOMA-IS = Ln (1/FINS × FBG). | |||||
| FINS (mIU L−1) | 11.02 ± 1.23# | 7.80 ± 0.89* | 9.07 ± 1.15*# | 10.59 ± 0.70# | 7.02 ± 0.50* |
| HOMA-IS | −4.06 ± 0.21# | −5.26 ± 0.10* | −5.18 ± 0.11*# | −4.94 ± 0.20*# | −5.42 ± 0.16* |
| HOMA-IR | 2.87 ± 0.45# | 8.05 ± 1.04*# | 7.69 ± 0.68*# | 6.30 ± 0.80*# | 9.10 ± 0.59* |
3.4. Effects of CIG on serum lipid profiles of diabetic mice
Diabetes patients often have disorders in the lipid metabolism. To test whether CIG would have a protective effect on lipid metabolism, the effects of CIG on biochemical indicators of blood lipid in experimental mice are summarized in Fig. 5. TC, TG and LDL-C levels of DM were significantly enhanced compared with that of NC. Such levels decreased after the administration of CIG. On the other hand, while HDL-C level of DM remarkably declined compared with that of NC, such level of those administered with CIG increased. These results show that administration of CIG could ameliorates the lipid profiles of diabetic mice especially at the dose of 150 and 300 mg kg−1.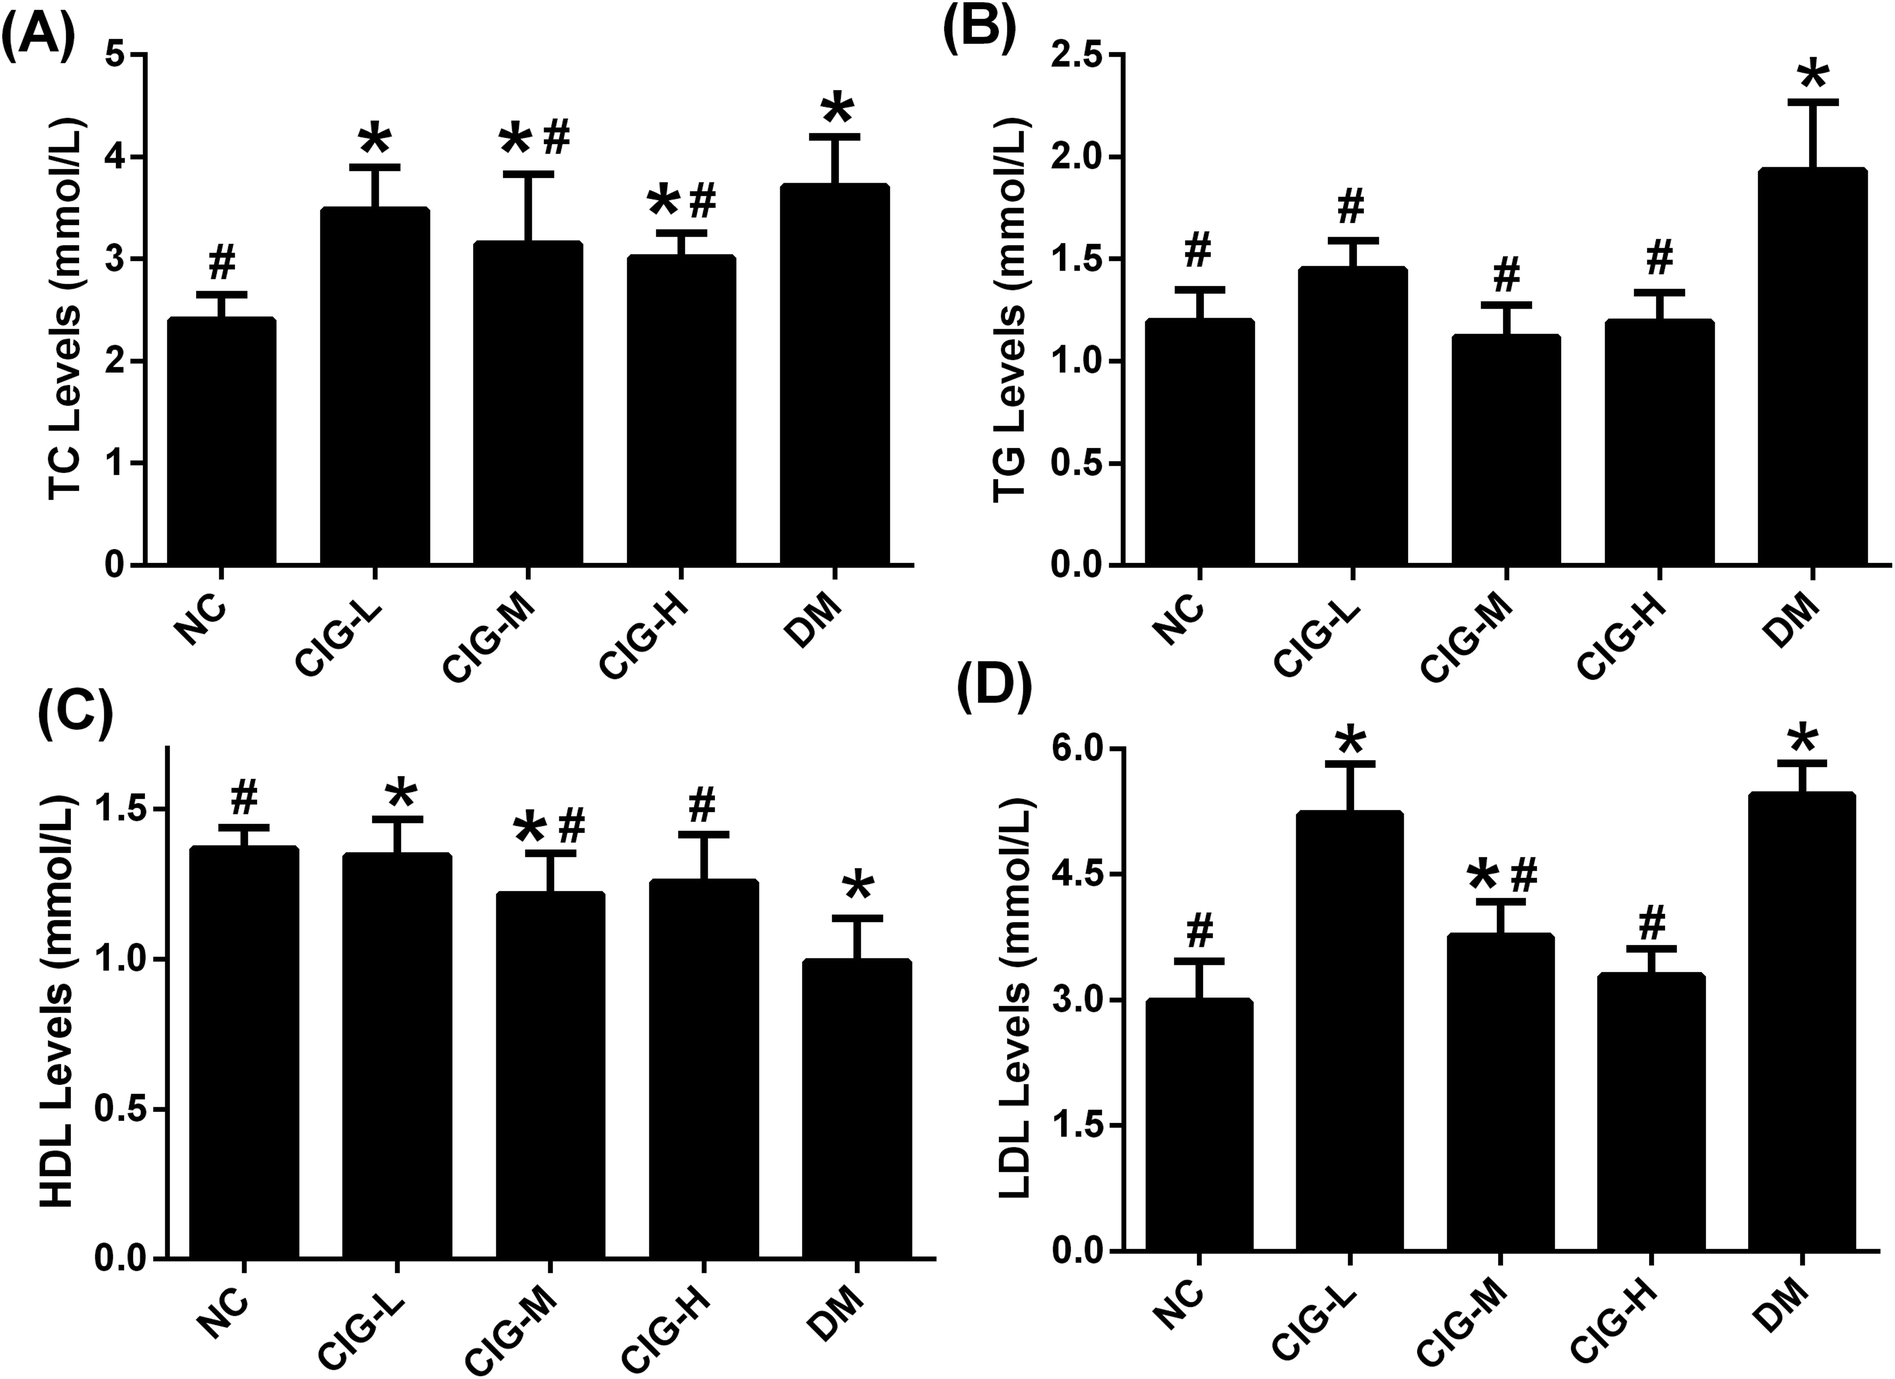 | ||
| Fig. 5 The effects of CIG on the serum lipid profiles of experimental mice. (A) TC; (B) TG; (C) HDL; (D) LDL; NC, normal control group; CIG-L, diabetes mice treated with 75 mg kg−1 CIG per day; CIG-M, diabetes mice treated with 150 mg kg−1 CIG per day; CIG-H, diabetes mice treated with 300 mg kg−1 CIG per day; DM, diabetic mice treated with drinking water. We evaluated p < 0.05 denotes statistically significant difference with respect to. *, NC group; #, DM group. | ||
3.5. The effects of CIG on inflammatory cytokines
As abnormalities in inflammation is another characteristic of diabetes, we also analyzed the levels of the inflammatory cytokines, including IL-6, TNF-α, and CPR in the liver of experimental mice. Our results showed that under the treatment of CIG at 150 mg kg−1 (CIG-M) and 300 mg kg−1 (CIG-H), the expression of IL-6, TNF-α and CRP were significantly reduced compared with DM control (Fig. 6). These data indicates that CIG has the ability to improve the inflammatory damage of the liver.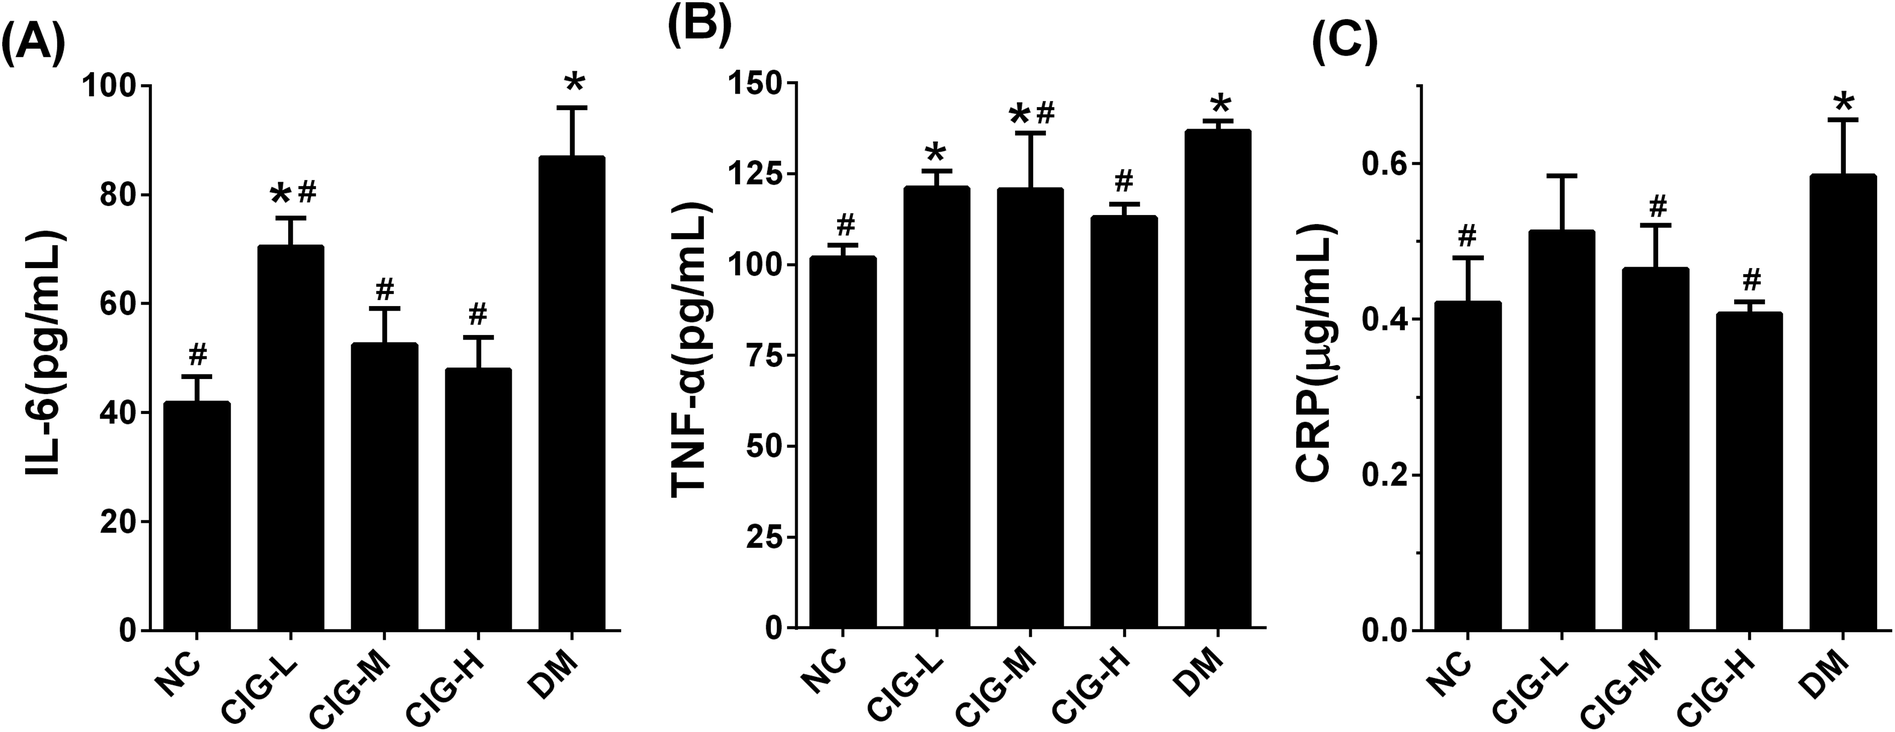 | ||
| Fig. 6 The effects of CIG on liver inflammatory cytokines of experimental mice. (A) Il-6; (B) TNF-α; (C) CRP. NC, normal control group; CIG-L, diabetes mice treated with 75 mg kg−1 CIG per day; CIG-M, diabetes mice treated with 150 mg kg−1 CIG per day; CIG-H, diabetes mice treated with 300 mg kg−1 CIG per day; DM, diabetic mice treated with drinking water. We evaluated p < 0.05 denotes statistically significant difference with respect to. *, NC group; #, DM group. | ||
3.6. Effects of CIG on SOD and MDA level in liver
MDA is one of the important products of lipid peroxidation, and SOD is an important antioxidant enzyme in organism. The content of MDA and SOD are common used to reflect the degree of lipid peroxidation. As shown in Fig. 7, the level of MDA in DM group was markedly enhanced compared with NC group. After treat with CIG, the activity of MDA in CIG-M and CIG-H was obviously lower than that in DM (p < 0.05). Opposite results were observed regarding in the activities of SOD, which plays a pivotal role in the oxidation and antioxidant balance. However, there was no significant difference in the SOD and MDA activity of the CIG-L when compared with that in group DM.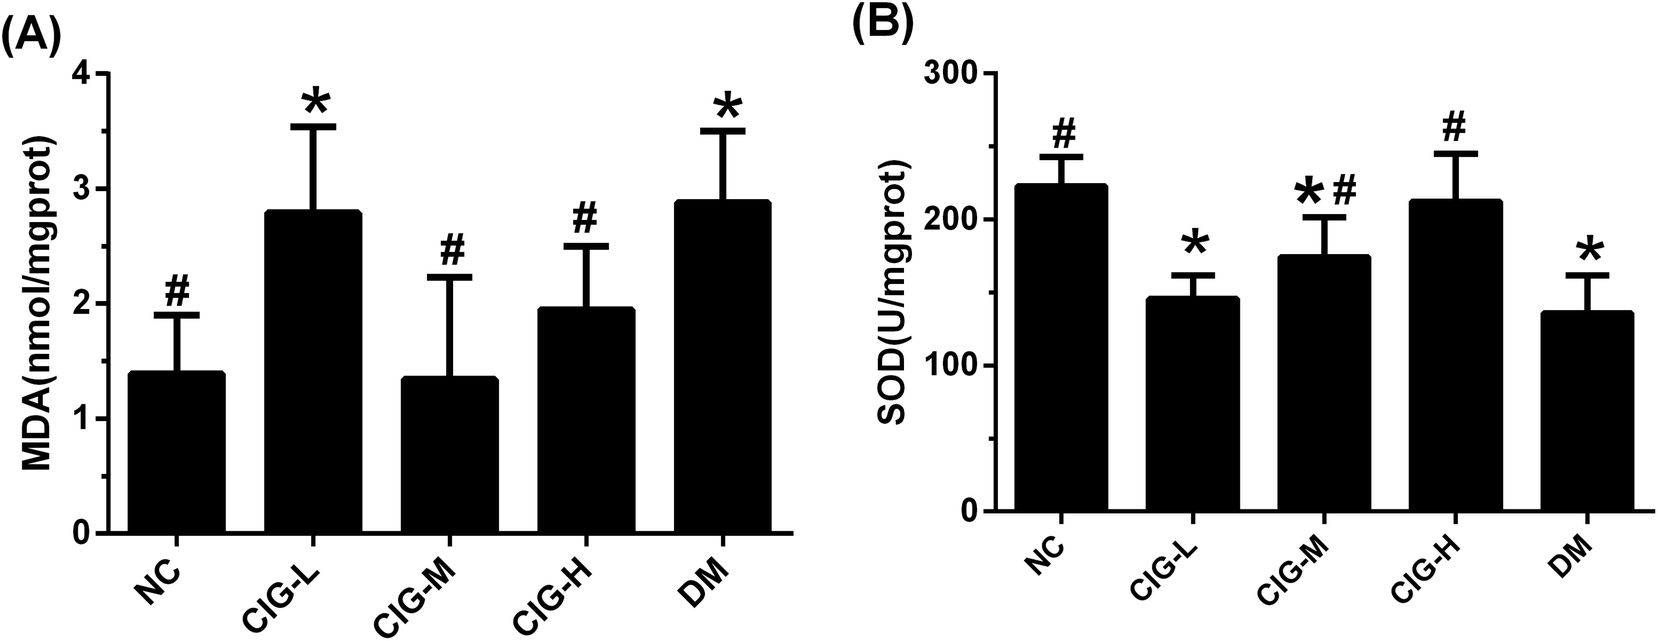 | ||
| Fig. 7 The effects of CIG on liver oxidative stress related factors of experimental mice. (A) MDA; (B) SOD; NC, normal control group; CIG-L, diabetes mice treated with 75 mg kg−1 CIG per day; CIG-M, diabetes mice treated with 150 mg kg−1 CIG per day; CIG-H, diabetes mice treated with 300 mg kg−1 CIG per day; DM, diabetic mice treated with drinking water. We evaluated p < 0.05 denotes statistically significant difference with respect to. *, NC group; #, DM group. | ||
3.7. CIG improved histopathological damage in the liver and pancreas
Histopathological analyses revealed that STZ induces severe injury to the liver and pancreas (Fig. 8). Liver from mice of the NC group displayed a complete and clear structure, normal and regular hepatocytes, and uniform cytoplasm. By contrast, DM mice displayed severe damage with a disorder of the hepatocytes and the cytoplasm appeared as a vacuole. The CIG treatments significantly prevented the damage to the liver (Fig. 8A)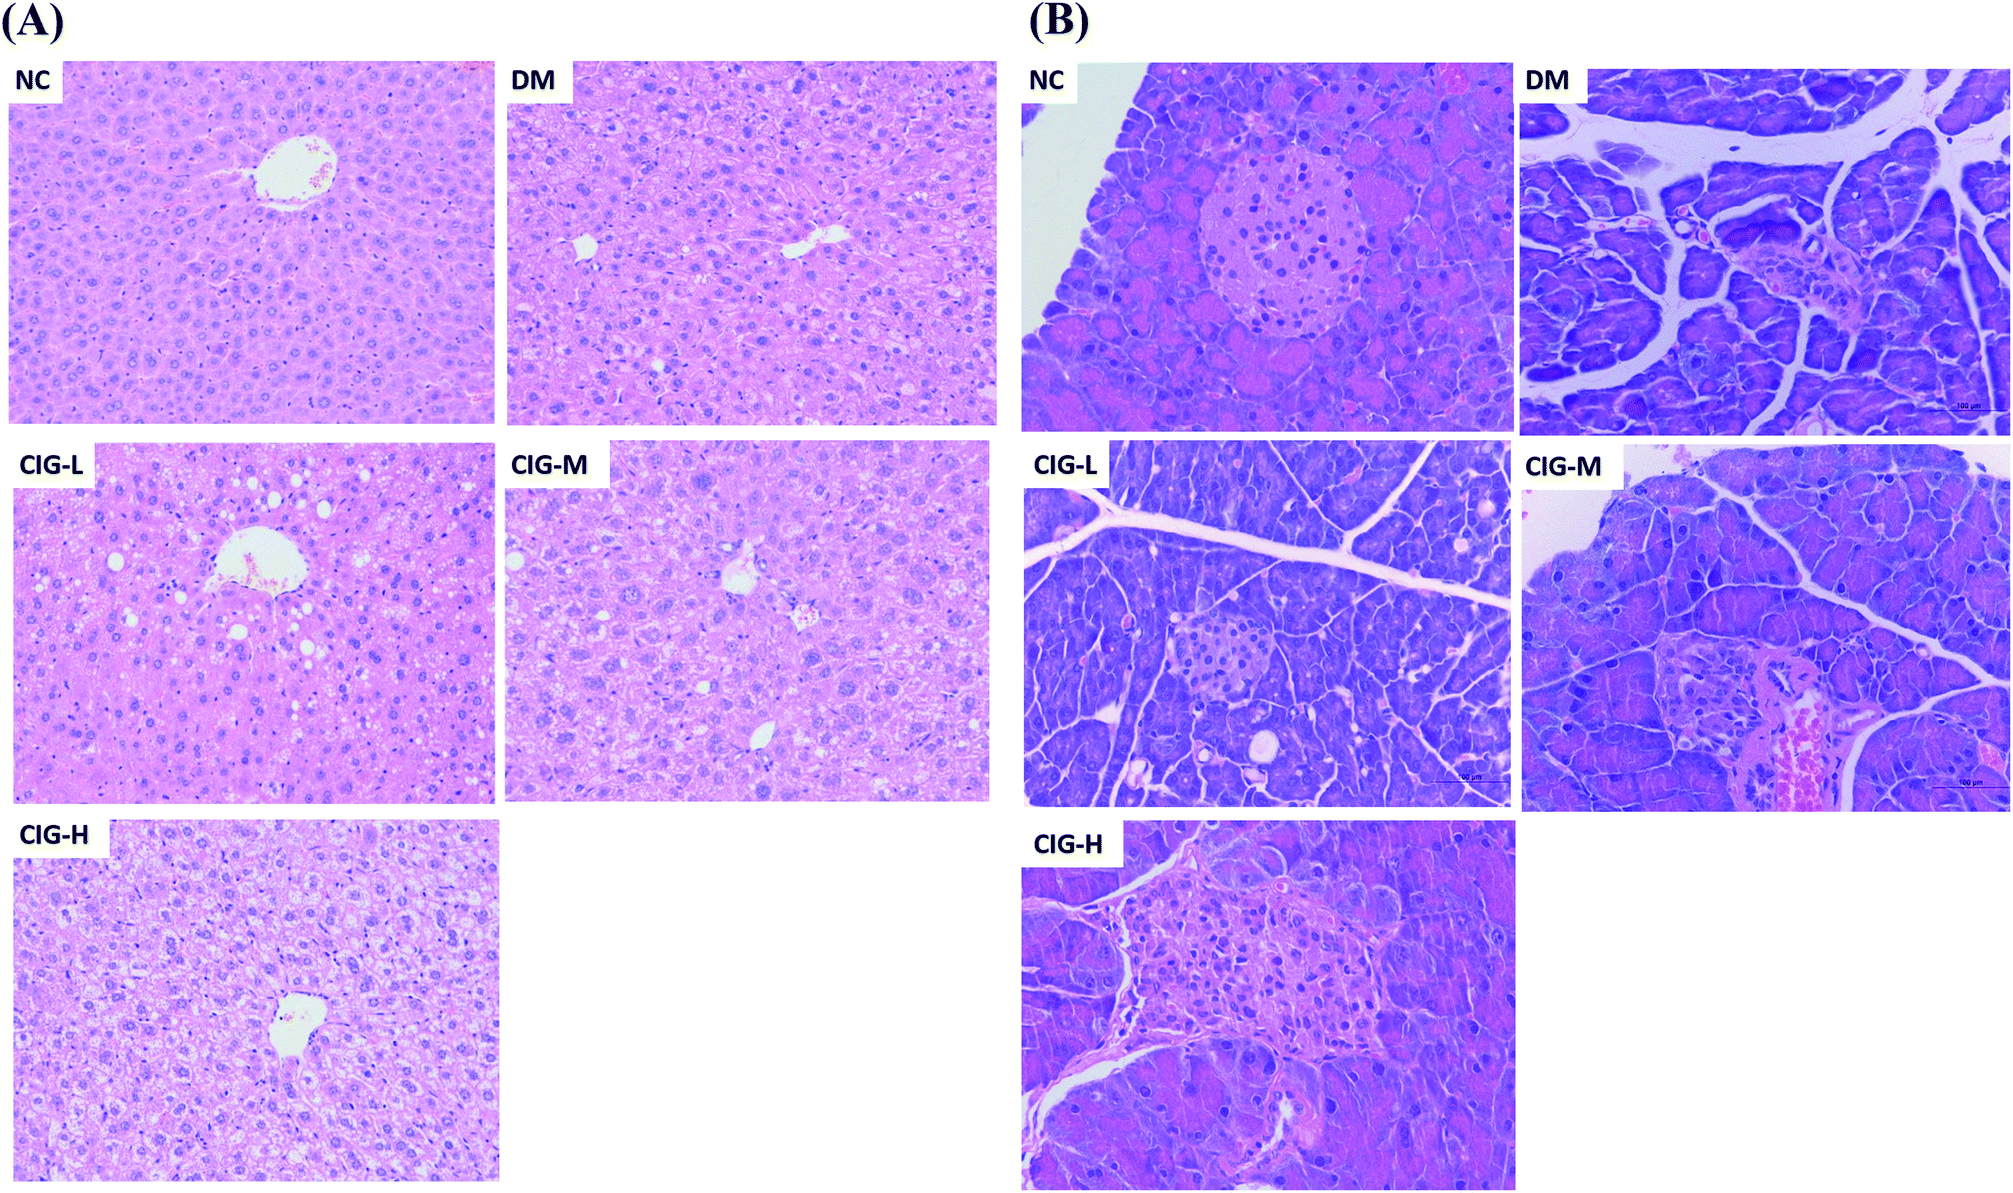 | ||
| Fig. 8 Histopathological changes in the liver (A) (HE staining 200×) and pancreas (B) (HE staining 400×). | ||
It had been generally believed that IR is associated with insufficient insulin secretion that can induce the damages on pancreatic β-cells.34 The results of the pancreatic pathology are shown in Fig. 8B. Group NC had complete pancreatic structure and a large number of neatly arranged islet beta cells. In opposite, pancreatic cells in DM group were injured obviously, focal necrosis and with sparse. However, CIG-treated groups were alleviating the injury in different degrees. All the histopathological results showed that CIG could delay and treat the damage of liver and pancreas, and have protective effects on HFD–STZ induced diabetic mice. Therefore, CIG could be a potential resource for the prevention and treatment of diabetes.
3.8. CIG promoted INSR, PI3K, Akt/PKB, and GLUT4 phosphorylation in skeletal muscle of diabetic mice
As one of the major pathogenic mechanism of diabetes, IR results from a variety of factors.35 IR occurs when binding of insulin and insulin receptor is compromised or when signal transduction from the insulin receptor is not completed.36 INSR, PI3K, Akt/PKB and GLUT4 are key molecules involved in glucose uptake and in the signal transduction pathway triggered by insulin. To study the mechanistic effect of CIG on IR, western blot analysis of INSR, PI3K, Akt/PKB, and GLUT4 protein levels in skeletal muscle were carried out. Our data showed that the phosphorylation of these four proteins in skeletal muscle was significantly decreased in DM compared with the group of NC, while CIG-H restored the expression of INSR, PI3K, Akt/PKB, and GLUT4 (Fig. 9).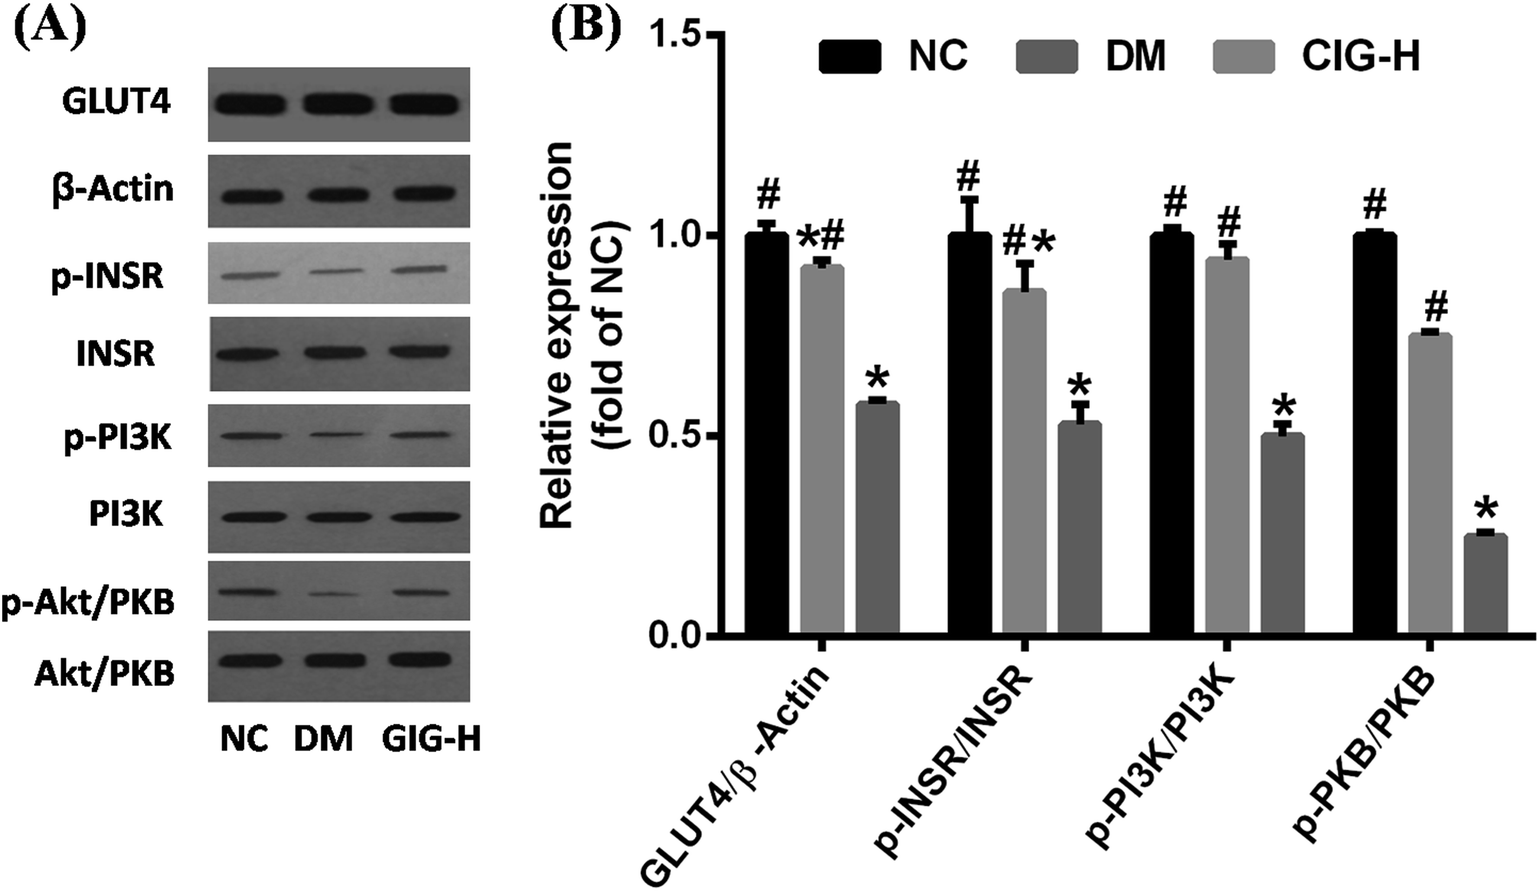 | ||
| Fig. 9 Protein status and gene expressions of key enzymes of glucose metabolism in skeletal muscle. NC, normal control group; CIG-H, diabetes mice treated with 300 mg kg−1 CIG per day; DM, diabetic mice treated with boiled water. We evaluated p < 0.05 denotes statistically significant difference with respect to. *, NC group; #, DM group. | ||
4. Discussion
Earlier studies have shown Corni fructus that exhibits immune regulating function, anti-shock effects and protective effect on experimental diabetic nephropathy.37,38 Another work has also raised the possibility that iridoid glycosides might achieve anti-diabetic effect by inhibiting the phosphorylase of glycogen,39 in particular, morroniside was suggested to play an important role in preventing and/or postponing the occurrence of diabetic kidney disease. According to the previous studies, the contents of morroniside, sweroside, loganin and cornuside in Corni fructus were very rich.40 Thus, we could assume that CIG not only possesses effects similar to those of iridoid glycosides, but many also have other functions beyond the extracted CIGs. In order to develop and utilize of CIG to the extent of industrial level, the effects of CIG on diabetes were studied.In this paper we show that CIG reduces the severity of HFD–STZ induced diabetes through the modulation of the insulin signaling pathway. First of all, ICR mice became diabetes mellitus induce by HFD and multiple low-dose STZ injections.41 After the diabetes model was established, CIG gavage was used at the doses of 75 (low dose), 150 (medium dose) and 300 (high dose) mg per kg per day in the experiment. HFD/STZ-induced diabetic mice administrated with CIG daily were investigated for the effects on various parameters, including body weight, FBG, lipid level, FINS, antioxidant ability, inflammatory cytokines and other parameters involving liver, pancreas and skeletal muscle. As shown in Table 3, while body weights of the CIG-treated HFD/STZ-induced diabetic mice increases, the increase of FBG levels was significantly suppressed (Fig. 4A). This result suggested that CIG may delay dietary carbohydrates' absorption, resulting the blood glucose level decrease.
Because impaired OGTT is an important criterion for diabetes. The OGTT was thus conducted and the results were shown in Fig. 4B. Reports have previously demonstrated the beneficial action of Corni fructus on diet-induced IR and glucose intolerance.42 In this research, OGTT indicated that the AUC of glucose tolerance in CIG was lower appreciably than that in the DM (p < 0.05) (Fig. 4B and C), showing that CIG has an effective improvement of glucose tolerance in diabetic mice. IR is the main symptom of T2DM, which is related to the injury of insulin secretion and hyperglycemia caused by STZ injection. In this research, the insulin levels in group CIG were significantly higher than those in group DM, suggesting that CIG stimulates insulin secretion in islets of diabetic mice. IR was defined as HOMA-IR > 2.6,43–45 a higher level of HOMA-IR and lower HOMA-IS showed the dysfunction of β-cell in DM group mice (Table 4). However, the HOMA-IR and HOMA-IS levels of all CIG mice were significantly reduced and increased, demonstrating that CIG could ameliorate β-cell function and IR.
Moreover, cinnamon polyphenols longstanding IR will also interfere with the metabolism of glucose and lipid, leading to a further rise in glycolipid levels.46 Hyperlipidemia and dyslipidemia are closely related to diabetes, which is a metabolic disorder caused by diabetes.47 In this research, CIG intake obviously depressed TC, TG levels and increased HDL levels in the mice of DM group (Fig. 5). Elevated levels of TC and TG are associated with high diabetes risk, while increased HDL levels can alleviate diabetes.46
As we all know, oxidative stress plays a key role in the pathogenesis of diabetes and his complications.48,49 And some cytokines like IL-6, TNF-α and CRP, also have been related to the risk of developing T2DM and cardiovascular diseases that are strongly associated with IR and body fat amount.50 Oxidative stress and inflammation can interact, IL-6 and TNF-α can stimulate the production of reactive oxygen species, which could activate a variety of signal transduction mechanisms in the cell, and leads to IR eventually.51 Consistently, DM mice herein had markedly enhanced lipid peroxidation product MDA, and reduced activities of antioxidant enzymes SOD.52,53 In the present study, we found that CIG could inhibit the expression of IL-6, TNF-α, CRP and MDA, and increase the SOD levels in the liver. These results suggest that CIG blocks the pathogenesis of diabetes by inhibiting the production of pro-inflammatory cytokines.
Aside from the IR of liver, the IR of muscle and adipose are the two other main affected organs in diabetes. Skeletal muscle plays an important role in glucose and lipid homeostasis via regulation of the insulin signaling pathway.54 To clarify the mechanism of CIG in treating diabetes, we detected the mRNA and protein expression of the main targets of the insulin transduction pathway in skeletal muscle. Insulin exerts its action through the activation of PI3K by the INSR. INSR is activated by tyrosine phosphorylation and is the central mediator in the insulin response upstream of PI3K.55 Many studies have shown that Akt/PKB plays an important role in insulin action, including increased glucose uptake and GLUT4 translocation.56 Therefore, increase of Akt/PKB activity was considered to be closely connected to the increase of glucose uptakes and insulin signaling cascade activation, and Akt/PKB is the primary target of PI3K-generated signals.28 Akt/PKB activates AS160 (Akt substrate, 160 kDa), which promotes the translocation of GLUT4 and absorption of glucose in muscle cells. More recently, evidence showed that increasing the secretion of GLUT4 in adipose or skeletal muscles reverse β-cell from necrosis.57 Polysaccharides from Ganoderma lucidum were also shown to be involved in the modulation of GLUT4 expression in the treatment of diabetic mice.58 Therefore, PI3K–Akt/PKB signaling pathway plays a key part in metabolic effect.59 The lower expression of PI3K, Akt/PKB and GLUT4 expression levels in STZ–HFD induced diabetic mice compared to control mice suggested that glucose uptake via GLUT4 into cells through PI3K–Akt/PKB signal pathway was inhibited. In our findings, CIG could increase the protein expression of INSR, PI3K, Akt/PKB, and GLUT4 in skeletal muscle, demonstrating that the hypoglycemic activity of CIG is mediated by the PI3K–Akt/PKB signaling pathway, which could improve IR.
5. Conclusion
In conclusion, we demonstrate that CIG has a hypoglycemic, hypolipidemic and antioxidant effects in diabetes. The possible mechanism of this effect may be related to the activation of the PI3K–Akt/PKB signaling pathway. CIG could be developed as a potential therapeutic treatment for diabetes.Conflicts of interest
The authors declare no competing financial interest.Acknowledgements
This work received supported from National Key Technologies R & D Program for Modernization of Traditional Chinese Medicine (Grant No. 2017YFC1701300) and Major Project of Shaanxi Province, China (Grant No. 2017ZDXM-SF-005).References
- I. D. Federation, IDF Diabetes Atlas,http://www.idf.org/diabetesatlas.
- A. D. Association, Diabetes Care, 2017, vol. 40, p. S11 Search PubMed.
- A. D. Association, Diabetes care 2014, 2014, vol. 37, pp. S14–S80 Search PubMed.
- J. L. Ríos, F. Francini and G. R. Schinella, Planta Med., 2015, 81, 975 CrossRef PubMed.
- W. Ma, K. J. Wang, C. S. Cheng, G. Q. Yan, W. L. Lu, J. F. Ge, Y. X. Cheng and N. Li, J. Ethnopharmacol., 2014, 153, 840 CrossRef PubMed.
- K. W. Ong, A. Hsu and B. K. H. Tan, Biochem. Pharmacol., 2013, 85, 1341 CrossRef PubMed.
- G. A. Nichols, T. M. Kimes, J. B. Harp, T. D. Kou and K. G. Brodovicz, Diabetes Care, 2012, 35, 495–497 CrossRef PubMed.
- W. Tang, S. Li, Y. Liu, M. T. Huang and C. T. Ho, J. Funct. Foods, 2013, 5, 1784–1793 CrossRef.
- F. F. Anhê, Y. Desjardins, G. Pilon, S. Dudonné, M. I. Genovese, F. M. Lajolo and A. Marette, PharmaNutrition, 2013, 1, 105–114 CrossRef.
- H. J. Kim and Y. C. Kim, Mol. Cell. Toxicol., 2010, 6, 135–142 CrossRef.
- Y. H. Sung, H. K. Chang, S. E. Kim, Y. M. Kim, J. H. Seo, M. C. Shin, M. S. Shin, J. W. Yi, D. H. Shin and H. Kim, J. Med. Food, 2009, 12, 788 CrossRef PubMed.
- S. H. Lim, Afr. J. Pharm. Pharmacol., 2011, 5, 506–514 CrossRef.
- D. C. Shin, G. C. Kim, S. Y. Song, H. J. Kim, J. C. Yang and B. A. Kim, Korean J. Herbology, 2013, 28, 95–100 CrossRef.
- X. Wang, J. Liu, N. A. Jin, D. Xu, J. Wang, Y. Han and N. Yin, Exp. Ther. Med., 2015, 9, 1773 CrossRef PubMed.
- C. H. Park, J. S. Noh, J. H. Kim, T. Tanaka, Q. Zhao, K. Matsumoto, N. Shibahara and T. Yokozawa, Biol. Pharm. Bull., 2011, 34, 1559 CrossRef.
- M. H. Lin, H. K. Liu, W. J. Huang, C. C. Huang, T. H. Wu and F. L. Hsu, J. Agric. Food Chem., 2011, 59, 7743–7751 CrossRef PubMed.
- H. P. Chan, T. Tanaka, H. K. Ji, E. J. Cho, J. C. Park, N. Shibahara and T. Yokozawa, Toxicology, 2011, 290, 14–21 CrossRef PubMed.
- B. Yu, G. Zhang, Y. An and W. Wang, Korean J. Physiol. Pharmacol., 2018, 22, 17 CrossRef PubMed.
- J. Y. Tae, J. S. Chul, H. Jae Sung and K. J. Hee, Chem.–Biol. Interact., 2015, 238, 33–39 CrossRef PubMed.
- Y. M. He, S. Zhu, Y. W. Ge, K. Kazuma, K. Zou, S. Q. Cai and K. Komatsu, J. Nat. Med., 2015, 69, 303–312 CrossRef PubMed.
- D. G. Kang, M. K. Moon and A. S. Lee, Biol. Pharm. Bull., 2007, 30, 1796 CrossRef.
- W. L. Jiang, X. G. Chen, H. B. Zhu, J. Hou and J. W. Tian, Pharmacology, 2009, 84, 162–170 CrossRef PubMed.
- D. B. Savage, K. F. Petersen and G. I. Shulman, Physiol. Rev., 2007, 87, 507–520 CrossRef PubMed.
- S. E. Kahn, R. L. Hull and K. M. Utzschneider, Nature, 2006, 444, 840 CrossRef PubMed.
- V. T. Samuel and G. I. Shulman, Cell, 2012, 148, 852–871 CrossRef PubMed.
- A. R. Saltiel and J. E. Pessin, Trends Cell Biol., 2002, 12, 65–71 CrossRef PubMed.
- J. A. Engelman, Nat. Rev. Cancer, 2009, 9, 550–562 CrossRef PubMed.
- Y. Min, R. Yan, L. Zhimin, T. Chenchen, J. Yanjun, L. Yerui, Z. Tingting, W. Shaobo, L. Hua and Y. Gangyi, Cell. Signalling, 2015, 27, 2201 CrossRef PubMed.
- G. R. Gandhi, G. Jothi, P. J. Antony, K. Balakrishna, M. G. Paulraj, S. Ignacimuthu, A. Stalin and N. A. Al-Dhabi, Eur. J. Pharmacol., 2014, 745, 201 CrossRef PubMed.
- Z. Zhang, H. Liu and J. Liu, Diabetes Res. Clin. Pract., 2017 Search PubMed , S0168-8227(17)30315-7.
- Z. Chen, C. Wang, Y. Pan, X. Gao and H. Chen, Food & Function, 2018 Search PubMed.
- X. Su, X. Wang, K. Zhang, S. Yang, Q. Xue, P. Wang and Q. Liu, Gen. Physiol. Biophys., 2014, 33, 295 CrossRef PubMed.
- Y. Chen, Y. Wu, X. Gan, K. Liu, X. Lv, H. Shen, G. Dai and H. Xu, J. Ethnopharmacol., 2016, 194, 850–860 CrossRef PubMed.
- S. Torii, C. Kubota, N. Saito, A. Kawano, N. Hou, M. Kobayashi, R. Torii, M. Hosaka, T. Kitamura and T. Takeuchi, J. Biol. Chem., 2018, 5920–5933 CrossRef PubMed.
- F. Guerrero-Romero and M. Rodríguez-Moran, Eur. J. Intern. Med., 2014, 25, 265–269 CrossRef PubMed.
- A. M. Melo, R. O. Benatti, L. M. Ignaciosouza, C. Okino, A. S. Torsoni, M. Milanski, L. A. Velloso and M. A. Torsoni, Metab., Clin. Exp., 2014, 63, 682–692 CrossRef PubMed.
- R. Q. Yao, L. Zhang, W. Wang and L. Li, Brain Res. Bull., 2009, 79, 69 CrossRef PubMed.
- H. Q. Xu and H. P. Hao, Biol. Pharm. Bull., 2004, 27, 1014–1018 CrossRef.
- H. B. Vaidya, A. A. Ahmed, R. K. Goyal and S. K. Cheema, J. Pharm. Pharm. Sci., 2013, 16, 530–540 Search PubMed.
- K. Du, J. Li, Y. Bai, M. An, X. M. Gao and Y. X. Chang, Food Chem., 2018, 190–196 CrossRef PubMed.
- E. R. Gilbert, Z. Fu and D. Liu, Exp. Diabetes Res., 2011, 2011, 416254 CrossRef PubMed.
- H. J. Kim, K. S. Kim, T. J. Lee and Y. C. Kim, Toxicol. Res., 2009, 25, 93–99 CrossRef.
- R. Velagaleti, P. Gona, M. Chuang, C. Salton, C. Fox, S. Blease, S. Yeon, W. Manning and C. O'Donnell, Circ. Cardiovasc. Imaging, 2010, 3, 257–263 CrossRef PubMed.
- R. J. Karne, H. Chen and M. J. Quon, Diabetes Care, 2004, 27, 1247 CrossRef PubMed.
- P. D. Loprinzi and K. Abbott, J. Diabetes Metab. Disord., 2014, 13, 47 CrossRef PubMed.
- M. Fizelova, M. Miilunpohja, A. J. Kangas, P. Soininen, J. Kuusisto, M. Alakorpela, M. Laakso and A. Stančáková, Atherosclerosis, 2015, 240, 272–277 CrossRef PubMed.
- C. Guo, C. Zhang, L. Li, Z. Wang, W. Xiao and Z. Yang, Phytomedicine, 2014, 21, 807–814 CrossRef PubMed.
- G. H. Heeba and A. A. Hamza, Life Sci., 2015, 141, 13–19 CrossRef PubMed.
- A. J. Fatani, S. S. Alrejaie, H. M. Abuohashish, A. Alassaf, M. Y. Parmar and M. M. Ahmed, BMC Complementary Altern. Med., 2015, 15(1), 204 CrossRef PubMed.
- A. Repaci, A. Gambineri and R. Pasquali, Mol. Cell. Endocrinol., 2011, 335, 30–41 CrossRef PubMed.
- S. Pillarisetti and U. Saxena, Expert Opin. Ther. Targets, 2004, 8, 401–408 CrossRef PubMed.
- J. Liu, H. C. Yeo, E. Övervikdouki, T. Hagen, S. J. Doniger, D. W. Chu, G. A. Brooks and B. N. Ames, J. Appl. Physiol., 2000, 89, 21 CrossRef PubMed.
- R. Mateos, E. Lecumberri, S. Ramos, L. Goya and L. Bravo, J. Chromatogr. B: Anal. Technol. Biomed. Life Sci., 2005, 827, 76–82 CrossRef PubMed.
- A. Song, C. Wang, L. Ren and J. Zhao, Int. J. Mol. Med., 2014, 33, 1671 CrossRef PubMed.
- R. Hemi, Y. Yochananov, E. Barhod, M. Kashermeron, A. Karasik, A. Tirosh and H. Kanety, Diabetes, 2011, 60, 1134 CrossRef PubMed.
- M. Yang, Z. Zhang, C. Wang, K. Li, S. Li, G. Boden, L. Li and G. Yang, Diabetes, 2012, 61, 1959–1968 CrossRef PubMed.
- G. Yu, S. Li, J. Li, Z. Ren, C. Feng and X. Wang, Int. J. Biol. Macromol., 2017, 99, 249 CrossRef PubMed.
- C. Xiao, Q. Wu, J. Zhang, Y. Xie, W. Cai and J. Tan, J. Ethnopharmacol., 2016, 196, 47–57 CrossRef PubMed.
- Y. Gao, M. Zhang, T. Wu, M. Xu, H. Cai and Z. Zhang, J. Agric. Food Chem., 2015, 63, 6019 CrossRef PubMed.
Footnotes |
| † Electronic supplementary information (ESI) available. See DOI: 10.1039/c8ra06045b |
| ‡ These authors contributed equally to this work. |
| This journal is © The Royal Society of Chemistry 2018 |