 Open Access Article
Controlled hydrothermal temperature provides tunable permittivity and an improved electromagnetic absorption performance of reduced graphene oxide†
Yilu Xiaab,
Jiankun Wangc,
Chaochan Chend,
Da Huoa,
Yue Wena,
Wenyue Wanga,
Mengxiao Suna,
Chang Xue,
Aming Xie a,
Fan Wu
 *a and
Zhangqi Feng
 *b
*b
aSchool of Mechanical Engineering, Nanjing University of Science & Technology, Nanjing 210094, P. R. China. E-mail: wufan@njust.edu.cn
bSchool of Chemical Engineering, Nanjing University of Science & Technology, Nanjing 210094, P. R. China. E-mail: fengzhangqi1981@163.com
cPudong Foreign Language School Affiliated Shanghai International Studies University, Shanghai 201203, P. R. China
dDivision of Electron and Electricity Measurement Technology, Shanghai Institute of Measurement and Testing Technology, Shanghai 201203, P. R. China
eState Key Laboratory for Disaster Prevention & Mitigation of Explosion & Impact, Army Engineering University of PLA, Nanjing 210007, P. R. China
First published on 25th September 2018
Abstract
Reduced graphene oxide (RGO) has been prepared by a hydrothermal reduction method to explore the effects of reaction temperature on its permittivity and electromagnetic absorption (EA) performance. This study shows that by controlling the oxygen functional groups on the RGO surface it is also possible to obtain an ideal EA performance without any other decorated nanomaterials.
Electromagnetic fields play a critical role in modern electronic and communications industries. However, they also cause humans and wildlife to become chronically exposed to excessive electromagnetic radiation in the environment. Electromagnetic absorption (EA) is one of the most effective methods of managing electromagnetic pollution. Due to the mechanism, EA performance mainly depends on the permittivity and permeability of a material.1 Thus, dielectric and magnetic materials and their hybrids have been considered as fillers to fabricate polymer based composites with EA performance properties.2,3 Due to their large aspect ratios and fascinating dielectric properties, two-dimensional (2D) nanomaterials show huge potential for the application of EA.1,4–8 Among these 2D nanomaterials, the permittivity and EA performance of reduced graphene oxide (RGO) have been most widely studied. Well-reduced RGO can significantly enhance the permittivity of polymers,1,4,6 however, it easily causes impedance mismatch between the air and the composites.9 This phenomenon not only limits the EA performance of the composites, but also makes the incident electromagnetic waves more likely to reflect off the surface of the composite. In order to remedy this defect, multi-component composites have been considered to decorate RGO to achieve ideal EA performances, such as ZnO,10 MoS2,11 NiFe2O4,12 MoS2@Fe3O4,13 CoNi@SiO2,14 and V2O5/carbon nanotubes (CNTs).15
So far, only a few studies have focused on the regulation of permittivity and the improvement of EA performance of pure RGO.1 However, the relationship between synthetic parameters and electromagnetic properties is worthy of being explored further. In this study, we discuss the effects of hydrothermal temperature on the permittivity and EA performance of RGO. The results show that regulation of the C/O ratio through controlling the hydrothermal temperature can provide tunable permittivity and an ideal EA performance.
Graphene oxide (GO) powder (70 mg) was evenly dispersed in distilled water (1 mg mL−1) by ultrasonication. The dispersion was sealed in a 100 mL Teflon-lined autoclave and maintained at 100 °C for 6 hours to remove the oxygen functional groups, then naturally cooled to room temperature. The resulting precipitate from the reaction was then centrifuged. Then the platelets were collected and freeze-dried for 24 hours. The hydrothermal temperatures were 100, 120, 140, 160 and 180 °C, and we thus designated the RGO products as RGO100, RGO120, RGO140, RGO160 and RGO180.
The micro-morphologies of the as-prepared RGO samples were investigated by SEM analysis and the images show that they have similar 2D flexible layer-like structures (Fig. S1†). However, with the increase in temperature, the RGO platelets formed large layers with irregular holes.
In the XRD spectra (Fig. 1a), the diffraction peaks of graphite (002) move gradually to 24° with the increase of hydrothermal temperature. A peak around 12.5° can be found in RGO100, and it suggests that the partial GO has not been well-reduced. On the contrary, RGO140, RGO160 and RGO180 show the diffraction peaks of graphite (100) around 42°, suggesting that a higher degree of graphitization can be achieved by increasing the hydrothermal temperature. A typical and strong D and G band around 1347 and 1581 cm−1 are shown in the Raman spectra of the as-prepared samples (Fig. 1b). On the one hand, removal of oxygen containing groups in GO makes the G band separate from the D band;16 on the other hand, defects are produced in the lattice structure during the removal of oxygen containing groups, because of the increase of ID/IG (Fig. 1c).9
The surface chemistry of RGO100, RGO120, RGO140, RGO160 and RGO180 was measured by XPS. The C/O atomic ratios increase from 6.35 to 9.44 (Table S1† and Fig. 2f), which suggests that the degree of GO reduction has a positive correlation with the hydrothermal temperature. The C 1s spectra of each RGO sample are shown in Fig. 2, and three typical carbon bonds can be found in each sample, including C–C (∼284.8 eV), C–O (∼287.0 eV), and O![[double bond, length as m-dash]](https://www.rsc.org/images/entities/char_e001.gif) C–O (∼288.5 eV).1 Signals resulting from the decrease of C–O are more significant than those of O
C–O (∼288.5 eV).1 Signals resulting from the decrease of C–O are more significant than those of O![[double bond, length as m-dash]](https://www.rsc.org/images/entities/char_e001.gif) C–O, which suggests that most of the oxygen functional groups are removed from the surface of the GO rather than the edges.17,18
C–O, which suggests that most of the oxygen functional groups are removed from the surface of the GO rather than the edges.17,18
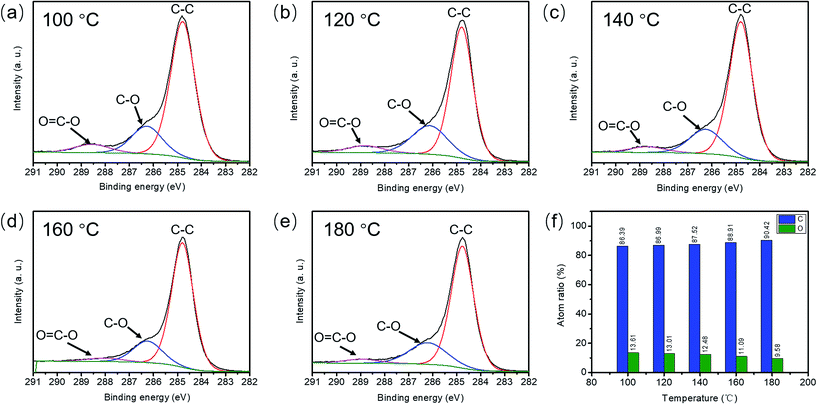 | ||
| Fig. 2 C 1s spectra of RGO100 (a), RGO120 (b), RGO140 (c), RGO160 (d) and RGO180 (e) using XPS, and the ratios of C/O in each sample (f). | ||
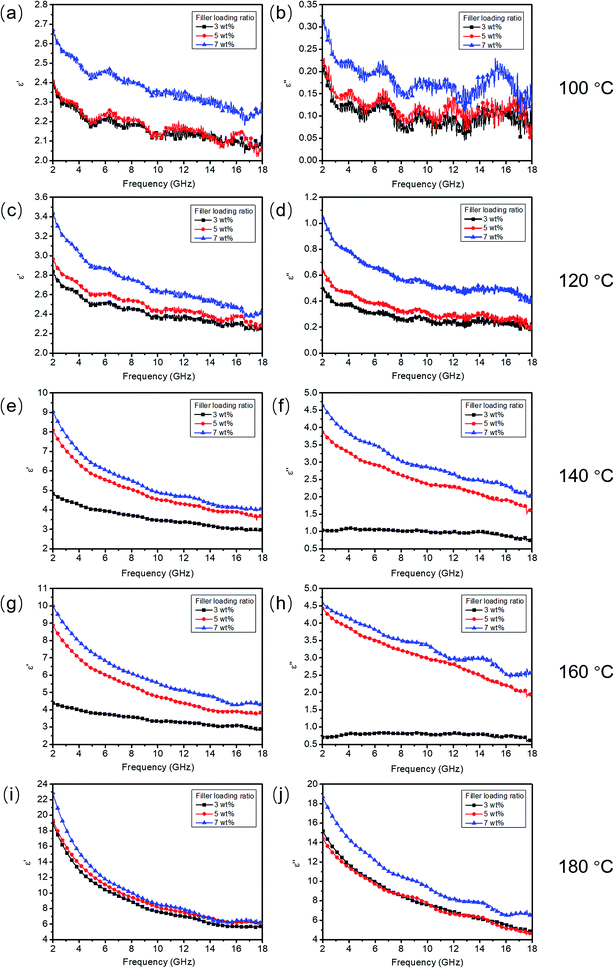
Fig. 3 shows the curves of complex permittivity (εr) of the as-prepared RGO100, RGO120, RGO140, RGO160 and RGO180/wax composites, where the filler loading ratios of each RGO sample are 3, 5 and 7 wt%, respectively. With the increase to the loading ratio of each RGO sample, both the ε′ and ε′′ values increase significantly, which means that increasing the loading ratio can enhance the dielectric properties of the RGO/wax composites. This phenomenon can be well explained according to the effective medium theory.7 Meanwhile, the values of ε′ and ε′′ under the same filler loading ratios also increase gradually with the increase of hydrothermal temperature. It reveals that tunable permittivity of the composites can be achieved through controlling the reaction temperature of GO.
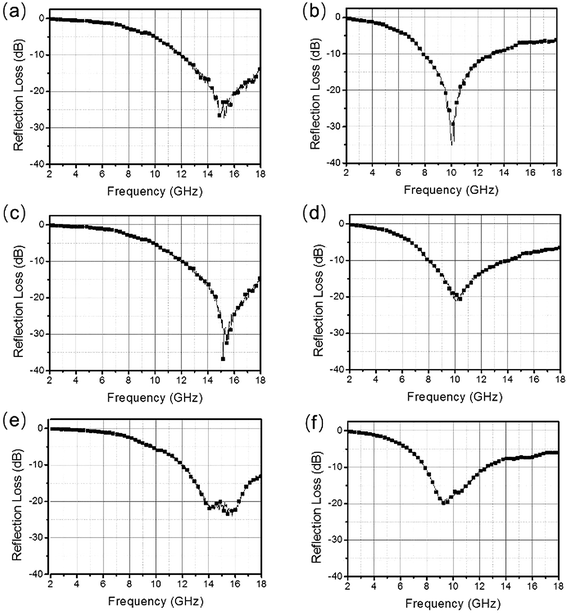
The optimal thicknesses of each sample were taken into account for higher EA performances, and the results are shown in Fig. 4. Under the same loading ratio of RGO, the EA performance of each sample becomes more excellent as the hydrothermal temperature of GO increases up until 160 °C. However, when the reaction temperature rises to 180 °C, the EA performances of the composites become worse than before. For each sample, the value for the strongest absorption point (RLstr) and the absorption bandwidth gradually shift toward a lower frequency. This can be explained by the consideration that formation of the quarter-wavelength attenuation requires the absorbing thickness to meet the phase match conditions.9 It can be found that the composites loaded with RGO140 and RGO160 possess much better EA performances than the other samples. Table S2† summarizes the typical thickness dependent EA performance of the RGO140 and RGO160/wax composites with the filler loading ratios of 5 and 7 wt%. The composites loaded with 5 wt% RGO140 and RGO160 respectively show effective EA bandwidths (lower than −10 dB) of 7.04 and 7.56 GHz with RLstr values of −42.86 and −24.78 dB, both at a thickness of 3 mm (Fig. 5a). When the filler loading ratio increased to 7 wt%, the RGO140 and RGO160/wax composites show effective EA bandwidths of 7.12 and 7.00 GHz with RLstr values of −28.25 and −24.78 dB, respectively, which are also under a thickness of 3 mm (Fig. 5b). From further calculation results, the composite loaded with 5 wt% RGO160 has the broadest effective EA bandwidth of 7.56 GHz from 2.9 to 3.2 mm (Fig. 6). When compared with many reported studies (Table S3†), it is hard to find a material that can demonstrate such a broadband EA performance at such a low filler loading ratio. The results prove that pure RGO can also demonstrate an ideal electromagnetic absorption performance without any other nanomaterials through a most acceptable method.
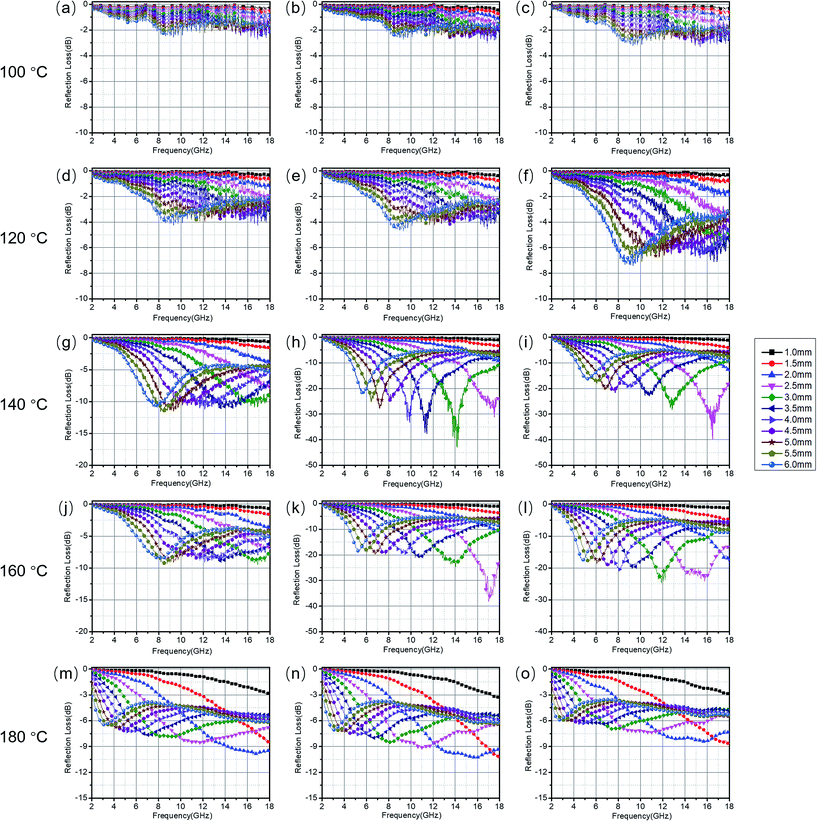 | ||
| Fig. 4 RL curves of RGO100 (a–c), RGO120 (d–f), RGO140 (g–i), RGO160 (j–l) and RGO180 (m–o) with filler loading ratios of 3, 5 and 7 wt% in wax composites. | ||
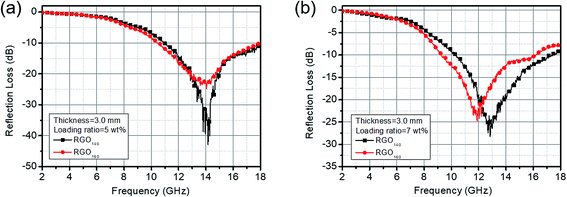 | ||
| Fig. 5 A comparison of the effective EA bandwidths of composites loaded with 5 wt% and 7 wt% RGO140 and RGO160 at the same thickness of 3 mm. | ||
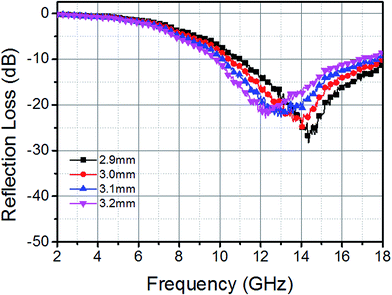 | ||
| Fig. 6 RL curves of RGO160/wax composites, where the filler loading ratio is 5 wt% and the thicknesses are from 2.9 to 3.2 mm. | ||
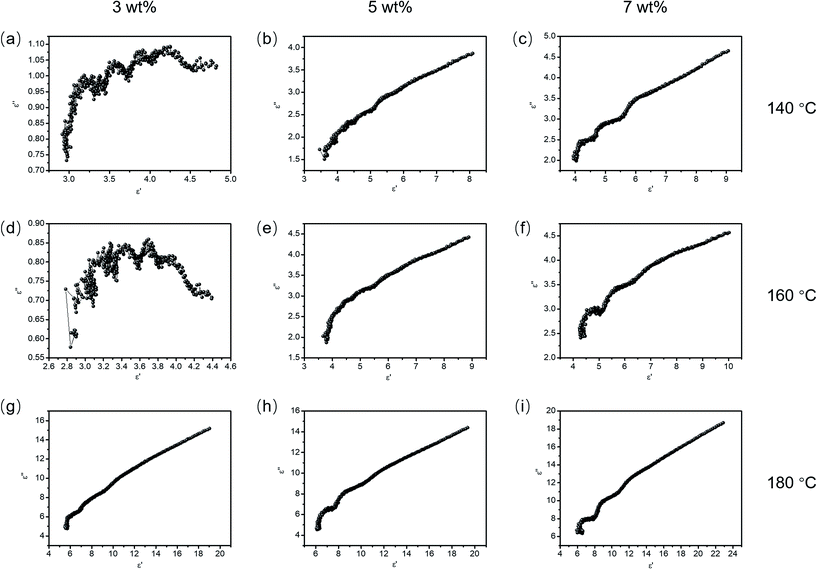
The low values of ε′′ lead to the poor EA performances of the RGO100 and RGO120/wax composites.19 The values of ε′′ are gradually enhanced in the RGO140, RGO160 and RGO180/wax composites, however, the EA performance of the RGO180/wax composite is not strengthened further. In the Cole–Cole curves (Fig. 7) of the RGO140 and RGO160/wax composites, several semicircle-like structures can be obviously found in the composites with a filler loading ratio of 3 wt%. On the contrary, no evident semicircle is found in the Cole–Cole curve of the RGO180/wax composite, as well as the RGO140 and RGO160/wax composites with filler loading ratios of 5 and 7 wt%. Instead, it has the tendency to become linear. This reveals that conductivity loss plays the main role in the dielectric loss of this composite, and polarization induced by defects, chemical bonds and interfaces is hidden by the conductivity loss.9 Increased conductivity can provide more efficient EA in theory, however, electromagnetic waves may not be able to enter the composite, due to the impedance of the composite which is far less than that of free space.20 A composite has a much higher dielectric loss than others under a very low filler loading ratio of RGO180, thus the impedance of the composite will be further depressed with the increased filler loading ratio. Finally, the well-reduced RGO180 loses its advantage for EA.
In practice, as an ideal EA material, not only is a broad and strong absorption bandwidth needed, but an accurate coverage of the radar channels is also necessary, for example, the Ku band (12.00–18.00 GHz) for satellite broadcasting, and the X band (8.00–12.00 GHz) for synthetic aperture radar and electron spin resonance apparatus.1 As shown in Fig. 8 and Table S4,† both RGO140 and RGO160 composites with loading ratios of 5 wt% can effectively dissipate incident electromagnetic energy in the whole Ku band at thicknesses of 2.8 and 2.7 mm, as well as the X band at thicknesses of 3.9 and 3.7 mm. Besides 5 wt% loaded RGO, when RGO160 is loaded at 7 wt% in the composite, thinner thicknesses of 2.5 and 3.5 mm are required for effective EA in the Ku and X bands, respectively.
Conclusions
In summary, we have studied the effects of hydrothermal temperature on the permittivity and EA performance of RGO. With the increase of hydrothermal temperature, oxygen functional groups can be removed from GO effectively, especially those from the edges of GO. The composites loaded with 5 wt% RGO140 and RGO160 respectively show effective EA bandwidths of 7.04 and 7.56 GHz with RLstr values of −42.86 and −24.78 dB, both at thicknesses of 3 mm. When the filler loading ratio is increased to 7 wt%, the RGO140 and RGO160/wax composites respectively show effective EA bandwidths of 7.12 and 7.00 GHz with RLstr values of −28.25 and −24.78 dB, also at thicknesses of 3 mm.Statement of contributions
Fan Wu, Aming Xie and Zhangqi Feng designed the experiments. Yilu Xia, Jiankun Wang and Chaochan Chen carried out the synthetic experiments. Da Huo, Yue Wen and Wenyue Wang carried out the characterization. Mengxiao Sun and Chang Xu calculated the RL curves. Yilu Xia, Jiankun Wang and Chaochan Chen wrote this paper.Conflicts of interest
There are no conflicts to declare.Acknowledgements
This work was financially supported by the National Natural Science Foundation of China (51403236, 51702161), the Fundamental Research Funds for the Central University (AE89926) and the Natural Science Foundation of Jiangsu Province (BK20161466).Notes and references
- F. Wu, Q. Zeng, Y. Xia, M. Sun and A. Xie, Appl. Phys. Lett., 2018, 112, 192902 CrossRef.
- F. Meng, H. Wang, F. Huang, Y. Guo, Z. Wang, D. Hui and Z. Zhou, Composites, Part B, 2018, 137, 260 CrossRef.
- B. Quan, X. Liang, G. Ji, Y. Cheng, W. Liu, J. Ma, Y. Zhang, D. Li and G. Xu, J. Alloys Compd., 2017, 728, 1065 CrossRef.
- W. Cao, X. Wang, J. Yuan, W. Wang and M. Cao, J. Mater. Chem. C, 2015, 3, 10017 RSC.
- B. Wu, H. Tuncer, A. Katsounaros, W. Wu, M. Cole, K. Ying, L. Zhang, W. I. Milne and Y. Hao, Carbon, 2014, 77, 814 CrossRef.
- C. Chen, N. Pu, Y. Liu, S. Huang, C. Wu, M. Ger, Y. Gong and Y. Chou, Composites, Part B, 2017, 114, 395 CrossRef.
- M. Ning, M. Lu, J. Li, Z. Chen, Y. Dou, C. Wang, F. Rehman, M. Cao and H. Jin, Nanoscale, 2015, 7, 15734 RSC.
- F. Wu, A. Xie, M. Sun, W. Jiang and K. Zhang, Mater. Lett., 2017, 193, 30 CrossRef.
- F. Wu, A. Xie, M. Sun, Y. Wang and M. Wang, J. Mater. Chem. A, 2015, 3, 14358 RSC.
- F. Wu, Y. L. Xia, Y. Wang and M. Y. Wang, J. Mater. Chem. A, 2014, 2, 20307 RSC.
- Y. Wang, D. L. Chen, X. Yin, P. Xu, F. Wu and M. He, ACS Appl. Mater. Interfaces, 2015, 7, 26226 CrossRef PubMed.
- Y. Zhang, X. Wang and M. Cao, Nano Res., 2018, 11, 1426 CrossRef.
- M. Li, X. Cao, S. Zheng and S. Qi, J. Mater. Sci., 2017, 28, 16802 Search PubMed.
- S. Zhou, Y. Huang, J. Yan, X. Han and X. Chen, J. Mater. Sci., 2017, 28, 18558 Search PubMed.
- K. Palanisamy, J. H. Um, M. Jeong and W. Yoon, Sci. Rep., 2016, 6, 31275 CrossRef PubMed.
- A. C. Ferrari and D. M. Basko, Nat. Nanotechnol., 2013, 8, 235 CrossRef PubMed.
- A. Lerf, H. Y. He, M. Forster and J. Klinowski, J. Phys. Chem. B, 1998, 102, 4477 CrossRef.
- H. Y. He, J. Klinowski, M. Forster and A. Lerf, Chem. Phys. Lett., 1998, 287, 53 CrossRef.
- X. Yin, L. Kong, L. Zhang, L. Cheng, N. Travitzky and P. Greil, Int. Mater. Rev., 2014, 59, 326 Search PubMed.
- A. Xie, F. Wu, M. Sun, X. Dai, Z. Xu, Y. Qiu, Y. Wang and M. Wang, Appl. Phys. Lett., 2015, 106, 222902 CrossRef.
Footnote |
| † Electronic supplementary information (ESI) available: Experimental section (S1); SEM images of RGO100, RGO120, RGO140, RGO160 and RGO180 (Fig. S1); the atom% of C/O in RGO100, RGO120, RGO140, RGO160 and RGO180 (Table S1); typical thickness dependent EA performance; RGO140 and RGO160 are loaded at 5 wt% and 7 wt% in wax composites (Table S2); thinnest thickness for effective EA in the Ku and X band (Table S3). See DOI: 10.1039/c8ra05843a |
| This journal is © The Royal Society of Chemistry 2018 |


