
 Open Access Article
 This Open Access Article is licensed under a Creative Commons Attribution-Non Commercial 3.0 Unported Licence
Microfabricated passive resonator biochip for sensitive radiofrequency detection and characterization of glucose†
Gyan Raj Koirala a,
Eun-Seong Kima,
Rajendra Dhakalab,
Zorigt Chuluunbaatara,
Yong Hwa Joac,
Sung-Soo Kimac and
Nam-Young Kim*a
a,
Eun-Seong Kima,
Rajendra Dhakalab,
Zorigt Chuluunbaatara,
Yong Hwa Joac,
Sung-Soo Kimac and
Nam-Young Kim*a
aRFIC Fusion Laboratory, Department of Electronic Engineering, Kwangwoon University, Seoul, South Korea. E-mail: nykim@kw.ac.kr
bDepartment of Computer Science and Engineering, Sejong University, Seoul, South Korea
cDepartment of Biochemistry and Molecular Biology, Kyung-Hee University, Seoul, South Korea
First published on 24th September 2018
Abstract
Passive sensors provide a new route for the characterization of concentration-dependent radiofrequency parameters with high reproducibility in real time. We propose a microfabricated resonator realized using integrated passive device technology for the sensitive detection and characterization of glucose. Experimental results verify the high performance of the proposed biosensor, because radiofrequency parameters such as resonance frequency (from 0.541 to 1.05 GHz) and reflection coefficient (from −34.04 to −24.11 dB) linearly vary in response to deionized water and subsequent iterative measurements of different glucose concentrations (from 50 to 250 mg dL−1). The biosensor has a very low limit of detection of 8.46 mg dL−1, a limit of quantitation of 25.63 mg dL−1, a minimum frequency sensitivity of 29 MHz, and a minimum magnitude sensitivity of 0.22 dB. Moreover, the coupling coefficient consistently decreases with the increasing glucose concentration. We also used the measured radiofrequency parameters to determine the unknown permittivity of glucose samples through mathematical modeling. A decreasing trend in the loss tangent and an increasing trend in the characteristic wave impedance were observed with the increase of glucose concentration. The reproducibility of the sensor was verified through iterative measurements on the same sensor surface and subsequent study of surface morphology.
Introduction
The dysregulation of human glycemia causes diabetes, which is characterized by a metabolic disorder due to the lack of insulin in the body or cells failing to properly respond to insulin. This progressive disease has been found to be associated with life-threatening health problems such as kidney failure, visual disability, heart failure, and stroke, which accounted for 3.7 million deaths in 2012.1–3 However, the adverse effects of diabetes can be substantially reduced and controlled through medication and therapy provided that it is detected at an early stage. Therefore, a point-of-care monitoring of blood glucose concentration (BGC) is necessary.To date, electrochemical glucose sensors dominate the commercial market given their high sensitivity, easy handling, and low cost.4,5 However, these sensors require finger-pricking for routine monitoring of BGC through enzymatic oxidation, which might cause pain and discomfort in the patient. Furthermore, enzymatic detection can be inaccurate by the intrinsic nature of enzymes.6,7 Recently, studies have reported the feasibility of potentiometric immunosensors8 and 3D molecular imprinting techniques9 for the detection of bio-analytes that can be extended to the assessment of glucose levels. Several optical technologies have also been proposed as alternatives to continuous noninvasive monitoring of labelled BGC.10,11 However, the sensitivity of such sensors is highly influenced by temperature variations in electromagnetic sensing and associated compounds in the case of Raman and near-infrared spectroscopy.12 Thus, considerable attention has been paid to the development of cost-effective and robust platforms for sensitive detection of BGC using noninvasive sensors.
The study of mediator- and label-free radiofrequency (RF) detection of BGC is increasing in recent years to address these demands.7 Moreover, preliminary studies have demonstrated the feasibility of RF characterization of glucose through either noninvasive13,14 or implantable devices.15 Passive microsensors, which operate in the microwave region (typically between 1 and 30 GHz), can effectively detect concentration-specific biosamples according to varied water content in a solution, outperforming low-frequency (in the order of megahertz) devices.16 The highly flexible, cost-effective, and mechanically tolerable design geometries conforming a resonator can serve as fundamental transducer for the frequency-dependent characterization of biosamples.17–19 Furthermore, RF and microwave sensors are capable of directly interacting with glucose molecules resulting in a varied S-parameter response due to the dipolar effect of water molecules. Thus, this response can be both utilized for analyte-specific sensing with low signal loss and decomposed into multivariable parameters.7,19 Moreover, the compliance of these sensors with microwave communication systems enable their adoption for point-of-care diagnosis of BGC.
This study exploited the utility of a microwave passive biosensor for the sensitive detection and characterization of glucose. The proposed sensor ensures reliable RF detection that provides a reproducible shift in the resonance frequency as function of the glucose concentration with a high selectivity above −24 dB. In the sequel, we describe the design and analytical procedures involved in glucose characterization. Then, we present experimental results of sensitive RF parameters. The resonance frequency and reflection coefficient are utilized to determine unknown glucose concentration using the Debye relaxation equations. Moreover, we discuss the reproducibility and detail the passivation and packaging of the sensor.
Design synthesis and analysis
Modeling and fabrication
We conceived frequency-dependent resonance as an RF sensing mechanism that comprises capacitively coupled single-split double-ring resonators connected at either side of spiral inductive circular lines, as depicted in Fig. 1. The equivalent inductive and capacitive effects on this design produce the resonance of the resulting bandpass filter given by relationship fo = 1/(LeqCeq)1/2, where fo is the fundamental resonance frequency of 1.81 GHz. The design and analysis of these resonators have been previously reported.20,21 The capacitive effect between the input and output ring resonators is dominated by the mutual capacitance between the two rings and the capacitance developed through an airbridge underpass. Meanwhile, the capacitance developed across the splits of the inner ring is negligible.22 The overall capacitance is essential to the resonance frequency variation corresponding to glucose concentration.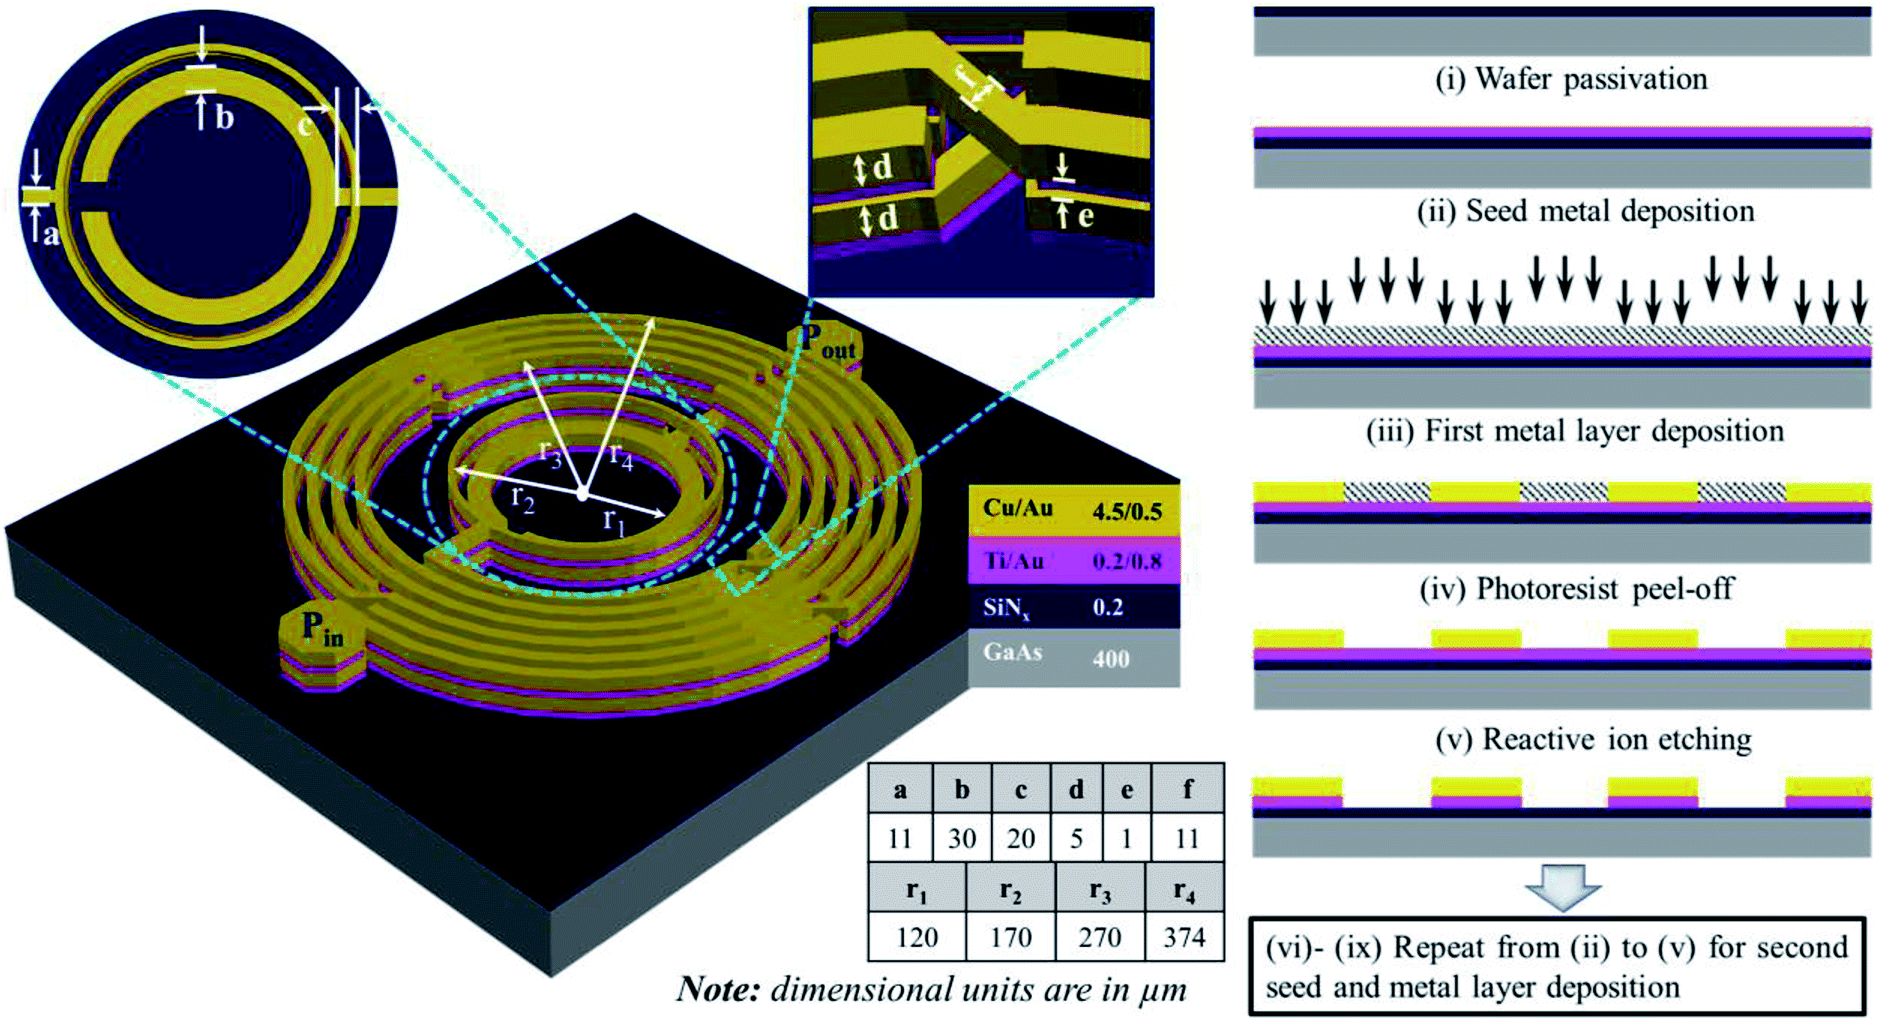 | ||
| Fig. 1 Schematic multilayered structure of the proposed biosensor and fabrication using integrated passive device technology. The proposed sensor is placed on a GaAs substrate insulated by SiNx from the metal layers. Ti/Au is used as seed metal layer, and Cu/Au comprises the first and second metal lines with identical thickness (unit: micrometers). | ||
The fabrication of the device is illustrated at the right-hand side of Fig. 1. Integrated passive device technology was adopted to fabricate the device in a gallium arsenide (GaAs) substrate with dielectric constant of 12.85 and thickness of 200 μm, as it exhibits a low microwave signal loss. The top layer of the GaAs substrate was laminated by a substrate-compatible SiNx dielectric material (0.2 μm thick) as passivation layer through plasma-enhanced chemical vapor deposition that uses SiH4NH3 as process gas operating at a temperature of 250 °C. Besides the isolation of the substrate from the metal layers, the passivation layer yields a very smooth surface morphology.23 Following the passivation layer, a seed metal layer composed of titanium gold (Ti/Au) with thickness of 0.2/0.8 μm was realized through a sputtering process, whose power was 1 kW and time for deposition was 50/40 s. A standard photolithography process was adopted for micropatterning the device. The seed metal layer improved the adhesiveness of the substrate to the metal layers.24,25 The first metal layer, which consisted of copper/gold (Cu/Au) with thickness of 4.5/0.5 μm, was deposited through electroplating at current of 300/50 mA and curing temperature of 25/60 °C. We used Cu/Au given the cost-effective realization of a thick metal layer and improved immobilization of biomolecules on the gold surface. Moreover, compared with other metals such as copper and silver, the gold metal layer shows a better affinity, chemical stability, ductility, and purity, which are ideal for biosensing applications.17 Second seed metal (Ti/Au) and the metal (Cu/Au) layers were realized in the same manner as the first layers.
Surface immobilization
To enhance the immobilization of glucose samples in the exposed Au layer, argon (Ar)-plasma etching was implemented over the Au surface for 5 min. Consequently, this process modifies the hydrophobic into a hydrophilic surface profile by improving the contact angle between the surface layer and the glucose samples.26,27 In addition, the Ar-plasma treatment is useful for removing metallic impurities, thus enhancing the surface conductivity and metal wire bonding through the mechanical bombardment of Ar+ ions.28 The surface morphology of the Ar-treated Au layer was measured using atomic force microscopy for a contact area of 10 × 10 μm, as shown in Fig. 2. Several positive and negative peaks were observed in the surface profile after Ar-plasma etching. The root-mean-square (rms) value of the post-plasma-treated surface was measured to be 55.79 nm. The measurement results shown in Fig. 2c indicate a maximum variation in the surface roughness of 217.201 nm with a deep angle of 7.914°. The histogram shown in Fig. 2d indicates the distribution of surface roughness, and the 2D power spectra shown in Fig. 2e reveals the surface morphology variation in the frequency domain, which was obtained by applying the Fourier transform on the height data.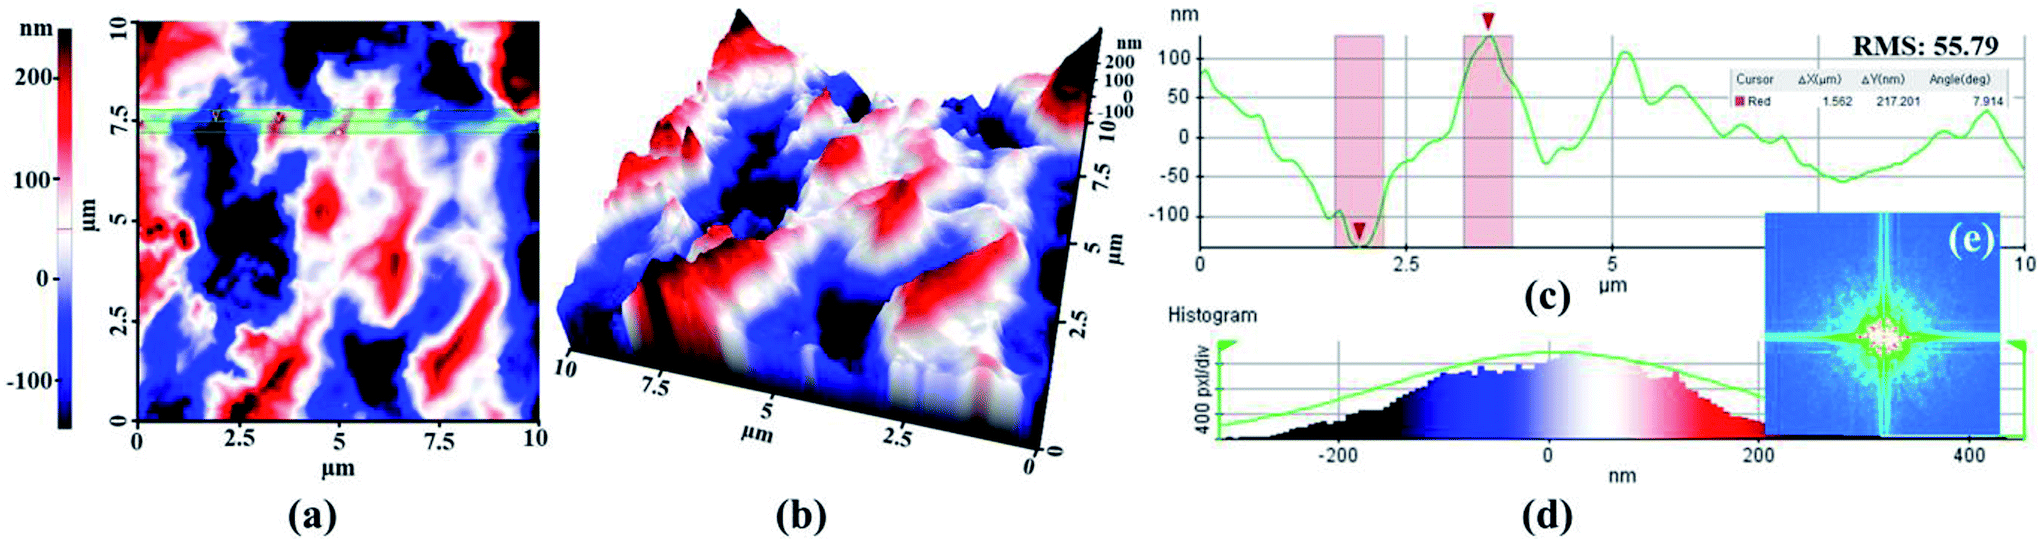 | ||
| Fig. 2 Surface morphology of exposed metal surface after Ar-plasma etching. (a) Planar and (b) 3D images of the exposed metal surface in a 10 × 10 μm area. (c) Surface roughness of the highlighted region at approximately 7.5 μm. (d) Histogram of the highlighted region and (e) power spectra obtained by applying the Fourier transform. | ||
Sample preparation
The BGC in healthy people ranges from 70 to 130 mg dL−1 and goes below 60–65 mg dL−1 and above 240 mg dL−1 for people with hypoglycemia and hyperglycemia, respectively,29 during fasting. In addition, it remains below 180 mg dL−1 after meals. We prepared 10 samples with concentrations from 50 to 250 mg dL−1 at increments of 25 mg dL−1 to cover the range of glucose levels in both healthy and diabetic subjects. For the samples, we mixed D-glucose powder with deionized (DI) water in proportion to obtain the desired glucose concentration.RF measurement and characterization
The RF response of the biosensor was examined using an Agilent 8510C vector network analyzer (Agilent Technologies, Santa Clara, CA, USA) using the setup illustrated in Fig. 3, with the calibration standard of a two-port network. A ground-signal-ground microprobe was utilized to connect the biosensor to the analyzer using coaxial cables. The frequency response was measured between 0.1 and 5 GHz for a total of 801 frequency bins with resolution of 6.12 MHz. Table 1 summarizes the simulated and measured RF characteristics of the bare chip resonating at 1.81 GHz with high rejection above 40 dB. We performed three iterative measurements of the glucose samples at a room temperature of 25 °C. The surface exposed for glucose detection was cleaned using DI water and then dried using nitrogen gas between successive measurements.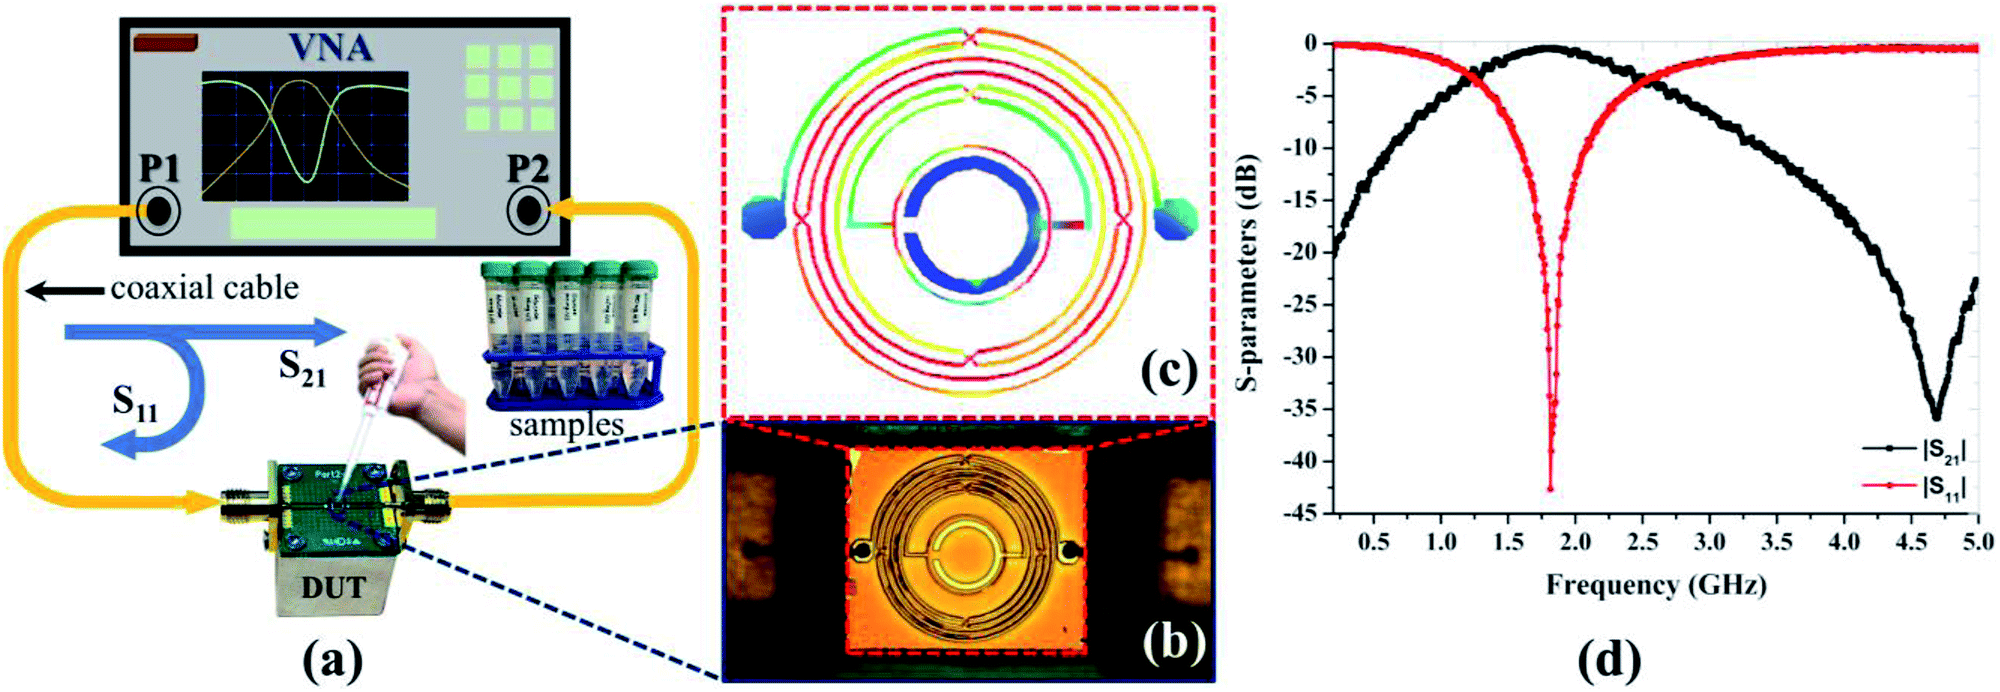 | ||
| Fig. 3 Sensor measurement setup and structural and computational verifications. (a) Measurement setup including the vector network analyzer (VNA) and coaxial cables to connect to the subminiature version A connector attached to the device under test (DUT). The graph also shows the samples and micropipette. (b) Microscopic image of the proposed sensor. (c) Current distribution along the proposed sensor at a bare resonance frequency. (d) Measured S-parameter response of the fabricated sensor. | ||
| fo (GHz) | |S11| (dB) | |S21| (dB) | QL | |
|---|---|---|---|---|
| a fo-resonance frequency, |S11|-magnitude of reflection coefficient, |S21|-magnitude of transmission coefficient, QL-quality factor. | ||||
| Simulated | 1.82 | 37.45 | 0.28 | 1.34 |
| Measured | 1.81 | 42.63 | 0.40 | 1.23 |
The frequency-dependent glucose characteristics by the variation in complex permittivity are governed by the polarization of water molecules given their dipole reorientation in response to the incident time-varying electric and magnetic fields. The permittivity variation of glucose samples as function of resonance frequency can be approximated by the Debye relaxation parameters: ε∞(χ) is the high-frequency permittivity, εl(χ) is the low-frequency (static) permittivity, and τ(χ) is the relaxation time in picoseconds. Concentration-specific complex permittivity εr(ω,χ) is defined as6
 | (1) |
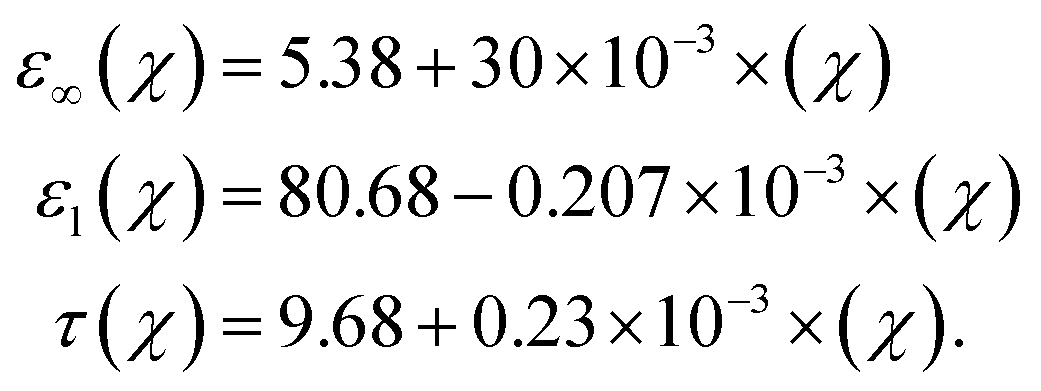 | (2) |
The approximated glucose concentrations according to frequency are shown in Fig. 4. The real part of the complex permittivity, known as relative permittivity, remained almost constant over the analyzed frequency range from 0.1 to 5 GHz, whereas the imaginary part, known as dissipation factor, exponentially decays with the frequency increase. The values obtained from the Debye equation were used to approximate the complex permittivity of the glucose concentration.
 | ||
| Fig. 4 Complex permittivity according frequency in the microwave region from 0.1 to 5 GHz obtained using the Debye approximation. | ||
Results and discussion
The change in resonance frequency characteristics according to concentration is fundamental for the detection of glucose levels in the microwave regime. Hence, we investigated the variation in the resonance frequency and its reflection coefficient under different glucose concentrations. We also analyzed the absolute and relative shifts in resonance frequency followed by some derived RF parameters, such as the quality factor and coupling coefficient. In addition, characterization of the complex permittivity was performed to relate it with the glucose samples with respect to the measured RF values. The reproducibility of the sensor was verified through iterative measurements of the samples and from the study of surface morphology. The resulting feasibility of the proposed sensor through passivation and packaging serve as a guide for future developments.RF parameter measurements and analysis
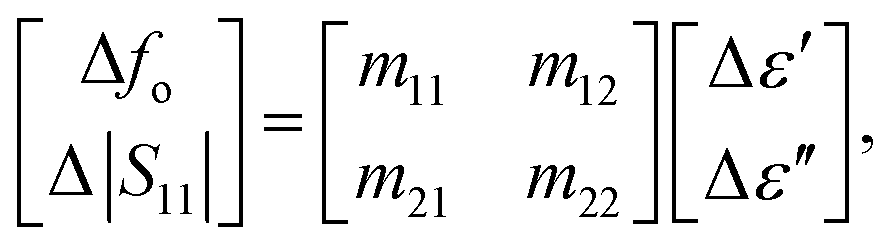
The glucose concentration-dependent variation in the RF parameters is shown in Fig. 5. The resonance frequency linearly increases from 0.54 to 1.05 GHz with DI water up to 250 mg dL−1 of glucose concentration with correlation coefficient r2 = 0.99893, as shown in Fig. 5a. In contrast, the magnitude of the reflection coefficient goes from −34.04 to −24.11 dB with DI water up to 250 mg dL−1 of concentration with correlation coefficient r2 = 0.98878, as shown in Fig. 5b. The lowest glucose concentration that can be effectively detected by the proposed sensor defined by the limits of detection and quantitation were 8.46 and 25.63 mg dL−1, respectively. The minimum frequency sensitivity of the sensor given by Δfrel/Δε′, where Δfrel is the relative shift in resonance frequency, was as low as 29 MHz, and the magnitude sensitivity given by the measured reflection coefficient Δ|S11|rel/Δε′, where Δ|S11|rel is the relative change in the magnitude of the reflection coefficient, was as low as 0.22 dB, per 25 mg dL−1 increase in glucose concentration. The detailed RF measurement data of each sample are provided in ESI Table S1† along with the corresponding graph in ESI Fig. S1.†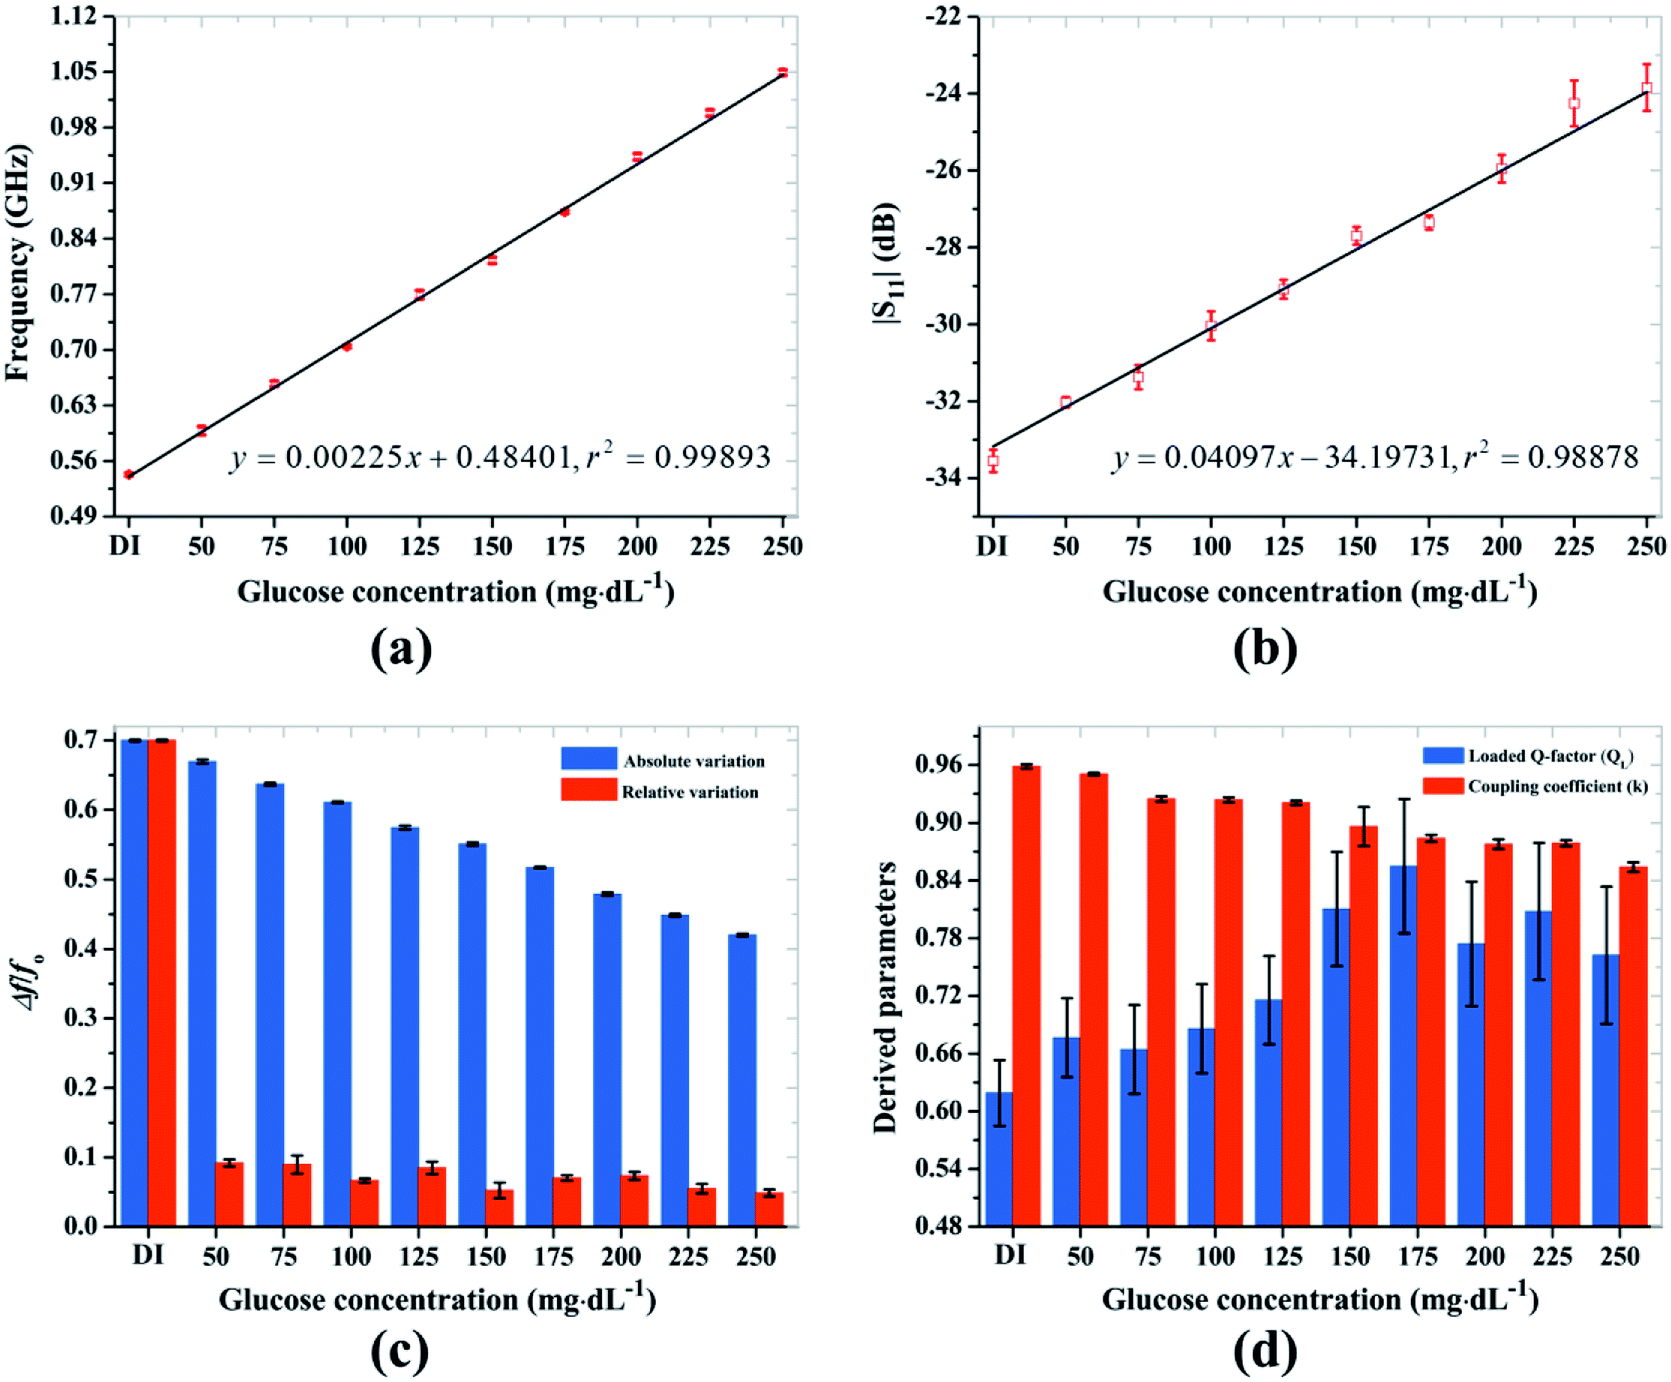 | ||
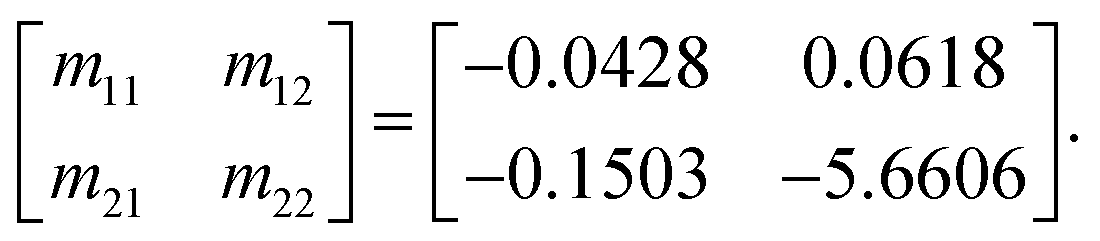
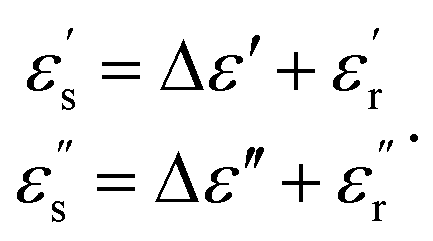
| Fig. 5 Parametric variation of proposed sensor according to glucose concentration. (a) The resonance frequency is directly proportional and (b) the magnitude of the rejection level is inversely proportional to the glucose concentration. (c) Absolute and relative variations in resonance frequency. (d) Calculated loaded quality factor and coupling coefficient derived from the measured RF response. | ||
The absolute shift in the resonance frequency linearly decreases with the increasing glucose concentration as shown in Fig. 5c, which is fundamental to model RF biosensors with concentration-dependent sensitivity. We also found a significant relative variation between successive concentrations of the samples. The calculated values of the derived parameters are shown in Fig. 5d. Still, the loaded quality factor was inconsistent, whereas the coupling coefficient successively decreased with increasing glucose concentration. The decrease in the coupling coefficient was expected because the number of polarized water molecules decreases as the glucose concentration increases.
Furthermore, we studied the influence of added sucrose by mixing 10 mg dL−1 sucrose with the glucose solution at 100, 150, and 200 mg dL−1 concentration. The measurement results listed in ESI Table S2† show that there was not a considerable variation (maximum Cohen's d-score = −2.0325) in the resonance characteristics of the sensor when adding sucrose. This result is consistent with that of our previous study demonstrating a negligible effect of adding fructose isomer to human serum.30 The slight variation in the measurement results can be attributed to the limited resolution (6.12 MHz) of the vector network analyzer and the linear regression approximation.
Complex permittivity characterization
The complex permittivity characteristics of the glucose solution were modeled using the Debye equation and are shown in Fig. 3. The calculations allowed to approximate the complex permittivity (ε = ε′ − jε′′) of the unknown glucose concentration according to the measured RF parameters: resonance frequency and reflection coefficient of the proposed biosensor. The relationship between the measured glucose-sensitive RF parameters and complex permittivity can be expressed as31
 | (3) |
 and Δ|S11| = |S11|s − |S11|r are the differences between the sample (with subscript s) and the reference (with subscript r) values. Here, a glucose concentration of 150 mg dL−1 was considered as reference. The unknown coefficients (mij, i, j = 1, 2) of the fitting matrix can be calculated from the approximated values of the complex permittivity obtained from eqn (1) and the measured glucose-sensitive RF parameters by applying the least-square method, resulting in
 | (4) |
Then, the complex permittivity of the unknown glucose concentration with respect to the reference can be obtained as [Δε] = [m]−1[ΔX], where X is either Δfo or Δ|S11|.
Thus, the complex permittivity values of the unknown glucose concentration are expressed as
 | (5) |
The Debye approximation and the calculated values are shown in Fig. 6a and present a suitable agreement. Furthermore, we evaluated the dielectric loss tangent (tan![[thin space (1/6-em)]](https://www.rsc.org/images/entities/char_2009.gif) δ = ε′′/ε′) and the reflection phenomenon in terms of the characteristic wave impedance
δ = ε′′/ε′) and the reflection phenomenon in terms of the characteristic wave impedance  We assumed that permittivity ε = ε′ because the magnitude of reflection is governed by ε′ of the material and provides a less than 5% error by neglecting ε′′.32 The variation (decreased loss tangent and increased characteristic wave impedance) was responsible for the change in the magnitude of reflection coefficient due to the reduced polarization of the water molecules with the increased glucose concentration.
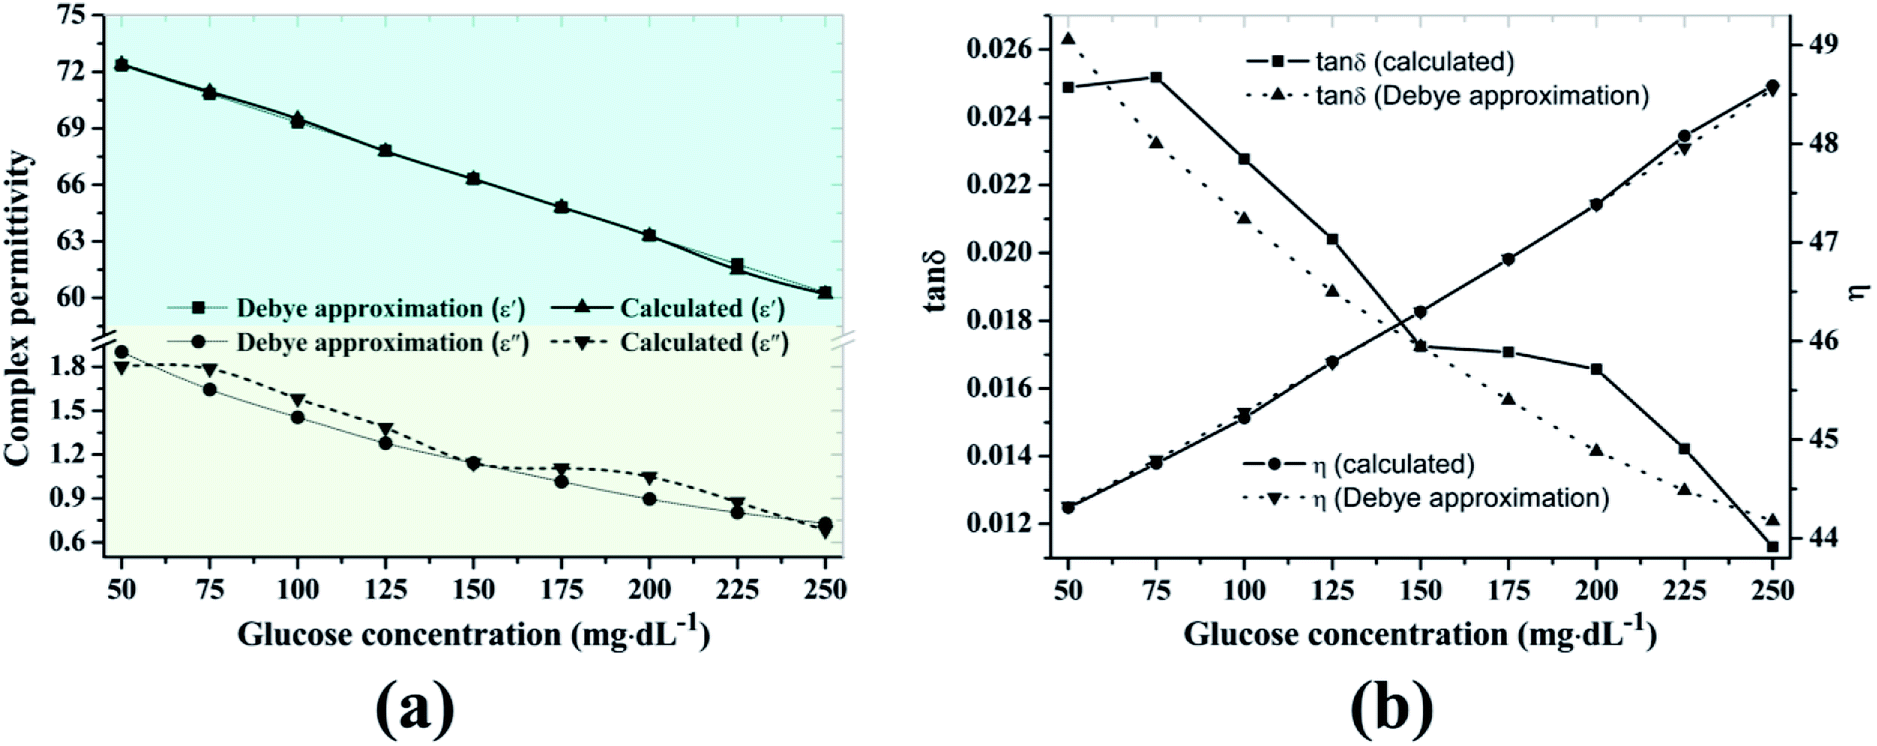 | ||
| Fig. 6 (a) Complex permittivity, (b) loss tangent and characteristic wave impedance according to glucose concentration. | ||
Sensor reproducibility
The reproducibility of the proposed sensor is analyzed by retrieving the bare resonance frequency and the robustness of surface morphology after iterative measurements of the samples. The measurement data included in ESI Table S1† show no overlapping in the RF response of the proposed sensor under different glucose concentrations.The surface morphological study of the sensor using atomic force microscopy covered the pretreatment (plasma-treated bare sensor) and post-treatment (after completion of all measurements and cleaning the surface with DI water and drying with nitrogen gas). The rms value of the exposed surface of the bare sensor shown in Fig. 2 was retained after measurement completion, resulting in 57.61 nm with resonance frequency of 1.81 GHz, as shown in ESI Fig. S2.† These results demonstrate the robustness of the biosensor against biofouling. The stability and repeatability in the response are essential for the expected cost-effectiveness of the proposed sensor in routine monitoring of BGC.
Passivation and packaging
A SU-8 film epoxy layer with thickness of 50 μm was used for passivation, as shown in Fig. 7a. The utility of such passivation layer is manifold, as it allows exposure only to the bio-sensitive region and laminates all other parts of the sensors from possible contamination. Moreover, it substantially improves the mechanical and chemical stability of the sensor.33 We also propose the packaging technique for mass production shown in Fig. 7b. The fabricated sensor was attached to the die and connected through gold wire bonding using a thermosonic process. The encapsulation of the wire bonding could be realized using nonvolatile silicone gel. We should note that the process described here is still in progress and is part of future research.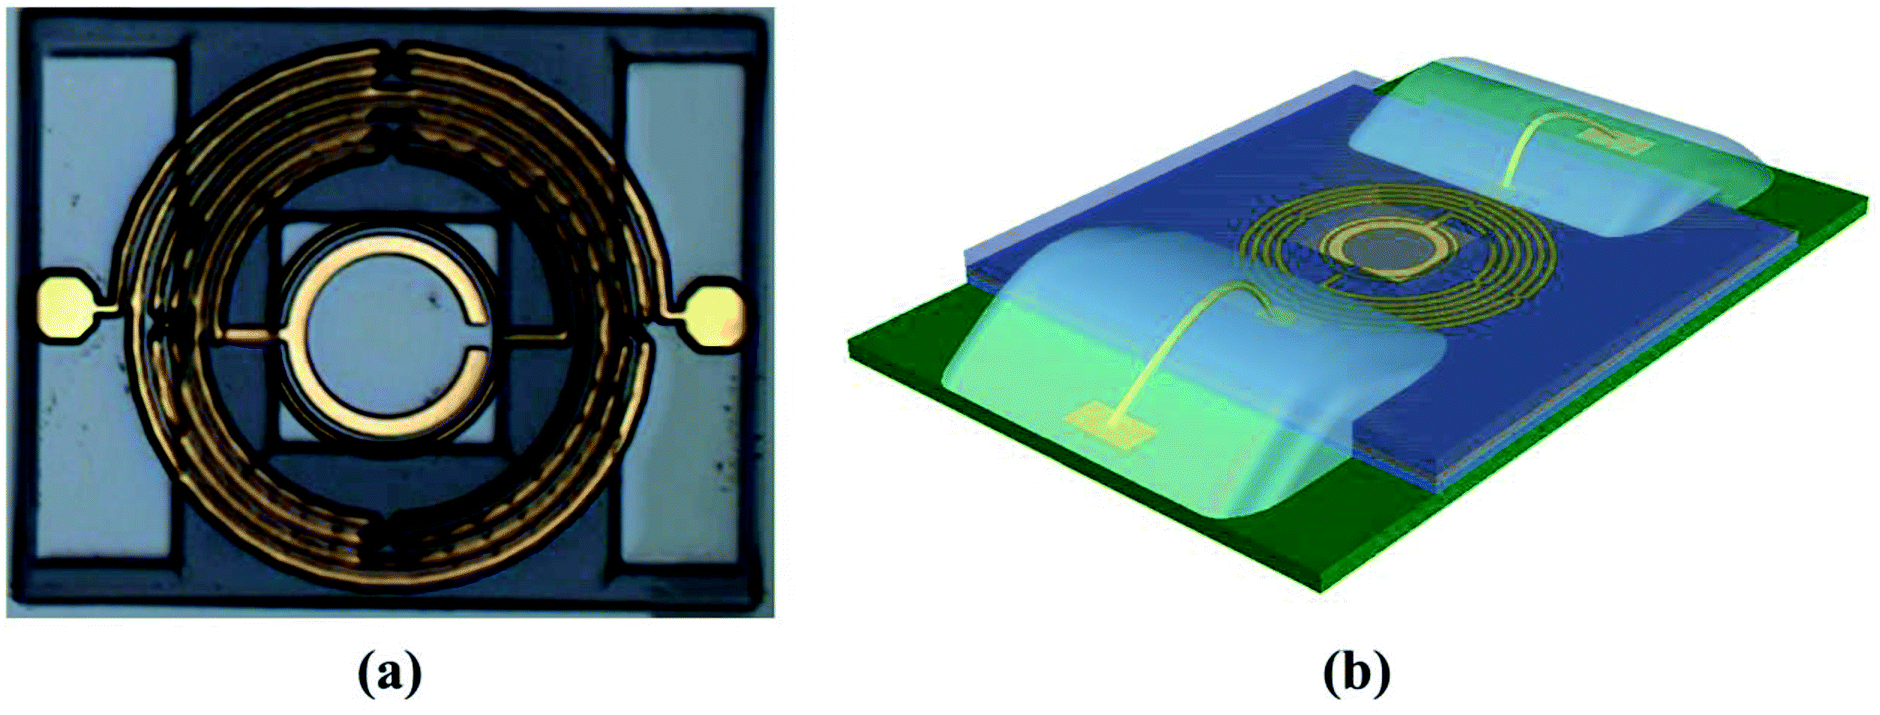 | ||
| Fig. 7 Proposed model for passivation and packaging. (a) Passivation of the proposed sensor using SU-8 polymer that excludes the bio-interaction region and the ports for wire bonding. (b) Packaging process, including the printed circuit board (green) mount, wire bonding, and application of protective gel (faint blue). | ||
Conclusions
In this work, an RF/microwave biosensor incorporating a microfabricated passive resonator was experimentally verified and characterized for the sensitive detection of glucose concentration. The proposed sensor appears to be a reliable alternative for real-time monitoring of glucose with high sensitivity, low detection limit, and high reproducibility. We further analyzed the complex permittivity of the glucose and characterized it with respect to the measured RF parameters. Derived parameters such as the absolute variation in the resonance frequency, coupling coefficient, and loss tangent were found to decrease, and the characteristic wave impedance increased with the glucose concentration. The proposed passivation and packaging methodology are aimed for future commercialization of the sensor but requires further investigation and verification.Conflicts of interest
There are no conflicts to declare.Acknowledgements
This work was supported by Basic Science Research Program through the National Research Foundation (NRF) funded by the Ministry of Education (No. 2018R1A6A1A03025242) and was also supported by a Research Grant of Kwangwoon University in 2018.References
- World Health Organization, Global Report on Diabetes, 2016, Isbn 978, 88, pp. 7–22 Search PubMed.
- A. D. Deshpande, M. Harris-Hayes and M. Schootman, Phys. Ther., 2008, 88, 1254–1264 CrossRef PubMed.
- N. G. Forouhi and N. J. Wareham, Medicine, 2014, 42, 698–702 CrossRef PubMed.
- E. H. Yoo and S. Y. Lee, Sensors, 2010, 10, 4558–4576 CrossRef PubMed.
- E. Witkowska Nery, M. Kundys, P. S. Jeleń and M. Jönsson-Niedziółka, Anal. Chem., 2016, 88, 11271–11282 CrossRef PubMed.
- R. Dhakal, C. Wang, E. S. Kim and N. Y. Kim, Appl. Phys. Lett., 2015, 106, 073702 CrossRef.
- H. Park, H. Seo Yoon, U. Patil, R. Anoop, J. Lee, J. Lim, W. Lee and S. Chan Jun, Biosens. Bioelectron., 2014, 54, 141–145 CrossRef PubMed.
- Q. Zhang, A. Prabhu, A. San, J. F. Al-Sharab and K. Levon, Biosens. Bioelectron., 2015, 72, 100–106 CrossRef PubMed.
- Y. Yu, Q. Zhang, C. C. Chang, Y. Liu, Z. Yang, Y. Guo, Y. Wang, D. K. Galanakis, K. Levon and M. Rafailovich, Analyst, 2016, 141, 5607–5617 RSC.
- S. Haxha and J. Jhoja, IEEE Photonics J., 2016, 8, 1–11 Search PubMed.
- H. C. Wang and A. R. Lee, J. Food Drug Anal., 2015, 23, 191–200 CrossRef PubMed.
- C.-F. So, K.-S. Choi, T. K. Wong and J. W. Chung, Med. Devices: Evidence Res., 2012, 5, 45–52 Search PubMed.
- H. Choi, J. Naylon, S. Luzio, J. Beutler, J. Birchall, C. Martin and A. Porch, IEEE Trans. Microwave Theory Tech., 2015, 63, 3016–3025 Search PubMed.
- X. Xiao and Q. Li, IEEE Antennas Wirel. Propag. Lett., 2017, 16, 1040–1043 Search PubMed.
- M. M. Ahmadi and G. A. Jullien, IEEE Trans. Biomed. Circuits Syst., 2009, 3, 169–180 Search PubMed.
- S. Guha, F. I. Jamal and C. Wenger, Biosensors, 2017, 7, 42 CrossRef PubMed.
- H. J. Lee and J. G. Yook, Biosens. Bioelectron., 2014, 61, 448–459 CrossRef PubMed.
- T. Qiang, C. Wang and N. Y. Kim, Biosens. Bioelectron., 2017, 98, 357–363 CrossRef PubMed.
- N. Y. Kim, K. K. Adhikari, R. Dhakal, Z. Chuluunbaatar, C. Wang and E. S. Kim, Sci. Rep., 2015, 5, 7807 CrossRef PubMed.
- M. Shamonin, E. Shamonina, V. Kalinin and L. Solymar, J. Appl. Phys., 2004, 95, 3778–3784 CrossRef.
- A. Radkovskaya, M. Shamonin, C. J. Stevens, G. Faulkner, D. J. Edwards, E. Shamonina and L. Solymar, Microw. Opt. Technol. Lett., 2005, 46, 473–476 CrossRef.
- H. J. Lee and J. G. Yook, Appl. Phys. Lett., 2008, 92, 254103 CrossRef.
- Y. Li, C. Wang and N. Kim, IEEE Microw. Wirel. Compon. Lett., 2015, 25, 439–441 Search PubMed.
- C. Wang, W. S. Lee, F. Zhang and N. Y. Kim, Int. J. Adv. Manuf. Technol., 2011, 52, 1011–1018 CrossRef.
- T. Qiang, C. Wang and N. Y. Kim, Solid-State Electron., 2017, 134, 9–18 CrossRef.
- Y. I. Kim, T. S. Park, J. H. Kang, M. C. Lee, J. T. Kim, J. H. Park and H. K. Baik, Sens. Actuators, B, 2006, 119, 592–599 CrossRef.
- A. W. Zia, Y. Q. Wang and S. Lee, Adv. Polym. Technol., 2015, 34, 1–4 CrossRef.
- H. Y. Peng, M. Devarajan, T. T. Lee and D. Lacey, IEEE Trans. Compon., Packag., Manuf. Technol., 2015, 5, 562–569 Search PubMed.
- S. Afroz, S. W. Thomas, G. Mumcu and S. E. Saddow, Implantable SiC based RF antenna biosensor for continuous glucose monitoring, IEEE, Baltimore, 2013 Search PubMed.
- R. Dhakal, E. S. Kim, Y. H. Jo, S. S. Kim and N. Y. Kim, Med. Eng. Phys., 2017, 41, 55–62 CrossRef PubMed.
- W. Withayachumnankul, K. Jaruwongrungsee, A. Tuantranont, C. Fumeaux and D. Abbott, Sens. Actuators, A, 2013, 189, 233–237 CrossRef.
- S. Ryynänen, J. Food Eng., 1995, 26, 409–429 CrossRef.
- A. Olziersky, P. Barquinha, A. Vilà, L. Pereira, G. Gonçalves, E. Fortunato, R. Martins and J. R. Morante, J. Appl. Phys., 2010, 108, 064505 CrossRef.
Footnote |
| † Electronic supplementary information (ESI) available. See DOI: 10.1039/c8ra04243h |
| This journal is © The Royal Society of Chemistry 2018 |