
 Open Access Article
 This Open Access Article is licensed under a Creative Commons Attribution-Non Commercial 3.0 Unported Licence
Retracted Article: Organometallic Ag nanostructures prepared using Hypericum perforatum extract are highly effective against multidrug-resistant bacteria
Qaisar Maqbool ,
Dariusz Kruszka,
Piotr Kachlicki and
Gregory Franklin*
,
Dariusz Kruszka,
Piotr Kachlicki and
Gregory Franklin*
Institute of Plant Genetics of the Polish Academy of Sciences, 34 Strzeszynska Street, 60-479 Poznan, Poland. E-mail: fgre@igr.poznan.pl
First published on 29th August 2018
Abstract
Hypericum perforatum is a rich source of high-value plant secondary metabolites that have been used in the treatment of various ailments since ancient times. Herein, we report the conversion of bulk Ag+ ions into highly potent organometallic Ag nanostructures (OM-Ag-NS) using H. perforatum extract as a phytochelating agent for the first time. Analysis by X-ray diffraction (XRD) of OM-Ag-NS revealed that they are of a hybrid nature and include pure Ag crystal planes and Ag-organic-complex crystal planes. An investigation by scanning electron microscopy (SEM) of the NS revealed the rough nanocube-like morphology of OM-Ag-NS with an average particle size of 32 nm. Ultra-performance liquid chromatography-diode array detector (UPLC-DAD) and Fourier transform infrared (FTIR) spectroscopy of H. perforatum extract and the residue validated the utilization of phytochelating compounds in the synthesis process of OM-Ag-NS. Thermogravimetric analysis (TGA) supplemented the findings of UPLC-DAD and showed the thermal loss of the organic capping agent around OM-Ag-NS between 300 and 320 °C. NanoDrop-ultraviolet and visible (UV) spectroscopic analysis showed that the tailored bandgap energy of OM-Ag-NS was 2.82 eV. Moreover, compared with chemically stabilized Ag nanostructures (CS-Ag-NS), OM-Ag-NS exhibited promising performance against highly virulent multidrug-resistant Escherichia coli (NDM-1) and Klebsiella pneumoniae (KPC). Our current findings suggest that H. perforatum is a top candidate for tailoring the potential of NS towards various biological activities.
Introduction
Hypericum perforatum, which is commonly known as St. John's wort, is famous worldwide for its use in the treatment of mild to moderate depression. In addition, extracts of this herb possess antibacterial, antiviral, anti-inflammatory, anticancer, and antioxidant activities etc. owing to the presence of several secondary metabolites.1,2 Phytochemical analysis of H. perforatum extracts has revealed that they contain a variety of antioxidants with bioactive functional groups.3 Recent investigations also reported that hyperforin and hypericin obtained from H. perforatum are very effective in photoinduced catalysis, with remarkable activation at room temperature.4,5 Moreover, the high concentration of flavonoids (mainly quercetin and its derivatives) in H. perforatum extracts also endows them with greater antioxidant properties.2 Hence, we believe that this plant extract has tremendous potential in the fabrication of metallic nanostructures (MNS) as a chelating agent.Although several reports are available on the green synthesis of Ag nanostructures (Ag-NS) using various plant extracts, there are several outstanding questions that still need to be answered. These include the potential role of plant secondary metabolites in the heterogeneous mixture of compounds present in extracts in the conversion of metal salts into MNS, concentration- and metabolite-dependent changes in the morphology of MNS, the competitive behaviour of different molecules that participate as reducing or capping agents during the mechanism of the synthesis of MNS, the embedding of organometallic crystallites in hybrid MNS, the identification of the composition of hybrid MNS structures, and the role of particular capping agents around MNS in specific applications.6 Moreover, the use of extracts derived from medicinal plants such as H. perforatum might endow NS with better bioactivities, as NS produced by green synthesis are generally capable of capturing secondary metabolites from the extract used in the process. Ag NS are well known for their antimicrobial properties, and several Ag NS produced by green synthesis have been tested in this context. However, a comparative analysis of the biological activities of Ag NS produced by green synthesis and corresponding chemically synthesized Ag NS is lacking.7,8
Very importantly, the development of multidrug resistance (MDR) in harmful pathogenic bacteria is emerging as a serious threat to the human race by challenging leading antibiotics.9 According to a prediction by the World Health Organization (WHO), the death toll due to MDR may rise to millions by 2020 if we fail to develop efficient drugs for combating MDR.10 In order to succeed in this race, drug development needs to be one step ahead of MDR. Unfortunately, even world-leading antibiotics such as carbapenems and cephalosporins have lost their utility against MDR bacteria such as Escherichia coli (NDM-1 type) and Klebsiella pneumoniae (KPC type). These two highly virulent Gram-negative bacterial strains can cause life-threatening infections including severe bacteremia, cholecystitis, pneumonia, complicated skin infections, urinary tract infections (UTIs), severe gastritis, infections of the upper and lower respiratory tract, wound infections, meningitis and osteomyelitis.11,12 Thus far, synthetic and semi-synthetic drugs have not exhibited any significant control of these lethal bacterial strains.
MNS have acquired a wide range of applications in basic and applied fields of engineering, industry and biomedical sciences. In advanced biomedical applications, MNS have been well examined as anticancer agents,13 targeted drug delivery vehicles,14 DNA/RNA carriers,15 biosensors,16 nanocoating agents,17 nanocatalysts,18 antimicrobial agents,19 bioimaging agents,20 etc. On the other hand, the use of chemicals for the synthesis of MNS by chemical methods not only raises environmental concerns but is also costlier and less biocompatible than green methods. Low biocompatibility limits the effective use of MNS in advanced biomedical applications.21
The wide range of biomedical properties of Ag-NS is currently well known.23 Recently, Ag-NS prepared using extracts of plant species namely Otostegia limbata,22 Justicia adhatoda,24 Citrus limon,8 Rheum palmatum25 and Zingiber officinale26 have exhibited promising antibacterial activities. However, all these reports suggest that the efficacy of Ag-NS produced by green synthesis was more or less equal to that of synthetic drugs. Moreover, the antibacterial characteristics of Ag-NS produced by both chemical and green synthesis have only been tested against pathogens that are not resistant to common antibiotics such as quinolones and cephalosporins. Recent studies that have been conducted in this context are summarized in Table 1. Thus far, no study has reported on the antibacterial activity of MNS produced by green synthesis against MDR Escherichia coli (NDM-1 type) and Klebsiella pneumoniae (KPC type) bacterial strains.
| Mode of synthesis | Nanostructure and morphology | Bacterial strains examined (inhibited) | Ref. |
|---|---|---|---|
| Green (Rheum turkestanicum) | Nanoparticles, spherical (27 nm) | E. coli, S. aureus, B. subtilis, P. aeruginosa | 27 |
| Green (grass) | Nanoparticles, spherical (15 nm) | P. aeruginosa, A. baumannii | 28 |
| Green (green and black tea) | Nanoparticles, rough spherical (10–20 nm) | S. aureus | 29 |
| Green (B. purpurea) | Nanoparticles, spherical (20 nm) | K. pneumoniae, S. aureus | 30 |
| Green (sodium alginate) | Nanocomposite (50 nm) | E. coli, S. aureus | 31 |
| Green (Salvia leriifolia) | Nanoparticles, spherical (27 nm) | K. pneumoniae, P. aeruginosa, S. coagulase, A. baumannii, S. pneumoniae, E. coli, S. marcescens | 32 |
| Green (Phyllanthus amarus) | Nanoparticles, spherical (36 nm) | E. coli, B. subtilis, P. aeruginosa, S. aureus | 33 |
| Chemical (hydrogel) | Nanocomposite, heterogeneous (Ag-NS, 15 nm) | E. coli, B. subtilis | 7 |
| Chemical (radical polymerization) | Nanocomposite, polymeric (Ag-NS, 1–30 nm) | E. coli, S. aureus | 34 |
| Chemical (reduction) | Nanocluster | S. aureus | 35 |
| Chemical | Nanocomposite, heterogeneous (less than 100 nm) | S. mutans | 36 |
| Microbial (B. brevis) | Nanoparticles, spherical (41 nm) | S. typhi, S. aureus | 37 |
| Microbial (P. chrysosporium) | Nanoparticles, spherical (34–90 nm) | K. pneumoniae, P. aeruginosa, S. aureus, S. epidermidis | 38 |
| Physical (ultrasonic radiation) | Nanocomposite, heterogeneous (Ag-NS, 10 nm) | E. coli, B. subtilis | 39 |
| Hydrothermal/chemical | Nanocomposite, heterogeneous (Ag-NS, 5 nm) | E. coli, S. aureus | 40 |
Keeping this in consideration, we have prepared organometallic silver nanostructures (OM-Ag-NS) using H. perforatum extract and tested them against these highly virulent MDR bacterial strains. Our current contribution will make a useful addition to the synthesis of highly potent MNS mediated by H. perforatum.
Experimental procedures
Preparation of H. perforatum extract and synthesis of OM-Ag-NS
H. perforatum leaves were collected, frozen in liquid nitrogen and lyophilized for 24 h. A 10 g sample of dried leaves was homogenized with a mortar and pestle. Powdered samples were transferred into an Erlenmeyer flask containing 100 mL of 80% methanol (for LC-MS, Merck™). The flask was then shaken on an Orbi-Shaker (150 rpm, KS3000 IKA™) at 24 °C for 1 h. In the next step, the samples were subjected to sonication in an ultrasonic bath (Sonorex, Bandelin™) at 25 °C for 10 min. The extracts were filtered through a filter paper (2 W, 90 mm, Whatman™). The filtrate was evaporated to dryness under vacuum at 35 °C in a Rotavapor (Buchi™ R114). The dry residue of the extract was dissolved in 100 mL of ultrapure water (Milli-Q, Merck™).For H. perforatum extract mediated green synthesis of OM-Ag-NS, we modified a previously reported method.41 In brief, 3.38 g of AgNO3 (Sigma-Aldrich™) was added to an Erlenmeyer flask with 200 mL of ultrapure water (Milli-Q, Merck™) and mixed on a hot plate magnetic stirrer (IKA™) at 90 °C for 20 min. Then, the temperature was reduced to 65 °C. Subsequently, 20 mL of prepared H. perforatum extract was slowly added to the above solution, and the reaction was allowed to continue until the colour changed from light brown to deep brown (about 1 h). After this, the reaction mixture was allowed to cool to room temperature. OM-Ag-NS were pelleted by centrifugation at 10![[thin space (1/6-em)]](https://www.rsc.org/images/entities/char_2009.gif) 000 rpm (5804-R, Eppendorf™). The supernatant was preserved for further analysis. The collected pellets were repeatedly washed three times with deionized H2O to remove uncoordinated biomolecules from the NS and allowed to dry at 80 °C for 12 h in a hot air oven (ED-056, Sigma-Aldrich™). OM-Ag-NS were collected after drying and preserved in an airtight jar for further investigation. To determine the crystal parameters (XRD analysis), about 0.2 g of the NS were placed in a Carbolite ELF chamber furnace (Sigma-Aldrich™) for calcination for 2 h at 300 °C. The various steps performed in the synthesis of OM-Ag-NS are summarised in Fig. 1.
000 rpm (5804-R, Eppendorf™). The supernatant was preserved for further analysis. The collected pellets were repeatedly washed three times with deionized H2O to remove uncoordinated biomolecules from the NS and allowed to dry at 80 °C for 12 h in a hot air oven (ED-056, Sigma-Aldrich™). OM-Ag-NS were collected after drying and preserved in an airtight jar for further investigation. To determine the crystal parameters (XRD analysis), about 0.2 g of the NS were placed in a Carbolite ELF chamber furnace (Sigma-Aldrich™) for calcination for 2 h at 300 °C. The various steps performed in the synthesis of OM-Ag-NS are summarised in Fig. 1.
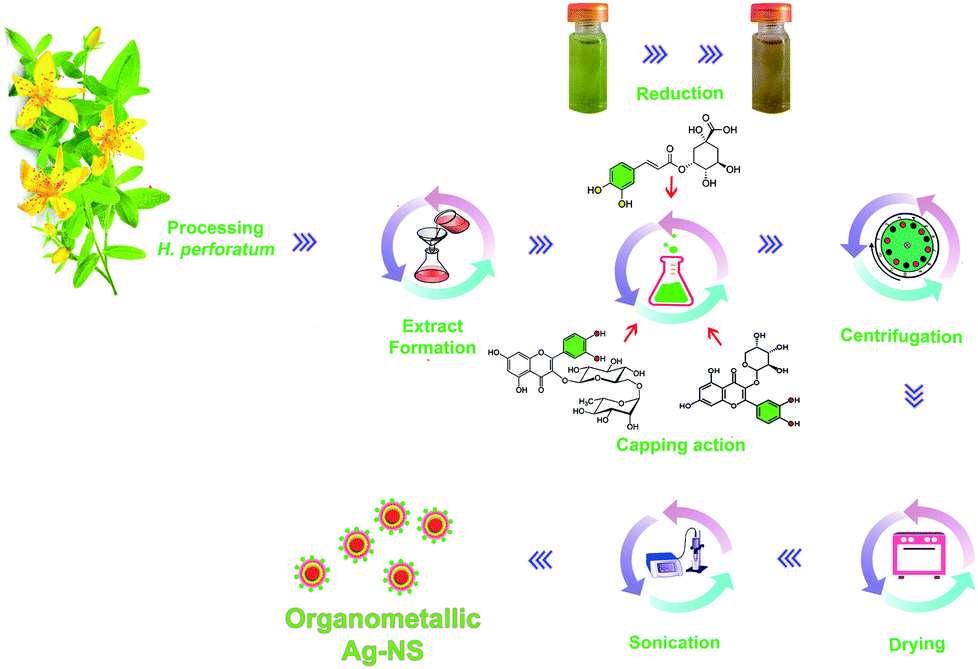 | ||
| Fig. 1 Scheme explaining the synthesis of organometallic Ag-NS. The different steps include plant processing, preparation of H. perforatum extract, filtration, reaction of AgNO3 with the plant extract (reduction and capping action), centrifugation, drying and sonication before characterization and application. | ||
Ultra-performance liquid chromatography-diode array detector (UPLC-DAD) analysis of plant extract (before and after synthesis of OM-Ag-NS)
Chromatographic separation and identification of bioactive molecules from H. perforatum extract before and after the synthesis of OM-Ag-NS was performed using an Acquity UPLC platform (Waters™) equipped with a BEH C18 column (150 × 2.1 mm, particle size 1.7 μm, Waters™) and a photodiode array detector (Waters™). Vials that were aliquoted with 1.5 mL samples were subjected to automated sample management in UPLC. The samples were separated at 40 °C. The mobile phases used for chromatographic separation were water with 0.1% formic acid (Buffer A) and acetonitrile (Buffer B). The following gradient was used: 5% B to 1 min, 15% B to 2 min, 20% B to 9 min, 99% B to 15 min, isocratic 99% B for 1 min, 5% B to 17 min and re-equilibration for 3 min. The flow rate was set at 350 μL min−1. The temperature of the sample manager was 8 °C, and the injection volume was 2 μL. The ultraviolet and visible (UV) absorbance was measured in the wavelength range of 220–600 nm. Later, chromatograms were collected at 330 nm and comparatively analysed.Identification of compounds using liquid chromatography-mass spectrometry (LC-MS)
Polyphenolic metabolites were identified using two systems of liquid chromatography coupled to mass spectrometers, as described previously.42 The first system consisted of an Agilent 1100 HPLC system coupled to an Esquire 3000 (Bruker Daltonics) ion trap mass spectrometer, and the second system comprised a UPLC system (Acquity, Waters) coupled to a Q-Exactive hybrid MS/MS quadrupole-Orbitrap instrument (Thermo). Compounds were identified according to the exact masses of their [M + H]+ and [M − H]− ions and their fragmentation patterns and chromatographic retention times by comparison with standard compounds (purchased from Sigma-Aldrich and Extrasynthese) or compounds previously purified in our laboratory and identified using NMR methods.Structural and morphological examination of OM-Ag-NS produced by green synthesis
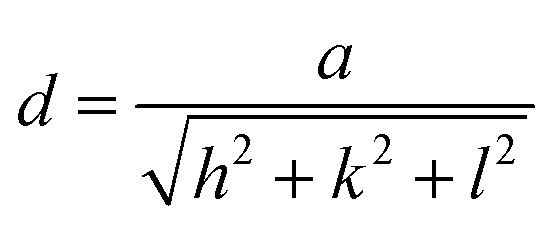
The size and morphology of OM-Ag-NS produced by green synthesis were investigated using scanning electron microscopy (SEM) (JEOL JSM-6490LA™) operated at a voltage of 20 kV (maximum) with a counting frequency of 2838 cps (maximum) coupled with energy-dispersive X-ray spectroscopy (EDX) for in-depth elemental analysis of samples. Magnified micrographs were taken down to a resolution of 0.5 μm.An examination of the organometallic structure, crystallite parameters and phase purity of the prepared OM-Ag-NS was performed using an X-ray diffraction (XRD) instrument (X'Pert3 Powder, PANalytical™). The angle of diffraction (2θ) was adjusted between 20° and 80°. A Cu Kα source of accelerated radiation was used with a wavelength of 1.5406 Å. The operating voltage during the experiment was 40 kV, and a current of 30 mA was provided in an ambient environment. The crystallite size of OM-Ag-NS was calculated using the following Debye–Scherrer equation:
|
D = 0.9λ/βcosθ
| (1) |
 | (2) |
sinθ = nλ, and h, k, and l are the Miller indices. The unit cell volume was determined using the following formula:| V = a3 | (3) |
Optical, vibrational and thermogravimetric analysis (TGA)
The optical properties of OM-Ag-NS were examined using a NanoDrop™ One/OneC microvolume UV-vis spectrophotometer (Thermo Fisher™) under ambient conditions. The wavelength was adjusted between 190 and 800 nm in automated path length correction mode. One drop of a 1 mg/10 mL suspension of OM-Ag-NS was used for scanning. In a similar manner, H. perforatum extract was also subjected to UV-vis analysis. After the full scan, data maps were manipulated using OriginPro™ 8.5 software. In order to measure the bandgap energy of OM-Ag-NS, the Tauc relation was applied.13Fourier transform infrared (FTIR) analysis of H. perforatum extract before and after the synthesis of OM-Ag-NS and isolated OM-Ag-NS was performed using an IRTracer-100 spectrometer (Shimadzu™). The KBr pellet method was adopted in the wavenumber range of 400–4000 cm−1. A comparative analysis of all three FTIR spectra was made using OriginPro™ 8.5 software. Moreover, in order to trace the progressive weight loss of OM-Ag-NS with an increase in temperature, TGA was conducted using a TGA 8000 analyzer (PerkinElmer™). The temperature increase was adjusted between 10 °C and 800 °C with increments of 10 °C per min.
Antibacterial activity assay
The antibacterial potential of OM-Ag-NS produced by green synthesis and chemically stabilized Ag nanostructures (CS-Ag-NS) was examined against highly virulent multidrug-resistant Escherichia coli (NDM-1, BAA-2452™) and Klebsiella pneumoniae (KPC, BAA-1898™) bacterial strains. CS-Ag-NS were purchased from Sigma-Aldrich™ (product code: 730793) and had a mean size of 20 nm (spherical shape) as stated by the manufacturer. The disc diffusion method was adopted with slight modifications.19 In brief, bacteria were cultured in LB nutrient broth (Sigma-Aldrich™) until the bacterial density reached 1.5 × 10⁸ CFU mL−1. Bacterial suspensions were spread onto Petri dishes containing about 20 mL of pre-autoclaved nutrient agar. Sterile discs of Whatman no. 1 filter paper loaded with 20 μg mL−1 OM-Ag-NS and CS-Ag-NS were placed on the medium. To test the antibacterial potential of H. perforatum extract, discs loaded with 5 μL of the extract were used. Furthermore, discs that were impregnated with doripenem and cefixime were used for comparison. Deionized H2O was used as a negative control. All the plates were incubated at 37 °C for 24 h, and the zone of inhibition (ZOI) was measured.Results and discussion
NS can be synthesized via various means, such as physical, chemical and biological methods.6 Biological methods, which are also known as green synthesis, can be carried out using cultures of bacteria, fungi and plants. Facile synthesis routes using plant extracts are advantageous in comparison with other methods, as the use of synthetic reagents and microbes results in poor biocompatibility and also limits the bulk production of NS.6,43 There are also other problems such as microbial contamination and health hazards. On the other hand, NS can be safely produced by plant-extract-mediated synthesis in large quantities, even on an industrial scale, because of the outstanding availability and low cost of the raw material.19The different steps performed in the present study for the fabrication of OM-Ag-NS using H. perforatum extract are shown in Fig. 1. As the reaction proceeded at 65 °C, the colour of the reaction mixture changed from light green to dirty green, which evidenced the simultaneous reducing and capping actions of secondary metabolites of H. perforatum.
In order to preserve the hybrid nature of OM-Ag-NS, it is important to mention here that the pellets of NS obtained after centrifugation of the reaction mixture at 10000 rpm were not subjected to calcination at high temperature. Decomposition of phytocapping agents can occur at high temperatures, which might limit the surface-based reactivity of OM-Ag-NS during their antimicrobial action.6
HPLC profiles of H. perforatum extract before and after the synthesis of OM-Ag-NS are shown in Fig. 2. The chromatograms show the presence of neochlorogenic acid (RT = 3.34, λmax = 243 nm), 3-p-coumaroylquinic acid (RT = 3.71, λmax = 233 nm), rutin (RT = 6.02, λmax = 257 nm), quercetin glucoside (RT = 6.34, λmax = 257 nm), quercetin galactoside (RT = 6.58, λmax = 257 nm), kaempferol-O-hexoside (RT = 7.51, λmax = 252 nm), quercetin-3-arabinoside (RT = 7.77, λmax = 252 nm), quercetin-3-O-(6′′-malonylglucoside) (RT = 8.04, λmax = 252 nm) and quercetin-3-O-α-L-rhamnopyranoside (RT = 8.47, λmax = 252 nm). The declines in the concentrations of neochlorogenic acid, quercetin glucoside and quercetin-3-arabinoside (Fig. 2b) indicate that these molecules have actively participated in the formation of OM-Ag-NS.
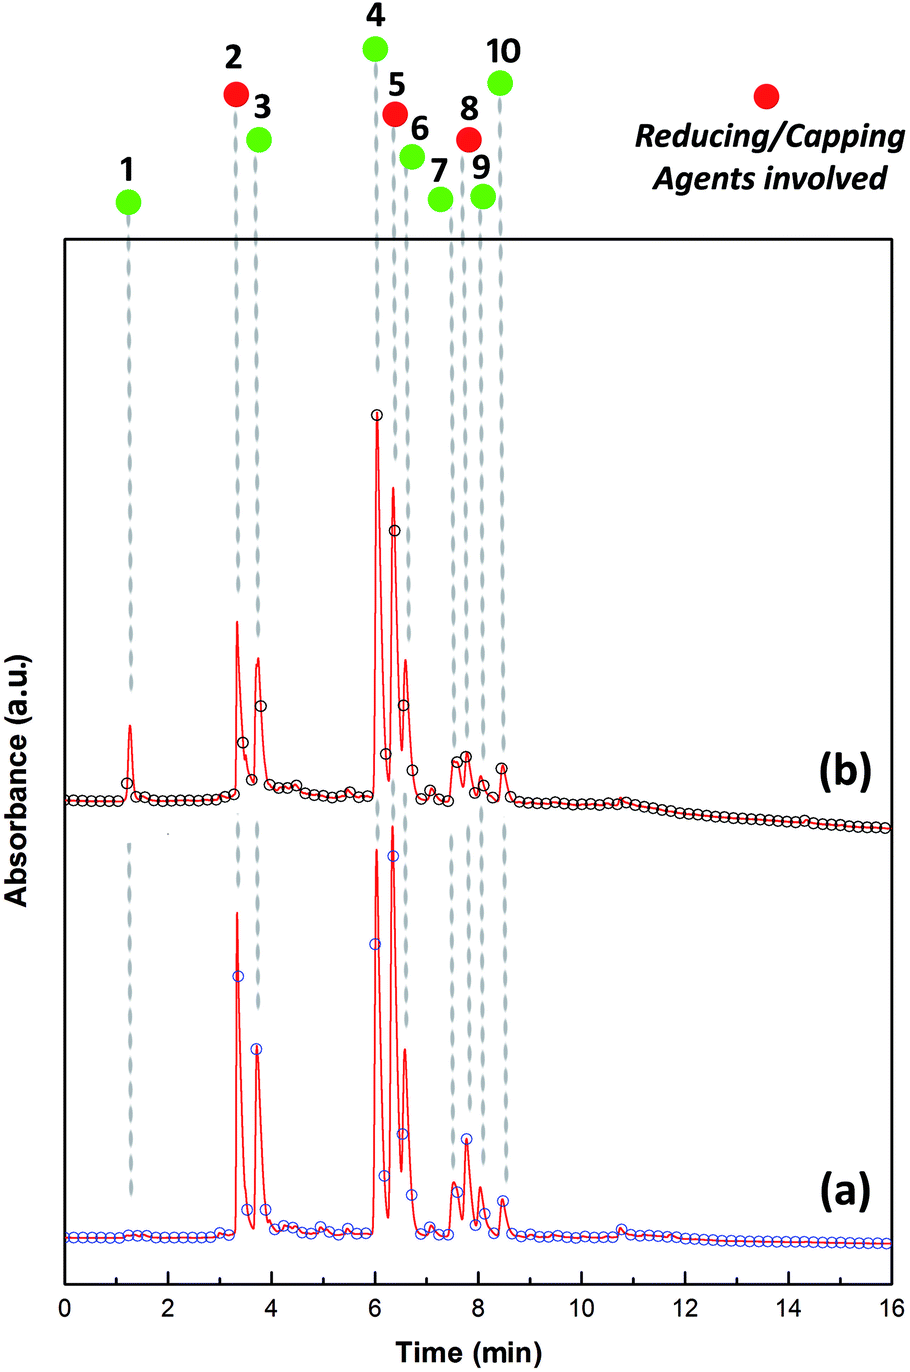 | ||
| Fig. 2 UPLC-DAD chromatograms showing the secondary metabolite profile of H. perforatum extract (a) before and (b) after the synthesis of OM-Ag-NS. The peaks correspond to: 1 = mixture of complex compounds, 2 = neochlorogenic acid, 3 = 3-p-coumaroylquinic acid, 4 = rutin, 5 = quercetin glucoside, 6 = quercetin galactoside, 7 = kaempferol-O-hexoside, 8 = quercetin-3-arabinoside, 9 = quercetin-3-O-(6′′-malonylglucoside) and 10 = quercetin-3-O-α-L-rhamnopyranoside. | ||
H. perforatum extract is a rich source of secondary metabolites, and the literature also provides sufficient evidence of the presence of various compounds in this plant. Secondary metabolites with higher concentrations, mainly flavonoids, are involved in the synthesis process of OM-Ag-NS. Fig. 2b illustrates the consumption of secondary metabolites during the conversion of the bulk Ag ions into highly homogenized and extremely small OM-Ag-NS. The heterogeneous mixture of H. perforatum compounds contributed to the initial redox reaction by initiating the crystal growth of Ag from Ag0 after the prior saturation of Ag–OH complexes. In this way, the reaction would continue until the defined growth of all the Ag crystal planes. As the Ag atomic planes started to grow to orient the formation of the unit cell, this led to the formation of crystallite planes with different energies. Secondary metabolites from H. perforatum were attracted towards the higher-energy crystallite planes and acted as capping agents to stunt growth. During this process, the surface attachment of secondary metabolites would be greatest on the larger crystallite growth planes because of the large surface-area-to-energy ratio at the reaction temperature of 65 °C. The reaction would progress until the attachment of all the activated capping agents. Finally, there was a cluster of crystallite aggregates that formed the specific shape of OM-Ag-NS. The whole concept of the formation mechanism of OM-Ag-NS is summarized in Fig. 3.
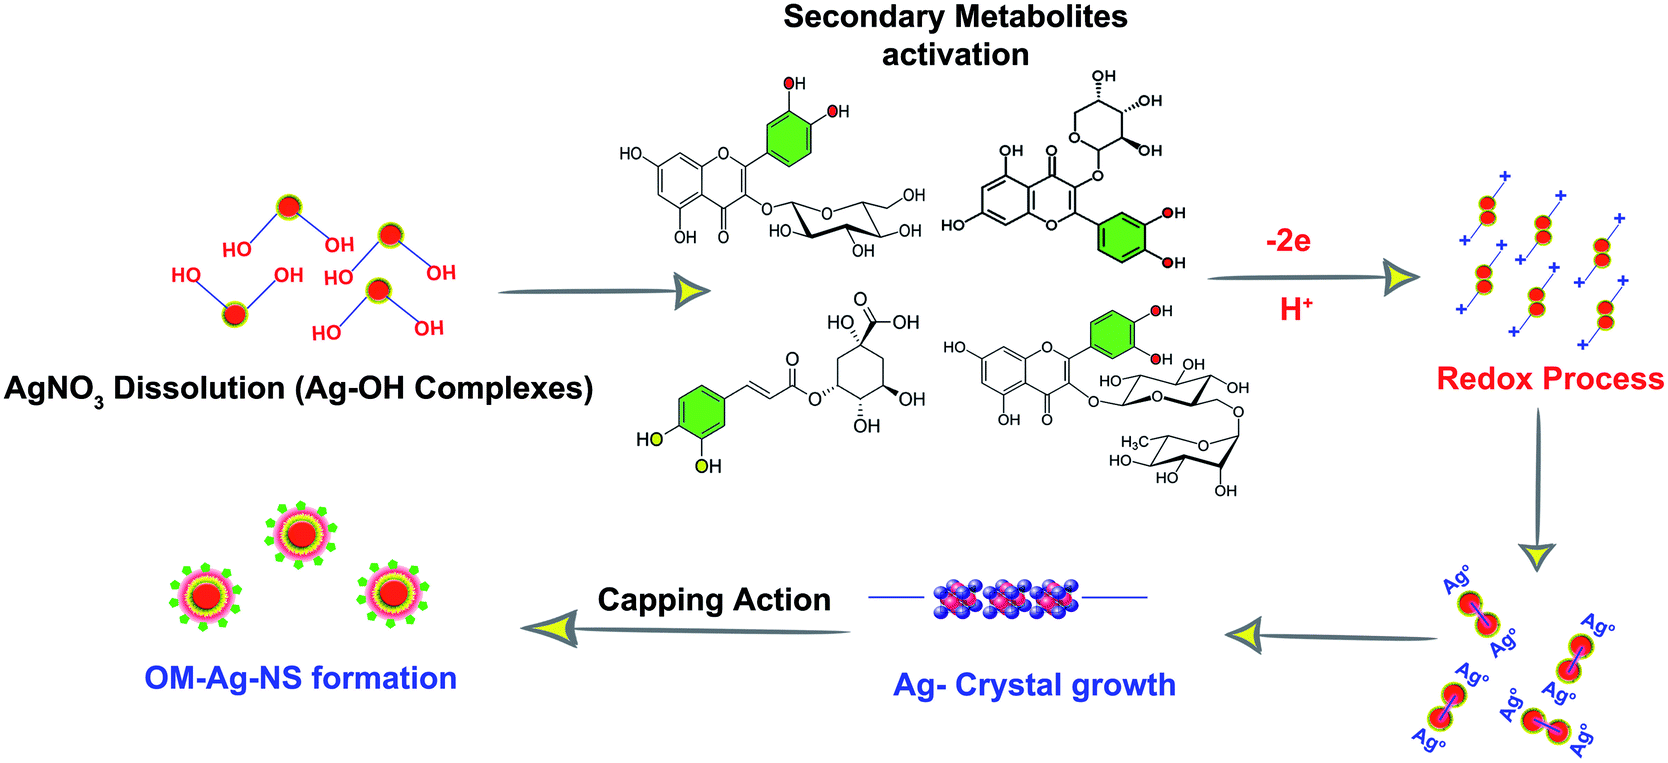 | ||
| Fig. 3 Plausible mechanism involved in the synthesis of OM-Ag-NS using H. perforatum extract. The reaction starts with the supersaturation of Ag to form AgOH, and then the formation of Ag0 leads to the crystal growth of Ag as a result of activation by secondary metabolites from H. perforatum extract. The structures of the secondary metabolites highlighted in green represent the available sites for redox reaction. The final step comprises nucleation, the sustainable growth of Ag crystallites and the capping action of secondary metabolites. | ||
Fig. 4 illustrates the crystallographic parameters of OM-Ag-NS. The broad Bragg peaks correspond to (111), (200), (220) and (311) planes and are well matched to the Joint Committee on Powder Diffraction Standards (JCPDS) card no. 04-0783. With the help of the Scherrer equation, from the broadening of the peaks the average crystallite size of OM-Ag-NS was found to be 6 nm, and the calculated value of the lattice constant a is 0.59 nm with a unit cell volume V of 0.20 nm3.
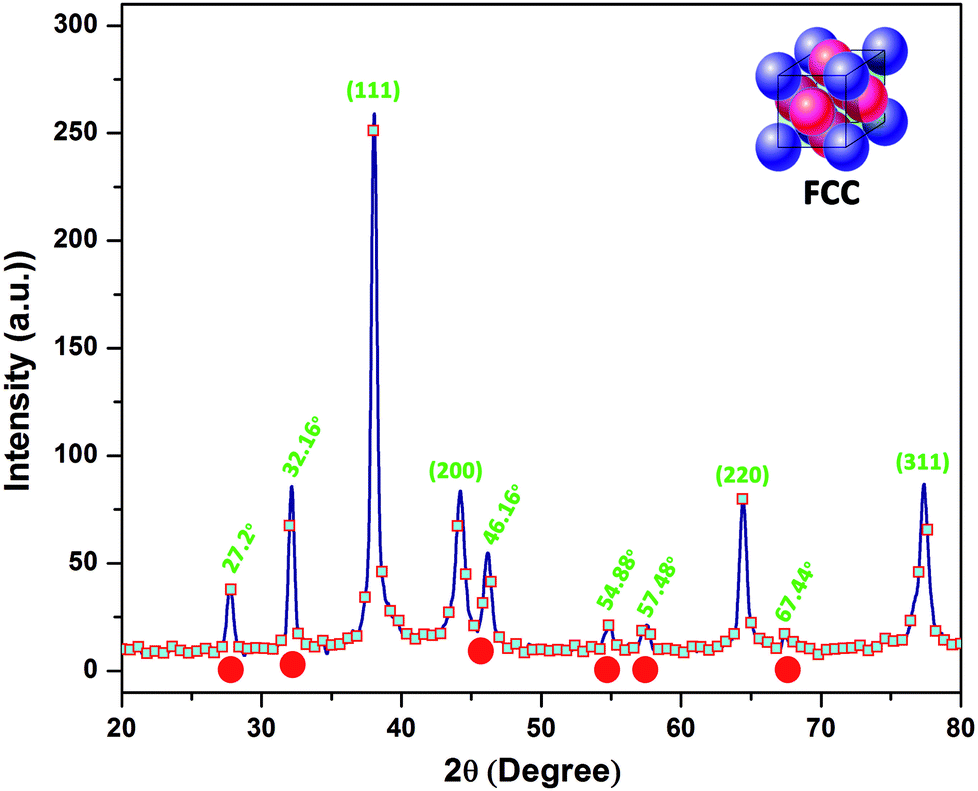 | ||
| Fig. 4 Crystallographic parameters of OM-Ag-NS showing Bragg diffraction peaks related to Ag crystallite planes (111, 200, 220 and 311) and organometallic traces (27.2°, 32.16°, 46.16°, 54.88°, 57.48° and 67.44°). | ||
The crystallographic parameters of OM-Ag-NS reveal three types of crystal structure. The face-centered cubic (fcc) structure of OM-Ag-NS is preserved in pure crystal planes (111, 200, 220 and 311), as reported previously.44 The XRD peaks of OM-Ag-NS at 27.20°, 32.16°, 46.16°, 54.88°, 57.48° and 67.44° correspond to the formation of a symmetric organometallic structure, as reported in a previous investigation.41 Furthermore, the diffraction peaks at 32.16°, 46.16°, 54.88°, 57.48° and 67.44° clearly match the JCPDS card no. 31-1238, which indicates the formation of AgCl crystal planes. Prominent AgCl crystal planes have commonly been observed during the process of the plant-extract-mediated synthesis of Ag-NS.45 The Cl ions involved in the crystal growth might have been derived from the plant extract during the synthesis of Ag-NS. Moreover, it is evident from the UPLC-DAD chromatograms that a major fraction of phytochemicals from H. perforatum extract comprises quercetin derivatives such as rutin, quercetin glucoside, quercetin galactoside, kaempferol-O-hexoside, quercetin-3-arabinoside, quercetin-3-O-(6′′-malonylglucoside) and quercetin-3-O-α-L-rhamnopyranoside. The diffraction peak observed at 27.20° strongly suggests the involvement of quercetin derivatives during the formation phase of OM-Ag-NS. This diffraction peak due to quercetin is well supported by previously reported XRD diffractograms.46,47 NS carrying quercetin used in drug delivery have also displayed a typical diffraction peak at 27° when observed by XRD.48 During the crystal growth of Ag, some higher-energy Ag ions were rapidly and individually captured by phytoreductants, which resulted in the creation of smaller organometallic clusters embedded between the crystal planes of OM-Ag-NS. The diffraction peaks also indicate the high degree of reactivity and affinity of the phytochelating agents (such as flavonoids and phenolic acid derivatives) in H. perforatum extract. Because these tiny crystal planes do not fit into the pure Ag crystal planes, they appear separately at different X-ray diffraction angles. The growth of these small organometallic planes was found to be limited because of the higher molecular attraction energy of growing Ag crystal planes. This competition between the attachment of phytochelating agents to different planes does not allow the organometallic phase to grow quickly49 and more widely within the Ag crystal planes. The higher is the energy of growing planes, the greater will be the activation and surface attachment of capping agents around NS to arrest the growth of growing crystalline units.19,50 All these changes will ultimately generate NS of uniform size.
SEM images shown in Fig. 5 reveal the roughly nanocube-like homogeneous structures of OM-Ag-NS with an average size of about 32 nm. EDX findings show that the mass of a single OM-Ag-NS was composed of Ag (91%) together with a certain proportion of C atoms (9%), which mainly originated from the skeletons of secondary metabolites (reducing and capping agents). Moreover, the reactivity and polarizability of the secondary metabolites were sufficient to limit the size of OM-Ag-NS to 32 nm at the reaction temperature of 65 °C. The slight agglomeration seen in the SEM images (Fig. 5) was due to the presence of organic capping agents around the prepared OM-Ag-NS, which made them sticky.8
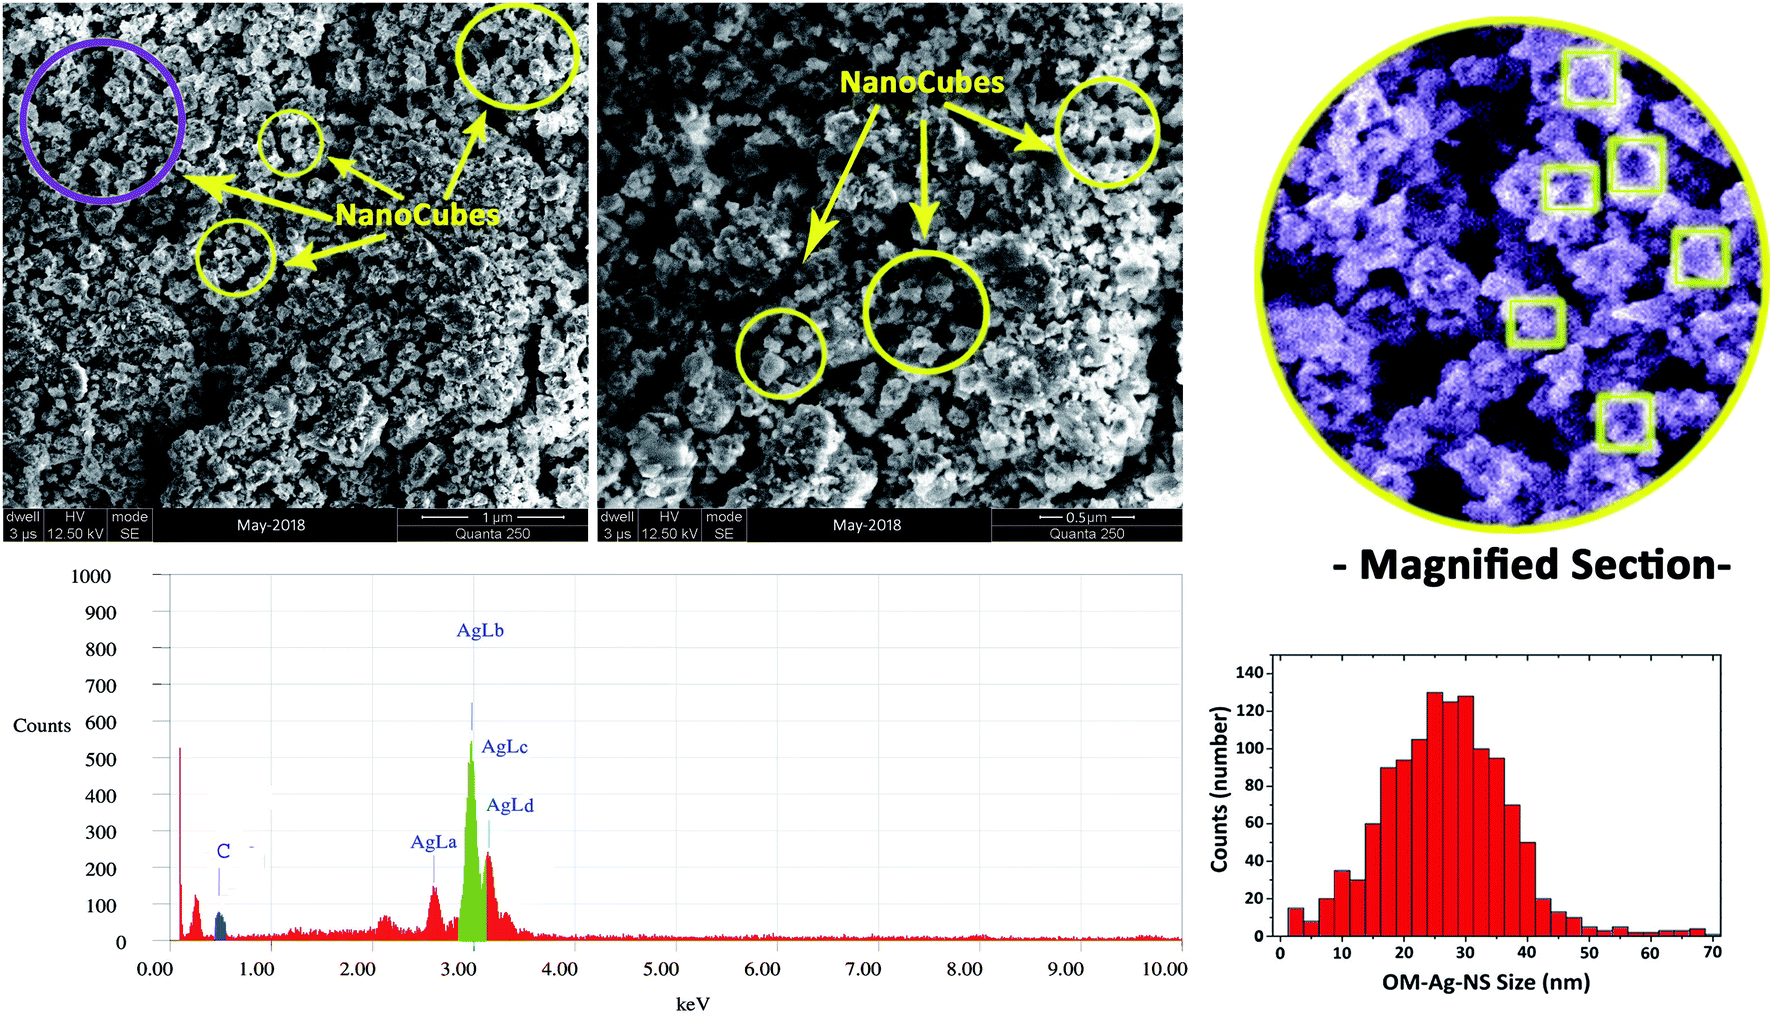 | ||
| Fig. 5 SEM images with EDX spectrum. A magnified section of an SEM image is also shown on the right. Homogenized OM-Ag-NS are marked with highlighted circles. A histogram showing the size distribution of OM-Ag-NS is at the bottom right. | ||
The UV spectrum of OM-Ag-NS is depicted in Fig. 6. The characteristic absorption peak of OM-Ag-NS appeared at 420 nm. The bandgap energy of OM-Ag-NS was calculated using the following Tauc equation for direct-bandgap materials:
| (αhν)2 = A(hν − Eg) | (4) |
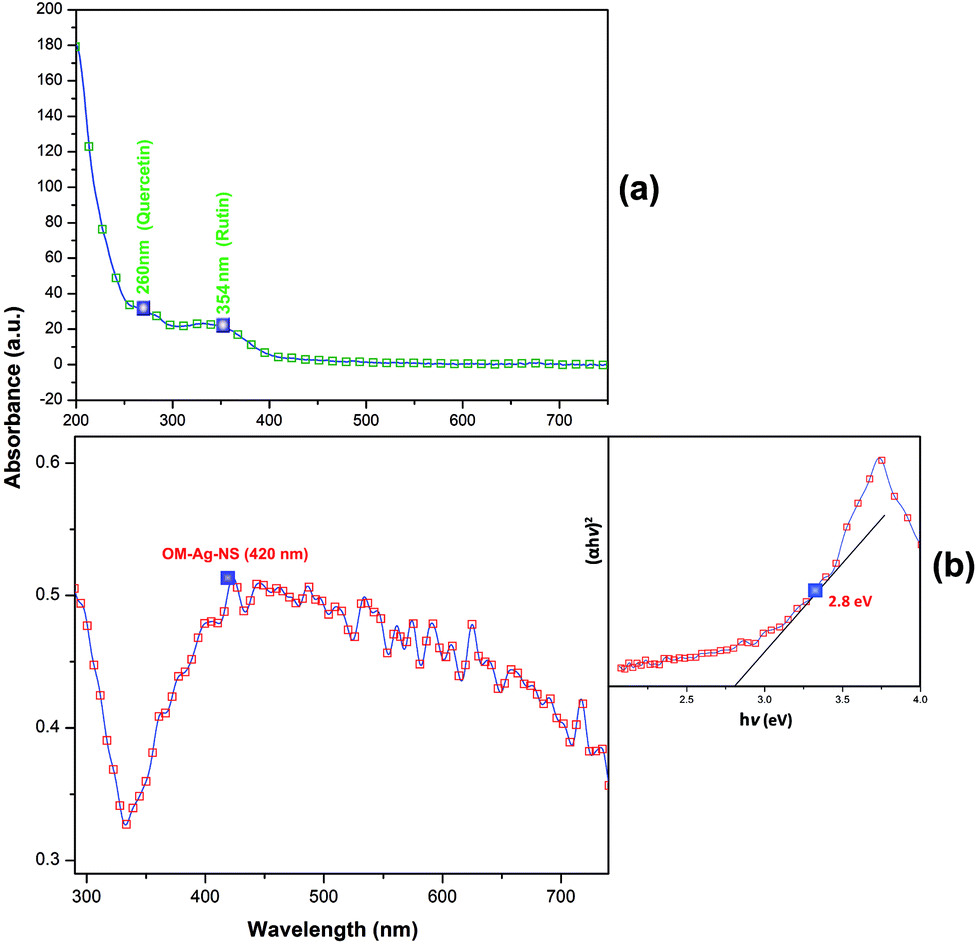 | ||
| Fig. 6 (a) UV spectrum of H. perforatum extract showing prominent absorption peaks related to quercetin derivatives at 260 nm and 354 nm. (b) Optical properties of OM-Ag-NS produced by green synthesis showing UV spectrum (absorption at 420 nm) and calculated bandgap energy of OM-Ag-NS. | ||
A comparative FTIR analysis of H. perforatum extract, its residue after the synthesis of NS and OM-Ag-NS is shown in Fig. 7a. Some of the vibrations between 2500 and 4000 cm−1 correspond to C–O–H, H–O–H, C–O, C–C and C–H bonds. Relatively intense peaks related to the flavonoid functional group appeared around 3400 cm−1. For OM-Ag-NS, the characteristic frequencies of Ag–Ag bonds were observed between 530 and 550 cm−1. OM-Ag-NS also provided evidence of peaks related to flavonoids. The results of FTIR analysis also reveal similar findings to those observed from UPLC-DAD. The flavonoid peak was closely studied for all three samples. Interestingly, these bond vibrations lost their intensity for the residue sample. This mainly happened because of the utilization of flavonoids during the capping action around OM-Ag-NS. Moreover, there were additional bond vibrations that arose from fragments of compounds for the residue sample only. This indicates the active breakdown of flavonoids at the start of the reaction (formation of OM-Ag-NS). The FTIR analysis of OM-Ag-NS also revealed the presence of biocapping agents. This was certainly expected because of the capping action of flavonoids, which was also supported by the findings of UPLC-DAD. The bond frequencies due to the pure Ag phase observed between 530 and 550 cm−1 also closely corresponded to the previous literature.22,60
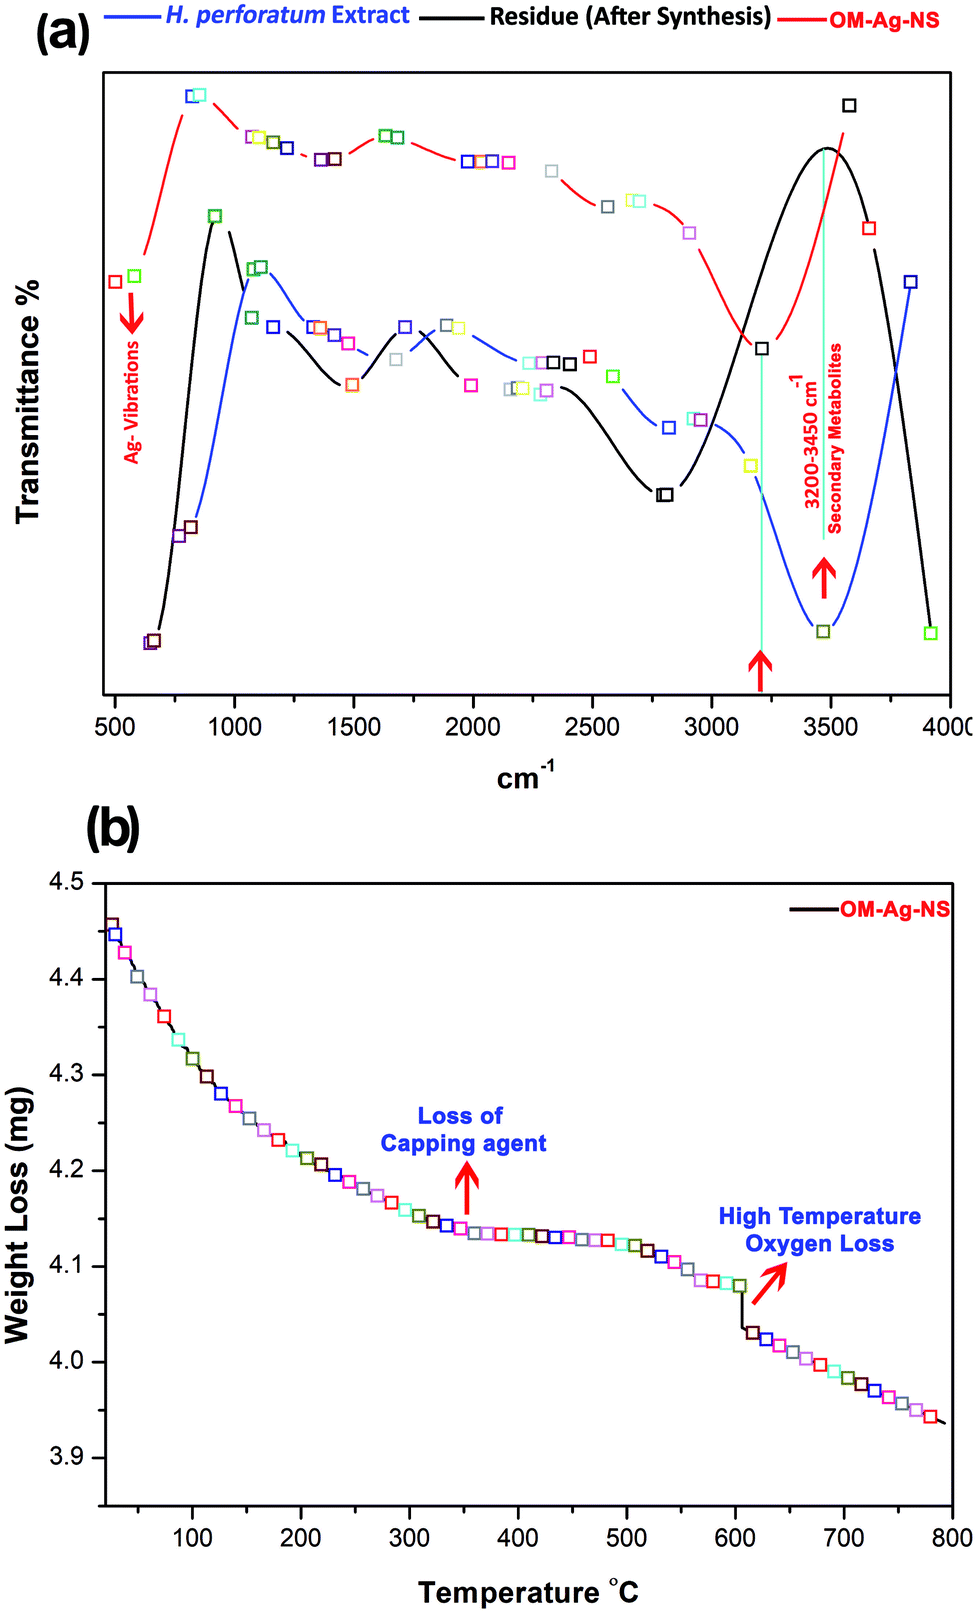 | ||
| Fig. 7 Vibrational (FTIR) and thermogravimetric (TGA) examination of OM-Ag-NS. (a) Comparison of FTIR spectra of H. perforatum extract (blue), residue (black) and OM-Ag-NS (red). (b) TGA plot showing progressive weight loss of OM-Ag-NS with an increase in temperature. | ||
Fig. 7b shows the progressive weight loss of OM-Ag-NS in three steps with an increase in temperature from 10 °C to 800 °C at a rate of 10 °C per min. The first step, which happened between 90 °C and 160 °C, might be due to the loss of surface adsorbed water molecules and some hexose ring molecules around 146 °C. The second step of the weight loss was due to the complete loss of the biocapping agent at 315–318 °C. The third step confirms the loss of oxygen at a high temperature of around 600 °C. The TGA findings of the current experiment also closely coincide with the mechanism described earlier in the text and observed with the help of UPLC-DAD, XRD and FTIR. The systematic loss of the biocapping agent from the surface of OM-Ag-NS occurred after the thermal loss of water molecules, as reported previously.41,61
Antibacterial activity of OM-Ag-NS
The antibacterial activity of OM-Ag-NS, CS-Ag-NS, H. perforatum extract, doripenem and cefixime is shown in Fig. 8. OM-Ag-NS successfully inhibited highly virulent multidrug-resistant E. coli (NDM-1) and K. pneumoniae (KPC), with ZOIs diameters of about 28 mm and 25.5 mm, respectively. H. perforatum extract gave rise to ZOIs with diameters of about 5 mm and 8 mm against E. coli (NDM-1) and K. pneumoniae (KPC), respectively. On the other hand, CS-Ag-NS displayed poor performance, with a ZOI with a diameter of 5 mm for E. coli (NDM-1) only. The growth of K. pneumoniae (KPC) was not inhibited by CS-Ag-NS at all. The tested drugs (doripenem and cefixime) did not produce any ZOI, which also confirms the multidrug resistance behaviour of the tested strains.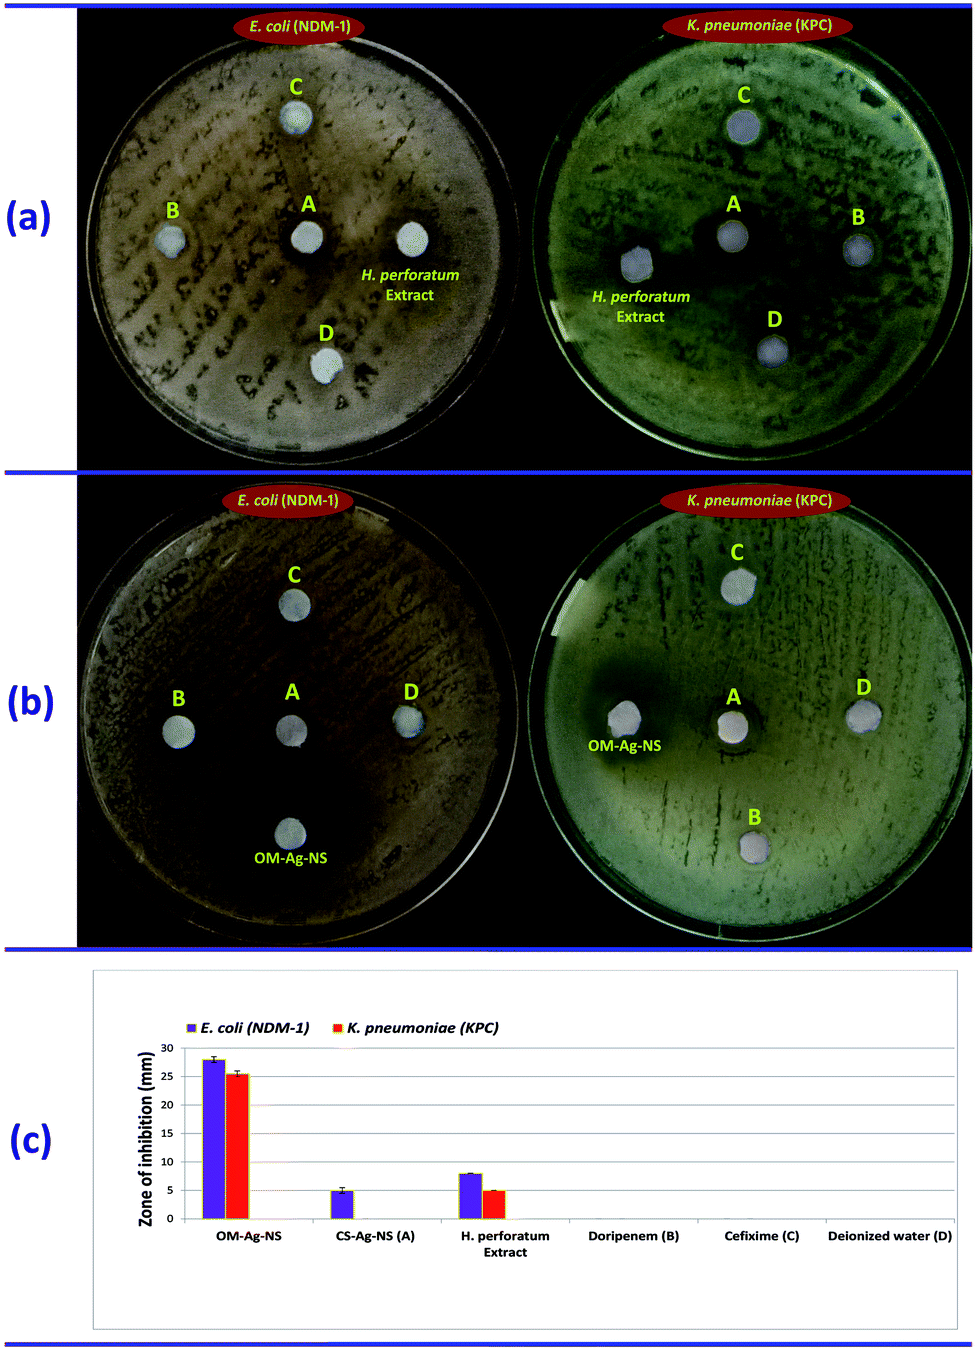 | ||
| Fig. 8 (a) Antibacterial activity of 5 μL of H. perforatum extract against E. coli (NDM-1) and K. pneumoniae (KPC). (b) Antibacterial activity of 20 μg mL−1 of OM-Ag-NS against E. coli (NDM-1) and K. pneumoniae (KPC). (c) Graph showing a comparison of ZOI from various treatments. A = CS-Ag-NS (20 μg mL−1), B = doripenem (2 mg mL−1), C = cefixime (2 mg mL−1), and D = deionized water. | ||
Findings from UPLC-DAD, XRD, SEM, UV and TGA also support the antibacterial ability of OM-Ag-NS. Remarkably, according to our knowledge, no significant report concerning the growth inhibition of the MDR bacteria, which was the subject of a report by the WHO,10 has been reported this year (2018). It is evident from Table 1 that the activity of Ag-NS has been tested against some bacterial strains. However, all these strains are equally inhibited by commonly used drugs. In contrast, secondary metabolites from H. perforatum extract have excitingly converted Ag ions into a highly potent OM-Ag-NS, which resulted in complete inhibition of the growth of E. coli (NDM-1) and K. pneumoniae (KPC) in our study.
The efficacy of OM-Ag-NS for inhibiting the growth of MDR bacteria can be explained via three steps, as illustrated in Fig. 9. The first step involves the electrostatic force of the attraction of the NS towards the bacterial cell envelope. Probably, owing to their opposite charge, NS could have been attracted towards the bacterial outer envelope.19 Different plants contain different kinds of phytochemicals. Hence, owing to differences in the physicochemical properties of capping agents around metallic NS, NS that have different capping agents behave differently in their chemical coordination with bacterial cell walls.43,62,63 Chemically synthesized metallic NS and NS calcined at high temperatures for superior crystallinity usually lack organic capping agents.64 They can therefore easily be recognized by the bacterial cell surface as a heavy metal during the process of surface attachment, which is one of the main mechanisms recently investigated regarding the development of bacterial resistance towards Ag-NS.65 On the other hand, metallic NS synthesized by green chemistry possess organic capping agents and organometallic crystallographic geometry at the molecular level.6,50 The typical organometallic composition of OM-Ag-NS might have helped the rapid and resistance-free transport of the NS across the bacterial cell wall. It is highly possible that the organic layer in OM-Ag-NS might interact with the surface of the bacterial envelope, which is composed of molecules such as lipopolysaccharides. A Gram-negative bacterial cell is usually protected by a lipopolysaccharide layer of about 3 μm with a negative charge and peptidoglycan layers with thicknesses of 6–8 nm.56,66 These are the main barriers to the successful entry of antibacterial agents into the cells. Most drugs can be trapped by these organic cages. However, owing to the hybrid chemistry, opposite charge (OM-Ag-NS with positive charge and bacterial envelope with negative charge) and higher surface reactivity of OM-Ag-NS, they could probably overcome these barriers and successfully enter bacterial cells. This surface interaction of OM-Ag-NS can directly disrupt the integrity of the cell wall, which ultimately results in the loss of cell homeostasis.
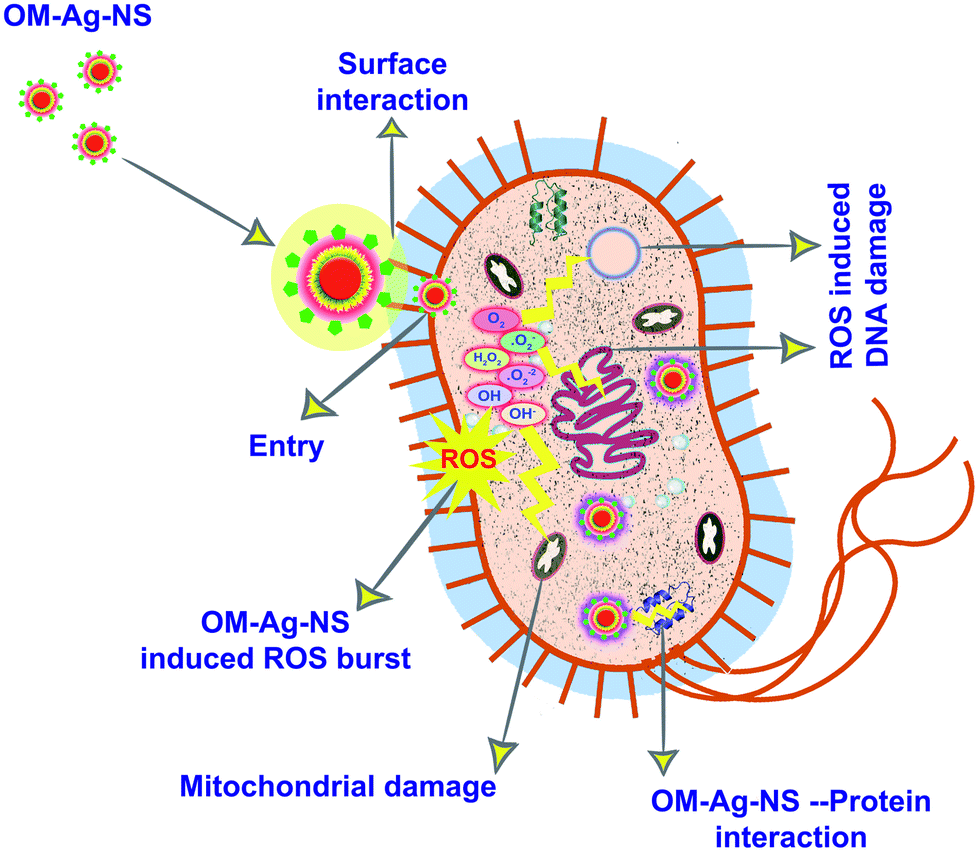 | ||
| Fig. 9 Proposed mechanism of antibacterial activity of OM-Ag-NS. First step: The presence of an organic capping agent around OM-Ag-NS facilitates their surface attachment to the bacterial envelope. Second step: Elaboration of the interaction of OM-Ag-NS with cellular components. Third step: Induction of the production of reactive oxygen species (ROS) by OM-Ag-NS. | ||
In the second step, an Ag complex from OM-Ag-NS is attracted to a group of cysteine-rich proteins inside the bacterial cell. This can disrupt some important enzymes by breaking S–S bridges between the peptide chains. In addition, the release of Ag+ ions from OM-Ag-NS might generate lethal ROS. It has been reported that highly activated Ag+ ions from the surface of NS are about 48 times more lethal.67 ROS usually include hydroxyl (OH) radicals and oxygen species (1O2, −*O2, and O2−).56 The production of ROS induced by OM-Ag-NS is closely linked with photoinduced surface activation, photoinduced electron–hole pairs, the rate of activation, surface charge, properties of the NS, the size of the NS and differences between energy levels of electrons. In our experiment, the tailored bandgap energy of OM-Ag-NS supports the photoexcitation of surface Ag ions.26 Hence, the production of ROS induced by Ag can occur via the following chain reaction:
| Ag + hv → e− + h+h+ + H2O → OH + H + e− + O2 → −O2−O2 + H+ → HO2·HO2 + H+ + e− → H2O2 |
In the final step, a lethal amount of ROS generated within the bacterial cell could interact with different cellular components and lead to DNA damage, mitochondrial enzyme dysfunction, inhibition of respiratory enzymes, damage to structural proteins and destruction of the overall cellular metabolism, which ultimately leads to necrosis of the bacterial cell.68
Conclusion and prospects
In summary, we conclude with the following outcomes:• The active participation of secondary metabolites from H. perforatum extract as phytoreducing and phytocapping agents enhanced the physicochemical parameters of OM-Ag-NS.
• Comparative analysis by UPLC-DAD and FTIR provided knowledge about the different phytochemicals involved in the synthesis of OM-Ag-NS mediated by H. perforatum extract. The use of UPLC-DAD in comparative mode has not thus far been reported for identifying secondary metabolites from plant extracts involved in the fabrication of NS. In the future, this comparative method will provide more knowledge for a better understanding of mechanisms of green synthesis.
• XRD crystallography showed the hybrid nature of the prepared OM-Ag-NS, with a pure phase of Ag crystals and organometallic Ag complexes. The progressive weight loss of OM-Ag-NS shown by TGA also indicates the involvement of bioactive secondary metabolites from H. perforatum extract.
• The growth of highly virulent MDR bacteria, namely, E. coli (NDM-1) and K. pneumoniae (KPC) was robustly inhibited by OM-Ag-NS in comparison with CS-Ag-NS, H. perforatum extract and antibiotics. This exemplary performance highlights the future potential of biocapped metallic NS in antimicrobial therapies against MDR pathogens after a complete examination of their biosafety.
Author contributions
Q. M. contributed the greater part of the experimental work related to the fabrication, mechanism, characterization and antimicrobial activity of the prepared material. D. K. participated in the UPLC-DAD analysis of samples. G. F. conceived the idea of the work and obtained funding for the work. Both G. F. and P. K. supervised the work and provided expert opinion in the composition of this manuscript.Conflicts of interest
There are no conflicts to declare.Acknowledgements
This work has received funding from Narodowe Centrum Nauki (NCN), Poland (grant number UMO-2016/21/B/NZ9/01980). Q. M. is supported by a PhD fellowship from the NCN project number UMO-2016/23/B/NZ9/02677. G. F. is supported by the European Union's 7th Framework Programme for research, technological development, and demonstration under grant agreement No. 621321 and co-financed by funds allocated for education through project no. W26/7.PR/2015 [GA 3413/7.PR/2015/2] for the years 2015–2019.Notes and references
- P. Shakya, G. Marslin, K. Siram, L. Beerhues and G. Franklin, J. Pharm. Pharmacol., 2017 DOI:10.1111/jphp.12743.
- J. Barnes, L. A. Anderson and J. D. Phillipson, J. Pharm. Pharmacol., 2001, 53, 583–600 CrossRef PubMed.
- K. Zeliou, N. I. Kontaxis, E. Margianni, C. Petrou and F. N. Lamari, J. Chromatogr. Sci., 2017, 55, 805–812 Search PubMed.
- J. M. Greeson, B. Sanford and D. A. Monti, Psychopharmacology, 2001, 153, 402–414 CrossRef PubMed.
- K. M. Klemow, A. Bartlow, J. Crawford, N. Kocher, J. Shah and M. Ritsick, Medical Attributes of St. John's Wort (Hypericum perforatum), CRC Press/Taylor & Francis, 2011 Search PubMed.
- G. Marslin, K. Siram, Q. Maqbool, R. Selvakesavan, D. Kruszka, P. Kachlicki and G. Franklin, Materials, 2018, 11, 940 CrossRef PubMed.
- M. Casolaro, I. Casolaro, J. Akimoto, M. Ueda, M. Ueki and Y. Ito, Gels, 2018, 4, 42 CrossRef.
- R. D. Kale and P. Jagtap, Biogenic Synthesis of Silver Nanoparticles Using Citrus Limon Leaves and Its Structural Investigation, Advances in Health and Environment Safety, ed. N. A. Siddiqui, S. Tauseef and K. Bansal, Springer Nature Singapore Pte Ltd, Singapore, 2018, pp. 11–20 Search PubMed.
- G. Balabanian, M. Rose, N. Manning, D. Landman and J. Quale, Microb. Drug Resist., 2018 DOI:10.1089/mdr.2018.0065.
- Antimicrobial resistance, http://www.who.int/news-room/fact-sheets/detail/antimicrobial-resistance, (accessed 9 June 2018) Search PubMed.
- A. Aquino-Andrade, J. Merida-Vieyra, E. Arias de la Garza, P. Arzate-Barbosa and A. De Colsa Ranero, BMC Microbiol., 2018, 18, 38 CrossRef PubMed.
- V. Di Pilato, F. Arena, C. Tascini, A. Cannatelli, L. Henrici De Angelis, S. Fortunato, T. Giani, F. Menichetti and G. M. Rossolini, Antimicrob. Agents Chemother., 2016, 60, 5612–5615 CrossRef PubMed.
- F. Abbas, J. Iqbal, Q. Maqbool, T. Jan, M. O. Ullah, B. Nawaz, M. Nazar, M. S. H. Naqvi and I. Ahmad, AIP Adv., 2017, 7, 095205 CrossRef.
- S. Hussain, J. Joo, J. Kang, B. Kim, G. B. Braun, Z.-G. She, D. Kim, A. P. Mann, T. Mölder, T. Teesalu, S. Carnazza, S. Guglielmino, M. J. Sailor and E. Ruoslahti, Nat. Biomed. Eng., 2018, 2, 95–103 CrossRef PubMed.
- S. Kumari and A. K. Kondapi, Int. J. Biol. Macromol., 2018, 108, 401–407 CrossRef PubMed.
- B. Akkaya, B. Çakiroğlu and M. Özacar, ACS Sustainable Chem. Eng., 2018, 6, 3805–3814 CrossRef.
- A. T. Young, N. Cornwell and M. A. Daniele, Adv. Funct. Mater., 2018, 28, 1700239 CrossRef.
- Y. Yong, R. Su, X. Liu, W. Xu, Y. Zhang, R. Wang, P. Ouyang, J. Wu, J. Ge and Z. Liu, Biochem. Eng. J., 2018, 129, 26–32 CrossRef.
- Q. Maqbool, M. Nazar, S. Naz, T. Hussain, N. Jabeen, R. Kausar, S. Anwaar, F. Abbas and T. Jan, Int. J. Nanomed., 2016, 11, 5015–5025 CrossRef PubMed.
- S. Boutry, R. N. Muller and S. Laurent, in Iron Oxide Nanoparticles for Biomedical Applications, Elsevier, 2018, pp. 135–164 Search PubMed.
- S. Thota and D. C. Crans, Metal nanoparticles: synthesis and applications in pharmaceutical sciences, Wiley-VCH, Weinheim, 2018 Search PubMed.
- R. Kausar, M. A. Shaheen, Q. Maqbool, S. Naz, M. Nazar, F. Abbas, T. Hussain, U. Younas and M. F. Shams, AIP Adv., 2016, 6, 095203 CrossRef.
- S. Kummara, M. B. Patil and T. Uriah, Biomed. Pharmacother., 2016, 84, 10–21 CrossRef PubMed.
- D. Bose and S. Chatterjee, Indian J. Microbiol., 2015, 55, 163–167 CrossRef PubMed.
- S. Arokiyaraj, S. Vincent, M. Saravanan, Y. Lee, Y. K. Oh and K. H. Kim, Artif. Cells, Nanomed., Biotechnol., 2017, 45, 372–379 CrossRef PubMed.
- S. Mathew, A. Prakash and E. K. Radhakrishnan, Inorg. Nano-Met. Chem., 2017, 1–7 Search PubMed.
- M. E. Taghavizadeh Yazdi, J. Khara, H. R. Sadeghnia, S. Esmaeilzadeh Bahabadi and M. Darroudi, Res. Chem. Intermed., 2018, 44, 1325–1334 CrossRef.
- M. Khatami, I. Sharifi, M. A. L. Nobre, N. Zafarnia and M. R. Aflatoonian, Green Chem. Lett. Rev., 2018, 11, 125–134 CrossRef.
- M. A. Asghar, E. Zahir, S. M. Shahid, M. N. Khan, M. A. Asghar, J. Iqbal and G. Walker, LWT, 2018, 90, 98–107 CrossRef.
- S. Chinnappan, S. Kandasamy, S. Arumugam, K.-K. Seralathan, S. Thangaswamy and G. Muthusamy, Environ. Sci. Pollut. Res., 2018, 25, 963–969 CrossRef PubMed.
- Y. Shao, C. Wu, T. Wu, C. Yuan, S. Chen, T. Ding, X. Ye and Y. Hu, Int. J. Biol. Macromol., 2018, 111, 1281–1292 CrossRef PubMed.
- M. Baghayeri, B. Mahdavi, Z. Hosseinpor-Mohsen Abadi and S. Farhadi, Appl. Organomet. Chem., 2018, 32, e4057 CrossRef.
- B. Ajitha, Y. A. K. Reddy, H.-J. Jeon and C. W. Ahn, Adv. Powder Technol., 2018, 29, 86–93 CrossRef.
- M. Qasim, N. Udomluck, J. Chang, H. Park and K. Kim, Int. J. Nanomed., 2018, 13, 235–249 CrossRef PubMed.
- P. Lopez, H. H. Lara, S. M. Mullins, D. M. Black, H. M. Ramsower, M. M. Alvarez, T. L. Williams, X. Lopez-Lozano, H.-C. Weissker, A. P. García, I. L. Garzón, B. Demeler, J. L. Lopez-Ribot, M. J. Yacamán and R. L. Whetten, ACS Appl. Nano Mater., 2018, 1, 1595–1602 CrossRef.
- W. Cao, X. Wang, Q. Li, Z. Ye and X. Xing, Mater. Lett., 2018, 220, 104–107 CrossRef.
- M. Saravanan, S. K. Barik, D. MubarakAli, P. Prakash and A. Pugazhendhi, Microb. Pathog., 2018, 116, 221–226 CrossRef PubMed.
- M. Saravanan, S. Arokiyaraj, T. Lakshmi and A. Pugazhendhi, Microb. Pathog., 2018, 117, 68–72 CrossRef PubMed.
- M. D. Firouzjaei, A. A. Shamsabadi, M. Sharifian Gh., A. Rahimpour and M. Soroush, Adv. Mater. Interfaces, 2018, 1701365 CrossRef.
- L. Wang, W. Zhang, Y. Zhao and L. Cao, J. Phys. Chem. Solids, 2018, 120, 154–160 CrossRef.
- Q. Maqbool, RSC Adv., 2017, 7, 56575–56585 RSC.
- A. Piasecka, A. Sawikowska, P. Krajewski and P. Kachlicki, J. Mass Spectrom., 2015, 50, 513–532 CrossRef PubMed.
- M. Rafique, I. Sadaf, M. S. Rafique and M. B. Tahir, Artif. Cells, Nanomed., Biotechnol., 2017, 45, 1272–1291 CrossRef PubMed.
- S. Francis, S. Joseph, E. P. Koshy and B. Mathew, Artif. Cells, Nanomed., Biotechnol., 2018, 46, 795–804 CrossRef PubMed.
- T. Babita Devi and M. Ahmaruzzaman, in Advances in Waste Management, Springer Singapore, Singapore, 2019, pp. 525–534 Search PubMed.
- X.-Y. Li, Y.-C. Li, D.-G. Yu, Y.-Z. Liao and X. Wang, Int. J. Mol. Sci., 2013, 14, 21647–21659 CrossRef PubMed.
- C. Li, D.-G. Yu, G. R. Williams and Z.-H. Wang, PLoS One, 2014, 9, e92106 CrossRef PubMed.
- Z. Khan and M. Bagad, Int. J. Nanomed., 2015, 10, 3921 CrossRef PubMed.
- Y.-G. Yuan, Y.-H. Wang, H.-H. Xing and S. Gurunathan, Int. J. Nanomed., 2017, 12, 5819–5839 CrossRef PubMed.
- A. K. Mittal, S. Kumar and U. C. Banerjee, J. Colloid Interface Sci., 2014, 431, 194–199 CrossRef PubMed.
- R. M. Tilaki, A. Iraji zad and S. M. Mahdavi, Appl. Phys. A, 2006, 84, 215–219 CrossRef.
- O. Tusevski, J. Petreska Stanoeva, M. Stefova, D. Pavokovic and S. Gadzovska Simic, Acta Physiol. Plant., 2014, 36, 2555–2569 CrossRef.
- A. Porzel, M. A. Farag, J. Mülbradt and L. A. Wessjohann, Metabolomics, 2014, 10, 574–588 CrossRef.
- Y. Delgado-Beleño, C. E. Martinez-Nuñez, M. Cortez-Valadez, N. S. Flores-López and M. Flores-Acosta, Mater. Res. Bull., 2018, 99, 385–392 CrossRef.
- S. Anwaar, Q. Maqbool, N. Jabeen, M. Nazar, F. Abbas, B. Nawaz, T. Hussain and S. Z. Hussain, Front. Plant Sci., 2016, 7, 1330 Search PubMed.
- Y. N. Slavin, J. Asnis, U. O. Häfeli and H. Bach, J. Nanobiotechnology, 2017, 15, 65 CrossRef PubMed.
- D. Acharya, K. M. Singha, P. Pandey, B. Mohanta, J. Rajkumari and L. P. Singha, Sci. Rep., 2018, 8, 201 CrossRef PubMed.
- E. Saion and E. Gharibshahi, Journal of Fundamental Sciences, 2011, 7, 6–11 Search PubMed.
- L. Gharibshahi, E. Saion, E. Gharibshahi, A. Shaari and K. Matori, Materials, 2017, 10, 402 CrossRef PubMed.
- R. Vijayan, S. Joseph and B. Mathew, J. Nanobiotechnol.Artif. Cells, Nanomed., Biotechnol., 2018, 46, 861–871 Search PubMed.
- R. Mata, J. Reddy Nakkala and S. Rani Sadras, Mater. Sci. Eng., C, 2015, 51, 216–225 CrossRef PubMed.
- H. S. Toh, K. Jurkschat and R. G. Compton, Chem.–A Eur. J., 2015, 21, 2998–3004 CrossRef PubMed.
- N. T. K. Thanh, N. Maclean and S. Mahiddine, Chem. Rev., 2014, 114, 7610–7630 CrossRef PubMed.
- M.-L. Kung, M.-H. Tai, P.-Y. Lin, D.-C. Wu, W.-J. Wu, B.-W. Yeh, H.-S. Hung, C.-H. Kuo, Y.-W. Chen, S.-L. Hsieh and S. Hsieh, Colloids Surf., B, 2017, 155, 399–407 CrossRef PubMed.
- A. Panáček, L. Kvítek, M. Smékalová, R. Večeřová, M. Kolář, M. Röderová, F. Dyčka, M. Šebela, R. Prucek, O. Tomanec and R. Zbořil, Nat. Nanotechnol., 2018, 13, 65–71 CrossRef PubMed.
- R. Sonohara, N. Muramatsu, H. Ohshima and T. Kondo, Biophys. Chem., 1995, 55, 273–277 CrossRef PubMed.
- Y. Yang, J. Wang, Z. Xiu and P. J. J. Alvarez, Environ. Toxicol. Chem., 2013, 32, 1488–1494 Search PubMed.
- L. Wang, C. Hu and L. Shao, Int. J. Nanomed., 2017, 12, 1227–1249 CrossRef PubMed.
| This journal is © The Royal Society of Chemistry 2018 |