 Open Access Article
Corrosion kinetics and mechanisms of ZrC1−x ceramics in high temperature water vapor
Boxin Weiab,
Dong Wanga,
Yujin Wang *a,
Haibin Zhang
 *b,
Shuming Pengb,
Canhui Xub,
Guming Songa and
Yu Zhoua
aInstitute for Advanced Ceramics, School of Materials Science and Engineering, Harbin Institute of Technology, Heilongjiang, Harbin 150080, China. E-mail: wangyujin_hit@163.com
bInnovation Research Team for Advanced Ceramics, Institute of Nuclear Physics and Chemistry, China Academy of Engineering Physics, Sichuan, Mianyang, 621900, China. E-mail: hbzhang@caep.cn
First published on 17th May 2018
Abstract
The corrosion kinetics and mechanisms of ZrC1−x ceramics in water vapor between 800 and 1200 °C were investigated. The results showed that there was only cubic ZrO2 phase in the corrosion layer when corroded at 800 °C, while a scale layer consisted of a mixture of cubic and monoclinic ZrO2 phases when corroded at 1000 °C and 1200 °C. A series of crystallographic relationships at the ZrC/c-ZrO2 interface were detected. The c-ZrO2 formed near the interface retained some crystallographic orientations of the initial ZrC before corrosion, presenting an “inheritance in microstructure” between c-ZrO2 and ZrC. The corrosion behavior mainly followed a parabolic relationship. The incremental rate of weight gain increased with increased corrosion temperature and decreased C/Zr ratio and the carbon vacancy was passive to the decrease of corrosion rate. The main corrosion controlling mechanism changed from phase boundary reactions to surface diffusion and then to grain boundary diffusion with increased temperature.
1. Introduction
Zirconium carbide (ZrC) has attracted a lot of attention for ultrahigh temperature applications due to its high melting point (3530 °C), high hardness (20 GPa), good resistance to wear and corrosion, high thermal conductivity and phase stability, and inherent spectral selectivity.1–3 In the framework of the Generation-IV nuclear energy system, ZrC is considered as an accident tolerant fuel (ATF) particle coating or an inert matrix material because of its high thermal conductivity, low neutron absorption cross-section, and excellent resistance to attack by fission products.4,5 Non-stoichiometric ZrC1−x is stable over a wide compositional range, with a C/Zr molar ratio of 0.6 to 1.0, according to the Zr–C phase diagram.6 The properties of ZrC1−x ceramics are generally sensitive to their C/Zr atom ratio. In addition, carbon vacancies in ZrC1−x serve as sinks for interstitial atoms produced by irradiation, recombining and absorbing the interstitial atoms to self-heal damage and enhancing the tolerance of radiation damage,7,8 which yields non-stoichiometric as ZrC1−x a promising candidate in ATF.Because of this increased interest in ZrC, the performance of ZrC for nuclear energy applications has been studied, including irradiation effects on its properties,4,9–15 fission product compatibility,16–22 hydrothermal corrosion resistance,23 and corrosion resistance to molten salts.24 The corrosion behavior of ZrC in water vapor is a significant factor to be considered especially under accident conditions, such as those occurring in a loss of coolant accident (LOCA).25 However, there have been few studies on the corrosion behavior of ZrC in water vapor. An exhaustive understanding of the corrosion of ZrC in water vapor would be especially significant during accident scenarios, where undesirable high-temperature exposure to water vapor can occur. Data concerning the evaluation of ZrC corrosion in water vapor at high temperatures are very limited. The majority of related studies of ZrC have been performed on the oxidation of ZrC in air or oxygen. ZrC has been reported to be sensitive to rapid oxidation, which depends on temperature, partial pressure of oxidative and reductive gas species (from the reaction), porosity, C content, and impurities.26 Although oxidation has been found not have an effect on ZrC at room temperatures, at elevated temperatures (>∼870 K), complete spalling occurs due to oxidation, especially in high oxygen (O) partial pressure environments (∼130 kPa).27
In this study, ZrC1−x ceramics were fabricated by a two-step reactive sintering method and then corroded at 800–1200 °C, which was in the range of the expected nominal operating temperature in the presence of water vapor in a nuclear core following a LOCA.28 X-ray diffraction, scanning electron microscope and transmission electron microscopy were then used to investigate the corrosion kinetics and mechanisms of corroded ZrC1−x ceramics.
2. Experimental procedure
2.1 Preparation of ZrC1−x ceramics
Non-stoichiometric ZrC1−x ceramics were fabricated by a two-step reactive hot pressing according to our previous study.29 Commercially available powders of ZrC (particle size 1–5 μm, purity > 99.5 wt%, Changsha Weihui Materials Company, Changsha, China) and ZrH2 (particle size 2–10 μm, purity > 99.6 wt%, Jinzhou Haixin Metal Materials Company, Jinzhou, China) were used as starting powders. Powder mixtures in appropriate ratios were ball-milled in ethanol with ZrO2 milling media at a rotational speed of 300 rpm for 24 h. The slurry was then dried in a rotary evaporator and then sieved by a 200-mesh screen. The cold compacts were sintered by a two-step reactive sintering method, which included a low-temperature reaction process (1300 °C for 30 min) for complete ZrH2 decomposition and H2 outgassing and then a high-temperature densification by hot pressing. The compositional design, sintering parameters, relative densities, and grain sizes of ZrC1−x ceramics used in this work are shown in Table 1.| Identifications of samples | Compositions of raw materials (mol%) | C/Zr ratio | Sintering parameters | Grain sizes (μm) | Relative density (%) | ||
|---|---|---|---|---|---|---|---|
| ZrC | ZrH2 | The first stage | The second stage | ||||
| ZrC | 100 | 1.0 | — | 2200 °C/50 MPa/2 h | 14.6 ± 5.8 | 99.0 | |
| ZrC0.9 | 90 | 10 | 0.9 | 1300 °C/0.5 h | 2000 °C/30 MPa/1 h | 13.5 ± 4.7 | 98.3 |
| ZrC0.8 | 80 | 20 | 0.8 | 1300 °C/0.5 h | 2000 °C/30 MPa/1 h | 13.0 ± 4.4 | 98.0 |
2.2 Corrosion tests
Before corrosion, ZrC ceramic samples were cut into rectangular bars of 3 × 4 × 5 mm, and then ground using different grades of SiC abrasive papers. The corrosion process was monitored by thermogravimetric analysis coupled with differential thermal analysis (TG-DTA, 449C/6/G, Netzsch, Germany) and associated with mass spectrographic analysis (QMS, 403D Aëolos, Netzsch, Germany). For the experimental atmosphere, water vapor at 50% relative humidity, generated using an automated wet gas generator (Setaram Instrumentation, Caluire, France), was mixed with Ar carrier gas at a flow rate of 20 ml min−1. Sample weight changes after 0, 150, 300, 450, and 600 s periods at 800, 1000, and 1200 °C were continually recorded by the TGA microbalance. Corrosion in the TGA chamber ensured more reliable weight change results because of any oxide scale spallation remaining in the crucible and no excess weight gain from cooling of the furnace at the test time points. The heating rate was 50 °C min−1 and, at experiment's end, each sample was cooled quickly in Ar at a rate of 99 °C min−1. During corrosion tests, disturbances by the ambient environment were excluded using a sealed reaction chamber with positive pressure was in a positive pressure and sealed. Mass spectrographic analysis was performed to detect gases evolved when a sample was corroded at various temperatures. The gas was sampled into a flexible fused silica capillary inlet, set as the outlet of the furnace, and aspirated into the QMS ion source. After corrosion, the cross-section of residual ceramic embedded in the resin were polished with different grades of SiC abrasive papers.2.3 Surface analytical characterization
The phase constituents of the residual corrosion layer and spalled corrosion layer were identified by X-ray diffractometer (XRD; Empyrean, Panalytical Corp., Netherlands) using Cu-Kα radiation. Microstructural characterization of the corrosion layer was performed using a scanning electron microscope (SEM; FEI Quanta 200F, Netherlands) equipped with energy-dispersive X-ray spectrometer (EDS) for elemental analysis. Scanning transmission electron microscopy (STEM, FEI Talos F200x, The Netherlands) was used for more detailed analysis of microstructure.3. Results and discussion
3.1 Macro-morphology changes within ZrC1−x ceramics during corrosion
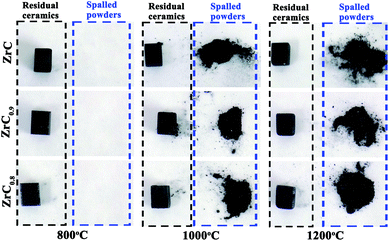
Examination of ZrC1−x ceramics corroded at different temperatures for 600 s showed that all corrosion surfaces of these ZrC1−x ceramics were black (Fig. 1). There was little spallation of oxide scales on samples corroded at 800 °C, while spalling and powdering occurred on samples corroded at and above 1000 °C. As temperature increased, the tendency for oxide layer spalling and powdering increased.3.2 Phase and composition of gas products after corrosion
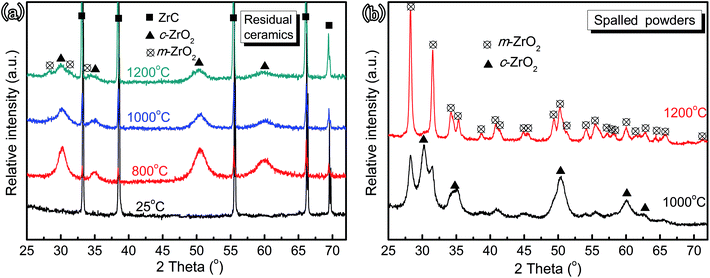 | ||
| Fig. 2 XRD patterns of the ZrC ceramics pristine and corroded at 800–1200 °C after 600 s. Residual ceramics (a) and spalled powders (b). | ||
From the results of XRD patterns, a schematic of the corrosion layer structure of ZrC ceramics after water vapor corrosion at different temperatures was created (Fig. 3). After corrosion at above 800 °C, there was only cubic ZrO2 phase in the immediate vicinity of ZrC1−x matrix. Slightly above this, there was a scale layer consisting of a mixture of cubic and monoclinic ZrO2 phases and the outermost layer was composed exclusively of monoclinic ZrO2 phase.
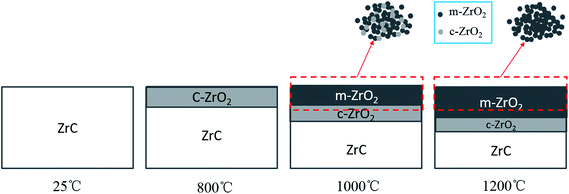 | ||
| Fig. 3 Schematic of the oxide layer structure of ZrC ceramics after corrosion in water vapor at different temperatures, according to XRD pattern results from residual ceramics and spalled powders. | ||
The outer oxide layer spalling from sample surfaces was explained by considering a thermal expansion-induced mismatch between the oxide layer and substrate. The molar volumes and thermal expansion of ZrC, c-ZrO2, m-ZrO2, and yttria-stabilized ZrO2 are presented in Table 2. Thermal expansion data of yttria-stabilized ZrO2 was assumed to be close to that of the stabilized ZrO2 polymorph in this study. The associated volume change among the phases and the thermal expansion mismatch between c-ZrO2 and m-ZrO2 were observed to be responsible for thermal stresses, which led to intergranular fracture. Kaczmarek and Puclin31 have studied the growth in ZrO2 crystal size, reporting a rapid increase in size of t-ZrO2 at 1223 K and m-ZrO2 at 1273 K. It was envisaged that this growth was a source of stress and cracking due to the growth of submicron c-ZrO2 grains along the grain boundary, which caused spalling and powdering of the outermost layer of oxide scale at temperatures at and above 1000 °C.
| Phase | Molar volume (Vm) (cm3 mol−1) | Thermal expansion (%) | ||
|---|---|---|---|---|
| 800 °C | 1000 °C | 1200 °C | ||
| ZrC | 15.3 | 0.3 | 0.5 | 0.6 |
| c-ZrO2 | 19.6 | 0.8 | 1.0 | 1.2 |
| m-ZrO2 | 21.0 | 0.6 | −0.2 to 0.8 | −0.1 to 0.1 |
| Yttria-stabilized ZrO2 | — | 0 | 0.1 | 0.3 |
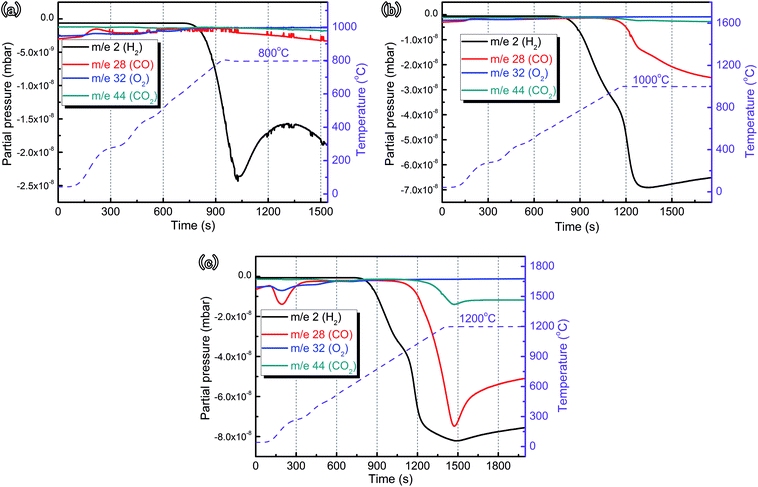 | ||
| Fig. 4 Mass spectrographics of ZrC ceramics in water vapor during heating from RT to (a) 800 °C, (b) 1000 °C and (c) 1200 °C, respectively. | ||
Ignoring the intermediate products, the chemical reactions for generating gases were as follows
| ZrC + 2H2O (g) → ZrO2 + 2H2 (g)↑ + C | (1) |
| ZrC + 3H2O (g) → ZrO2 + 3H2 (g)↑ + CO (g)↑ | (2) |
| ZrC + 4H2O (g) → ZrO2 + 4H2 (g)↑ + CO2 (g)↑ | (3) |
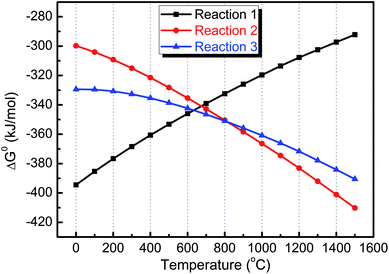
On the basis of available thermodynamic data from FactSage software,34 the changes in standard Gibbs free energy, ΔG0, for each reaction as a function of temperature were calculated, which showed that, in the investigated temperature range, all reactions were thermodynamically favorable (ΔG0 < 0, Fig. 5). The calculated results for ΔG0 indicated that the corrosion reaction (1) was more thermodynamically favorable than corrosion reactions (2) and (3) below ∼700 °C while these two reactions, releasing CO and CO2, become dominant with increased temperature, which was consistent with the MS profiles (Fig. 4).
Consequently, it was reasonably concluded that ZrC ceramics corrosion in water vapor began at ∼650 °C, as shown in reaction (1). The weight gain rate of the ceramics increased due to formation of ZrO2 and C, releasing amounts of H2. When the temperature increased to ∼900 °C, C started to react with water vapor, in the following reactions
| C + H2O (g) → H2 (g)↑ + CO (g)↑ | (4) |
| C + 2H2O (g) → 2H2 (g)↑ + CO2 (g)↑ | (5) |
Furthermore, XRD results demonstrated that there existed a phase transformation from c-ZrO2 to m-ZrO2 at >800 °C. Such a transformation was indicative of the role of C stabilizing the cubic ZrO2 phase. Bearing in mind the locations of these phases in the scale and C diffusion from the ZrC substrate toward the outer layer, it might be assumed that the reaction of C with water vapor took place also in the outer layers. The resulting evolution of CO and CO2 broke up the scale and made it porous. Hence, the presence of C was found to be essential for stabilization of c-ZrO2 phase. The stabilization of the cubic structure by carbon was limited to a temperature of ∼900 °C, and the transformation of cubic to monoclinic phase was a consequence of the decrease in C content.
3.3 Microstructure characterization after corrosion
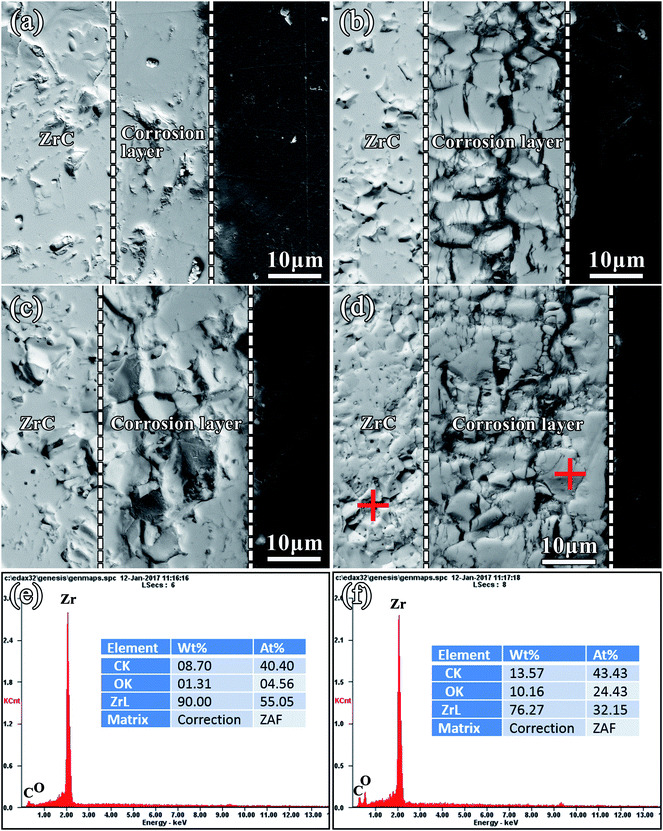
Fig. 6 showed the cross-section morphologies of the ZrC ceramics after steam corrosion tests at 800 °C for 150–600 s. The thickness of the corrosion layer increased from 18 to 34 μm with prolonging the corrosion time from 150 s to 600 s. In the initial stage of corrosion, a thick corrosion layer formed and no visible pores were found in the corrosion layer. With increased corrosion time, the ZrO2 layer on sample surfaces cracked. Associated with the XRD results (Fig. 2), the corrosion layer of ZrC corroded at 800 °C was identified as c-ZrO2.According to the macro-morphologies of ZrC1−x ceramics corroded at different temperatures for 600 s (Fig. 1), the outer oxide layers were found to spall and powder after corrosion at temperatures at and above 1000 °C. Cross-section SEM morphologies of unspalled corrosion layer and the residual layer after spallation of oxide scale of ZrC ceramics corroded at 1000 °C for 600 s are shown in Fig. 7(a) and (b), respectively. Fig. 7(a) revealed three layers, including unreacted bulk ZrC, a dense layer, and a relatively porous layer. From the cross-section, the outer layer of the corrosion layer consisted mainly of cracks, pores, and large grains, which was different from the transition layer adjacent to the ZrC substrate. The dense and porous layers exhibited a thickness of ∼18 and 66 μm, respectively. After the brittle and porous outer layer spalled from the sample surface, there only remained the relatively dense layer adjacent to the ZrC substrate. Combined with the XRD results (Fig. 2), the residual corrosion layer was identified as c-ZrO2, while the spalled layer consisted mainly of m-ZrO2 and a small amount of c-ZrO2.
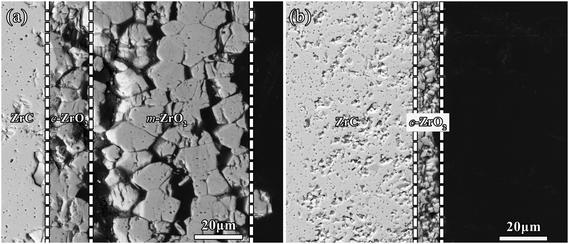 | ||
| Fig. 7 Cross-section morphologies of (a) the unspalled corrosion layer and (b) residual layer after spallation of oxide layer from ZrC ceramics corroded at 1000 °C for 600 s. | ||
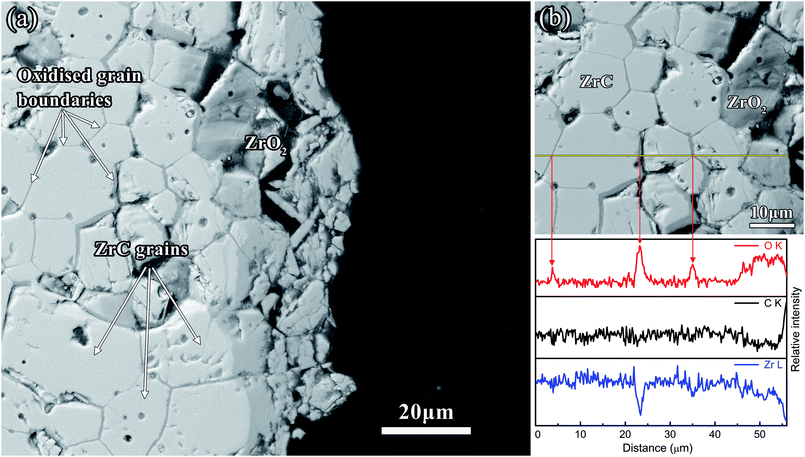
The cross-section SEM morphologies of the residual corrosion layer of ZrC corroded at 1200 °C for 600 s revealed that ZrC grains were readily visible closer to the corrosion layer (Fig. 8(a)). Line scans of Fig. 8(b) reveal the O content increased dramatically at ZrC grain boundaries, which showed extensive grain boundary oxidation in the ZrC substrate. These results suggested that the corrosion mechanism was predominated by grain boundary diffusion. This corrosion layer was also cracked and spalled from the sample, which was attributed to the stress exerted by the growth of m-ZrO2 as well as the pressure exerted by increased CO and CO2 gas production.
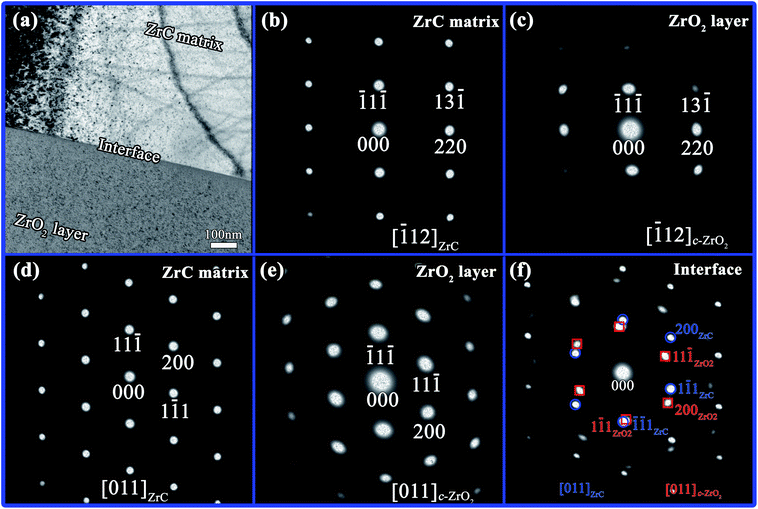
A TEM image of the ZrC matrix and corrosion layer corroded at 800 °C was shown in Fig. 9(a). The bulk sample is ZrC and the selected area electron diffraction (SAED) patterns from this region matched those of ZrC (Fig. 9(b) and (d) which indexed as [![[1 with combining macron]](https://www.rsc.org/images/entities/char_0031_0304.gif) 12] ZrC zone axis and [011] ZrC zone axis, respectively). However, the calculated lattice parameter of ZrC was 0.46811 nm which was smaller than the literature value of 0.46983 nm.35 The decrease in lattice size might have been due to carbon vacancies and oxygen content. SAED patterns of the immediate vicinity of ZrC substrate were shown in Fig. 9(c) and (e). The SAED pattern in Fig. 9(c) indexed as the c-ZrO2 [
12] ZrC zone axis and [011] ZrC zone axis, respectively). However, the calculated lattice parameter of ZrC was 0.46811 nm which was smaller than the literature value of 0.46983 nm.35 The decrease in lattice size might have been due to carbon vacancies and oxygen content. SAED patterns of the immediate vicinity of ZrC substrate were shown in Fig. 9(c) and (e). The SAED pattern in Fig. 9(c) indexed as the c-ZrO2 [![[1 with combining macron]](https://www.rsc.org/images/entities/char_0031_0304.gif) 12] zone axis as the ratio of the (220)/(
12] zone axis as the ratio of the (220)/(![[1 with combining macron]](https://www.rsc.org/images/entities/char_0031_0304.gif) 1
1![[1 with combining macron]](https://www.rsc.org/images/entities/char_0031_0304.gif) ) d-spacings (1.628) matched the cubic pattern (1.633), while the pattern in Fig. 9(e) indexed as the c-ZrO2 [011] zone axis as the ratio of the (200)/(11
) d-spacings (1.628) matched the cubic pattern (1.633), while the pattern in Fig. 9(e) indexed as the c-ZrO2 [011] zone axis as the ratio of the (200)/(11![[1 with combining macron]](https://www.rsc.org/images/entities/char_0031_0304.gif) ) d-spacings (1.167) matched the cubic pattern (1.155). The lattice parameters calculated from the SAED patterns in Fig. 9(c) and (e) were 0.49518 and 0.49674 nm, respectively, which was although ∼0.02 nm smaller than the cubic ZrO2 lattice parameter (0.51280 nm (ref. 36)). SAED patterns of the interface between the ZrC matrix and ZrO2 layer showed that the spots from the (1
) d-spacings (1.167) matched the cubic pattern (1.155). The lattice parameters calculated from the SAED patterns in Fig. 9(c) and (e) were 0.49518 and 0.49674 nm, respectively, which was although ∼0.02 nm smaller than the cubic ZrO2 lattice parameter (0.51280 nm (ref. 36)). SAED patterns of the interface between the ZrC matrix and ZrO2 layer showed that the spots from the (1![[1 with combining macron]](https://www.rsc.org/images/entities/char_0031_0304.gif) 1) lattice of c-ZrO2 were observed just inside the {
1) lattice of c-ZrO2 were observed just inside the {![[1 with combining macron]](https://www.rsc.org/images/entities/char_0031_0304.gif)
![[1 with combining macron]](https://www.rsc.org/images/entities/char_0031_0304.gif) 1} spots of ZrC in the SAED pattern, suggesting a crystallographic relationship, such as (
1} spots of ZrC in the SAED pattern, suggesting a crystallographic relationship, such as (![[1 with combining macron]](https://www.rsc.org/images/entities/char_0031_0304.gif)
![[1 with combining macron]](https://www.rsc.org/images/entities/char_0031_0304.gif) 1) ZrC being almost parallel to (1
1) ZrC being almost parallel to (1![[1 with combining macron]](https://www.rsc.org/images/entities/char_0031_0304.gif) 1) c-ZrO2 (Fig. 9(f)). Fig. 10 and 11 show a high-resolution TEM (HR-TEM) image and the corresponding fast Fourier transform (FFT) images of the interface between ZrC and c-ZrO2 obtained from zone axis [011] and [
1) c-ZrO2 (Fig. 9(f)). Fig. 10 and 11 show a high-resolution TEM (HR-TEM) image and the corresponding fast Fourier transform (FFT) images of the interface between ZrC and c-ZrO2 obtained from zone axis [011] and [![[1 with combining macron]](https://www.rsc.org/images/entities/char_0031_0304.gif) 12], respectively. According to Fig. 10(a), the ZrC region displayed the crystallographic (11
12], respectively. According to Fig. 10(a), the ZrC region displayed the crystallographic (11![[1 with combining macron]](https://www.rsc.org/images/entities/char_0031_0304.gif) ) plane, which had a FCC crystal structure and a d-spacing of 0.2702 nm, and the c-ZrO2 region indicated a crystallographic (
) plane, which had a FCC crystal structure and a d-spacing of 0.2702 nm, and the c-ZrO2 region indicated a crystallographic (![[1 with combining macron]](https://www.rsc.org/images/entities/char_0031_0304.gif) 1
1![[1 with combining macron]](https://www.rsc.org/images/entities/char_0031_0304.gif) ) plane, which had a FCC crystal structure and a d-spacing of 0.2868 nm. From these observations, combined with FFT images (Fig. 10(b)), a coherent orientation relationship was inferred in which (
) plane, which had a FCC crystal structure and a d-spacing of 0.2868 nm. From these observations, combined with FFT images (Fig. 10(b)), a coherent orientation relationship was inferred in which (![[1 with combining macron]](https://www.rsc.org/images/entities/char_0031_0304.gif)
![[1 with combining macron]](https://www.rsc.org/images/entities/char_0031_0304.gif) 1) ZrC was parallel to (1
1) ZrC was parallel to (1![[1 with combining macron]](https://www.rsc.org/images/entities/char_0031_0304.gif) 1) c-ZrO2, as [011] ZrC∥[011] c-ZrO2. The ZrC region shown in Fig. 11(a) displayed the crystallographic (
1) c-ZrO2, as [011] ZrC∥[011] c-ZrO2. The ZrC region shown in Fig. 11(a) displayed the crystallographic (![[1 with combining macron]](https://www.rsc.org/images/entities/char_0031_0304.gif) 1
1![[1 with combining macron]](https://www.rsc.org/images/entities/char_0031_0304.gif) ) plane, which had a d-spacing of 0.2704 nm, and the c-ZrO2 region displayed a crystallographic (
) plane, which had a d-spacing of 0.2704 nm, and the c-ZrO2 region displayed a crystallographic (![[1 with combining macron]](https://www.rsc.org/images/entities/char_0031_0304.gif) 1
1![[1 with combining macron]](https://www.rsc.org/images/entities/char_0031_0304.gif) ) plane, which had a d-spacing of 0.2859 nm. According to FFT images, a coherent orientation relationship was inferred in which (
) plane, which had a d-spacing of 0.2859 nm. According to FFT images, a coherent orientation relationship was inferred in which (![[1 with combining macron]](https://www.rsc.org/images/entities/char_0031_0304.gif) 1
1![[1 with combining macron]](https://www.rsc.org/images/entities/char_0031_0304.gif) ) ZrC∥(
) ZrC∥(![[1 with combining macron]](https://www.rsc.org/images/entities/char_0031_0304.gif) 1
1![[1 with combining macron]](https://www.rsc.org/images/entities/char_0031_0304.gif) ) c-ZrO2, (220) ZrC∥(220) c-ZrO2, and [
) c-ZrO2, (220) ZrC∥(220) c-ZrO2, and [![[1 with combining macron]](https://www.rsc.org/images/entities/char_0031_0304.gif) 12] ZrC∥[
12] ZrC∥[![[1 with combining macron]](https://www.rsc.org/images/entities/char_0031_0304.gif) 12] c-ZrO2 (Fig. 11(b)).
12] c-ZrO2 (Fig. 11(b)).
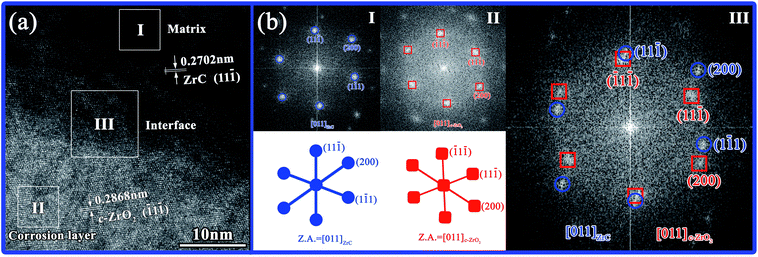 | ||
| Fig. 10 (a) HR-TEM image of the interface of matrix and corrosion layer and (b) corresponding FFT images obtained from zone axis [011]. | ||
 | ||
Fig. 11 (a) HR-TEM image of the interface of matrix and corrosion layer and (b) corresponding FFT images obtained from zone axis [![[1 with combining macron]](https://www.rsc.org/images/entities/char_0031_0304.gif) 12]. 12]. | ||
EDS line scanning of elemental C, Zr, and O across the interface of the matrix and corrosion layer over a distance of 660 nm showed that the O content in ZrO2 decreased dramatically from a distance of ∼15 nm from the interface (Fig. 12(a)). No obvious O concentration was detected in the ZrC lattice, which suggested that the dissolution of O in ZrC at the interface with corrosion at 800 °C was limited. According to the element map of the interface of matrix and corrosion layer as shown in Fig. 12(b)–(e), the ZrC/ZrO2 interface presented relatively straight. In addition, an amount of C was detected in the ZrO2 phase, together with a slight concentrated zone of C at the interface (Fig. 12(a) and (c)). The c-ZrO2 phase with compact microstructure was presumed to perform the role of a diffusion barrier for transport of O, such that the local O potential at the ZrC/ZrO2 interface became too low to oxidize the C component in ZrC, which eventually resulted in a local C-rich region along the interface.
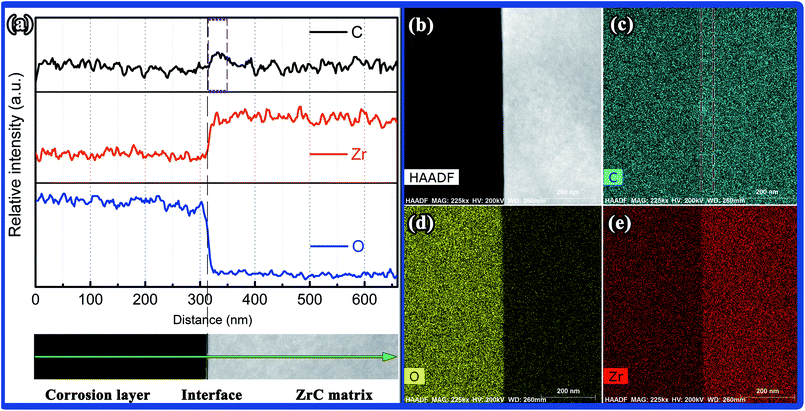 | ||
| Fig. 12 (a) STEM-EDS line scan and element map of the interface of matrix and corrosion layer, (b) HADDF image, (c–e) C, O, and Zr element maps, respectively. | ||
Based on observation of the matrix and corrosion layer by TEM and STEM-EDS, a series of crystallographic relationships were found at the ZrC/c-ZrO2 interface. The c-ZrO2 formed near the interface was considered to retain some crystallographic orientations of the initial ZrC during corrosion by steam, presenting an “inheritance in microstructure” between c-ZrO2 and ZrC. In addition, the corrosion layer near the interface contained a mixture of C and c-ZrO2, and the interface region was rich in carbon. No obvious evidence revealed the presence of ZrC1−xOx at the interface when corroded at 800 °C for 600 s.
3.4 Corrosion kinetics
The change in weight normalized as per surface area unit of ZrC ceramic samples as a function of time revealed a nonlinear relationship for all samples (Fig. 13). Clearly, the weight increased with prolonged corrosion time at all test temperatures. In the early stage, weight gain increased rapidly and then slowed significantly after corrosion for 300 s. In addition, weight gain also increased with increased corrosion temperature.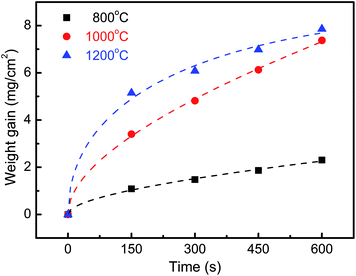 | ||
| Fig. 13 Change in mass per unit surface area of ZrC ceramic as a function of time for isothermal corrosion experiments. | ||
The weight gain per unit surface area of ZrC1−x ceramics with different C/Zr ratios as a function of corrosion time after corrosion tests at 800, 1000, and 1200 °C, clearly, showed a general trend of weight gain increase with prolonged corrosion time (Fig. 14). The rapid incremental weight gain within a short corrosion time generally corresponded with a reaction-controlled mechanism. However, with the prolongation of corrosion time, the process slowed down, which appeared to be controlled by a diffusion mechanism. Notably, the increment rate of weight gain increased with decreased C/Zr ratio. Thus, C vacancy was concluded to be passive to the decrease of corrosion rate.
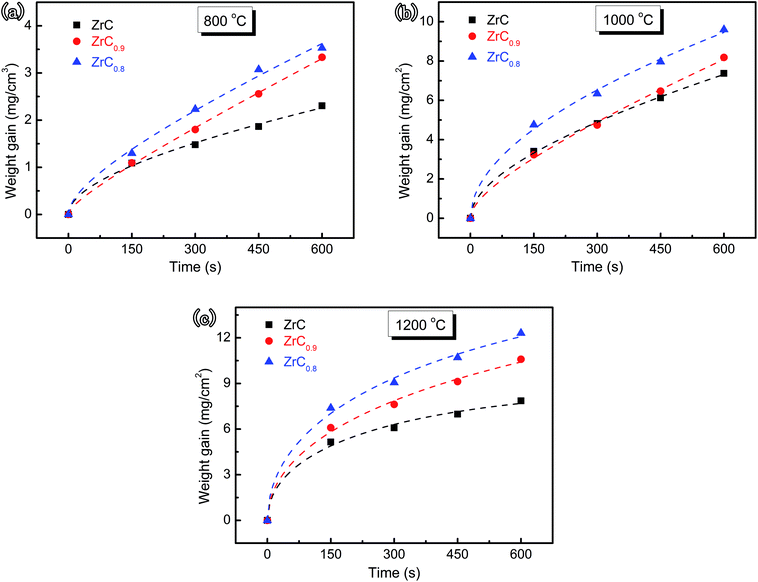 | ||
| Fig. 14 Change in mass per unit surface area of ZrC1−x ceramic as a function of time for isothermal corrosion experiments at (a) 800 °C, (b) 1000 °C, and (c) 1200 °C, respectively. | ||
The total change in mass per unit surface area as a function of time might have followed both a linear and parabolic relationship. In general, the rate equation for the corrosion kinetics of ZrC1−x ceramics against steam was given by the equation (6)
 | (6) |
| Ceramics | Temperature (°C) | klin (mg cm−2 s−1) | kpar (mg cm−2 s−1/2) |
|---|---|---|---|
| ZrC | 800 | 0.00066 | 0.07615 |
| 1000 | 0.00228 | 0.24303 | |
| 1200 | 0.00698 | 0.48492 | |
| ZrC0.9 | 800 | 0.00410 | 0.03669 |
| 1000 | 0.00654 | 0.16977 | |
| 1200 | 0.00405 | 0.52410 | |
| ZrC0.8 | 800 | 0.00287 | 0.07762 |
| 1000 | 0.00129 | 0.35457 | |
| 1200 | 0.00660 | 0.65476 |
The observed evidence of corrosion rates from 800 to 1200 °C along with the difference in the morphologies of the corrosion layers (Fig. 6–8) suggested that the corrosion mechanism changed with temperature. When corroded at 800 °C, a relatively dense corrosion layer formed, which inhibited steam diffusion. This dense layer was c-ZrO2, as revealed by TEM analysis (Fig. 9). At up to 1000 °C for corrosion, a porous oxide layer formed, resulting from the polymorphic transformation from c-ZrO2 outside layer to m-ZrO2, which readily allowed H2O diffusion through pores, voids, and cracks, as well as C (or COx species) diffusion out of the substrate. The increased corrosion rate was consistent with the porous microstructure of the corrosion layers (Fig. 7). In addition, samples corroded at 1200 °C for 600 s also showed an increased corrosion rate. From cross-section SEM morphologies (Fig. 8), it was observed that there was extensive grain boundary corrosion, which resulted from increased H2O diffusion through the corrosion scale. As the sample cooled, the phase transformation of ZrO2 created cracks in the corrosion layer.
3.5 Corrosion mechanism
The steam corrosion mechanisms of ZrC1−x ceramics corroded at different temperature can be described as follows (Fig. 15):(1) Corrosion of ZrC became measureable at ∼650 °C (Fig. 4 for mass spectrographic analysis of ZrC ceramics). Corrosion of ZrC resulted in the formation of a zirconia scale and H2 was released. It has been reported that, before the actual zirconia appears in the process of oxidation of ZrC in O2, ZrC goes through an intermediate oxycarbide phase with varying composition.37 The formation of these oxycarbide was quite rapid and the rate controlled by the phase boundary reaction.38 Phase boundary and diffusion reactions occurred simultaneously with the latter taking control with increased temperature.
(2) As the temperature increased to 800 °C, the oxycarbide phase transformed to cubic zirconia and liberated carbon, with the latter appearing as uniformly suspended inclusions within the zirconia layer. With the formation of this layer, diffusion of H2O (surface diffusion) assumed control of the reaction rate as the layer started to grow. This process at 800 °C appeared to be preferred zirconium corrosion, as no significant C was observed to be oxidized at this temperature, resulting in limited CO production (Fig. 4(a)).
(3) As the temperature increased, c-ZrO2 crystals started to grow and C started to be oxidized to CO and CO2 gases. It was deduced that the growth of zirconia crystals and pressure exerted by CO and CO2 gases started to slowly generate internal stress in the layer. As C is oxidized to CO and CO2, the exiting material might have left pores in the zirconia layer.
(4) Increasing the temperature to 1000 °C, the production of CO and CO2 gases increased with increased oxidation of C. As mentioned in Section 3.2.2, the presence of C was found to be essential for stabilization of the c-ZrO2 phase. Bearing in mind C diffusion toward the outer side, it might be assumed that the reaction of C with H2O took place also in the corrosion scale, which resulted in the formation of monoclinic zirconia within the outermost surface. CO and CO2 gases would have escaped through any pre-existing microcracks or interconnected pores in the layer. Hence, the scale consisted of mostly porous m-ZrO2 with some c-ZrO2 still stabilized by certain amounts of C.
(5) With further increased temperature, to 1200 °C, the stress exerted by m-ZrO2 growth at the grain boundaries and the pressure exerted by the increased CO and CO2 gases initiated cracks in an porous layer. The polymorphic transformation from m-ZrO2 to t-ZrO2 occurred in the outer layer, which readily allowed H2O diffusion through pores, voids, and cracks and C (or COx species) diffusion out of the sample. Combined with cross-section SEM observations of the residual corrosion layer of ZrC corroded at 1200 °C (Fig. 8), the rate was predominantly controlled by grain boundary diffusion.
(6) As the sample cooled, the phase transformation of ZrO2 from tetragonal to monoclinic created cracks in the corrosion layer. A rapid volume expansion associated with the phase transformation from t-ZrO2 to m-ZrO2 created stress and even cracks, resulting spalling and powdering of the outer oxide layers.
Based on the above analysis, the main controlling mechanisms changed from phase boundary reactions to surface diffusion and then to grain boundary diffusion as temperature increased.
4. Conclusions
The corrosion kinetics and mechanisms of ZrC1−x ceramics in water vapor between 800 and 1200 °C were investigated. After corrosion in water vapor at 800 °C for 600 s, only cubic ZrO2 phase was detected in the oxide layer. However, when corroded at above 800 °C, a scale layer was observed consisting of a mixture of cubic and monoclinic ZrO2 phases, and the intensities of the characteristic peaks of monoclinic ZrO2 increased with increased corrosion temperature. The thermal expansion mismatch between c-ZrO2 and m-ZrO2 caused spalling to powder of the outer oxide layers at temperatures at and above 1000 °C. The corrosion of ZrC ceramics in water vapor started at ∼650 °C. The weight gain rate of these ceramics increased mainly because of ZrO2 formation, with concurrent H2 release. With temperature at ∼900 °C, C started to react with water vapor to generate CO and CO2 gases. A series of crystallographic relationships was detected at ZrC/c-ZrO2 interface. During seam corrosion, c-ZrO2 formed near the interface retained some crystallographic orientations of the initial ZrC, presenting an “inheritance in microstructure” between c-ZrO2 and ZrC. The increment rate of weight gain increased with increased corrosion temperature and decreased C/Zr ratio, with the C vacancy apparently passive to the decrease of corrosion rate; this corrosion behavior mainly followed a parabolic relationship. The main controlling mechanisms changed from phase boundary reactions to surface diffusion and then to grain boundary diffusion as temperature increased.Conflicts of interest
There are no conflicts to declare.Acknowledgements
Financial supports from the National Natural Science Foundation of China (No. 51532006, 51172052 and 51621091) and Program for New Century Excellent Talents in University (No. NCET-13-0177) and the Fundamental Research Funds for the Central Universities (No. 13-0177) are greatly appreciated. Haibin Zhang is grateful to the foundation by the Recruitment Program of Global Youth Experts and the Youth Hundred Talents Project of Sichuan Province. This work is also supported by the National Natural Science Foundation of China (No. 91326102), the Science and Technology Development Foundation of China Academy of Engineering Physics (No. 2013A0301012), Science and Technology Innovation Research Foundation of Institute of Nuclear Physics and Chemistry, and the Dean Foundation of China Academy of Engineering Physics (No. 201402094).Notes and references
- M. M. Opeka, I. G. Talmy, E. J. Wuchina, J. A. Zaykoski and S. J. Causey, J. Eur. Ceram. Soc., 1999, 19, 2405–2414 CrossRef.
- K. Upadhya, J. M. Yang and W. P. Hoffman, Am. Ceram. Soc. Bull., 1997, 76, 51–56 Search PubMed.
- X.-H. Gao, Z.-M. Guo, Q.-F. Geng, P.-J. Ma, A.-Q. Wang and G. Liu, RSC Adv., 2016, 6, 63867–63873 RSC.
- D. Gosset, M. Dollé, D. Simeone, G. Baldinozzi and L. Thomé, J. Nucl. Mater., 2008, 373, 123–129 CrossRef.
- G. Vasudevamurthy, T. W. Knight, E. Roberts and T. M. Adams, J. Nucl. Mater., 2008, 374, 241–247 CrossRef.
- O. Barabash and Y. N. Koval, Crystal structure of metals and alloys, Naukova Dumka, Kiev, 1986, p. 209 Search PubMed.
- J. X. Xue, G. J. Zhang, L. P. Guo, H. B. Zhang, X. G. Wang, J. Zou, S. M. Peng and X. G. Long, J. Eur. Ceram. Soc., 2014, 34, 633–639 CrossRef.
- Y. Yang, W. Y. Lo, C. Dickerson and T. R. Allen, J. Nucl. Mater., 2014, 454, 130–135 CrossRef.
- K. D. Weaver, T. Marshall, T. Totemeier, J. Gan, et al., Gas-Cooled Fast Reactor (GFR) FY05 Annual Report, Idaho National Laboratory (INL), 2005, pp. 94–125 Search PubMed.
- J. Gan, M. K. Meyer, R. C. Birtcher and T. R. Allen, J. ASTM Int., 2005, 3, 1–7 Search PubMed.
- J. Gan, Y. Yang, C. Dickson and T. Allen, J. Nucl. Mater., 2009, 389, 317–325 CrossRef.
- D. Gosset, M. Dollé, D. Simeone, G. Baldinozzi and L. Thomé, Nucl. Instrum. Methods Phys. Res., Sect. B, 2008, 266, 2801–2805 CrossRef.
- Y. Huang, B. R. Maier and T. R. Allen, Nucl. Eng. Des., 2014, 277, 55–63 CrossRef.
- M. S. Koval'chenko and Y. I. Rogovoi, Inorg. Mater., 1973, 9, 321–322 Search PubMed.
- S. Pellegrino, L. Thomé, A. Debelle, S. Miro and P. Trocellier, Nucl. Instrum. Methods Phys. Res., Sect. B, 2014, 327, 103–107 CrossRef.
- K. Fukuda, K. Ikawa and K. Iwamoto, J. Nucl. Mater., 1979, 87, 367–374 CrossRef.
- K. Minato, T. Ogawa, K. Fukuda, H. Nabielek, H. Sekino, Y. Nozawa and I. Takahashi, J. Nucl. Mater., 1995, 224, 85–92 CrossRef.
- K. Minato, T. Ogawa, K. Fukuda, H. Sekino, I. Kitagawa and N. Mita, J. Nucl. Mater., 1997, 249, 142–149 CrossRef.
- K. Minato, T. Ogawa, K. Fukuda, H. Sekino, H. Miyanishi, S. Kado and I. Takahashi, J. Nucl. Mater., 1993, 202, 47–53 CrossRef.
- K. Minato, T. Ogawa, T. Koya, H. Sekino and T. Tomita, J. Nucl. Mater., 2000, 279, 181–188 CrossRef.
- T. Ogawa and K. Ikawa, High Temp. Sci., 1986, 22, 179 Search PubMed.
- W. A. Stark Jr, J. Nucl. Mater., 1978, 73, 169–179 CrossRef.
- M. Yoshimura and J. Senthilnathan, Carbon Nanomater., 2013, 395 Search PubMed.
- Y. Wang, Z.-F. Tang, Y. Fu, S.-R. Huang, S.-F. Zhao, P. Zhang, L.-D. Xie, X.-G. Wang and G.-J. Zhang, Ceram. Int., 2015, 41, 12996–13005 CrossRef.
- S. N. Rashkeev, M. V. Glazoff and A. Tokuhiro, J. Nucl. Mater., 2014, 444, 56–64 CrossRef.
- R. F. Voitovich and É. A. Pugach, Powder Metall. Met. Ceram., 1973, 12, 916–921 Search PubMed.
- Y. V. Miloserdin, K. V. Naboichenko, L. I. Laveikin and A. G. Bortsov, Strength Mater., 1972, 4, 302–305 CrossRef.
- W. G. Fahrenholtz, E. J. Wuchina, W. E. Lee and Y. Zhou, Ultra-high temperature ceramics: materials for extreme environment applications, John Wiley & Sons, 2014, pp. 391–415 Search PubMed.
- B. Wei, L. Chen, Y. Wang, H. Zhang, S. Peng, J. Ouyang, D. Wang and Y. Zhou, J. Eur. Ceram. Soc., 2018, 38, 411–419 CrossRef.
- G. A. Rama Rao and V. Venugopal, J. Alloys Compd., 1994, 206, 237–242 CrossRef.
- T. Puclin and W. A. Kaczmarek, Colloids Surf., A, 1997, 129, 365–375 CrossRef.
- V. V. Srdić, M. Winterer and H. Hahn, J. Am. Ceram. Soc., 2000, 83, 1853–1860 CrossRef.
- R. W. Harrison and W. E. Lee, J. Am. Ceram. Soc., 2015, 98, 2205–2213 CrossRef.
- FactSage 7.1, http://www.factsage.com Search PubMed.
- R. V. Sara, J. Am. Ceram. Soc., 1965, 48, 243–247 CrossRef.
- H. Tomaszewski and K. Godwod, J. Eur. Ceram. Soc., 1995, 15, 17–23 CrossRef.
- S. Shimada and T. Ishil, J. Am. Ceram. Soc., 1990, 73, 2804–2808 CrossRef.
- J. B. Quinn and I. K. Lloyd, J. Am. Ceram. Soc., 2000, 83, 3070–3076 CrossRef.
| This journal is © The Royal Society of Chemistry 2018 |

