 Open Access Article
Creative Commons Attribution 3.0 Unported Licence
Catalytic oxidation of CO over mesoporous copper-doped ceria catalysts via a facile CTAB-assisted synthesis
Hongjian Zhu,
Yingying Chen,
Zhongpeng Wang *,
Wei Liu* and
Liguo Wang
School of Resources and Environment, Key Laboratory of Water Resources and Environmental Engineering in Universities of Shandong, University of Jinan, 336 Nanxinzhuangxi Road, Jinan 250022, PR China. E-mail: chm_wangzp@ujn.edu.cn; stu_liuw@ujn.edu.cn
First published on 19th April 2018
Abstract
Nanosized copper-doped ceria CuCe catalysts with a large surface area and well-developed mesoporosity were synthesized by a surfactant-assisted co-precipitation method. The prepared catalysts with different Cu doping concentrations were characterized by XRD, DLS analysis, TEM, BET, Raman, H2-TPR and in situ DRIFTS techniques. The influence of Cu content on their catalytic performance for CO oxidation was also studied. The XRD results indicate that at a lower content, the Cu partially incorporates into the CeO2 lattice to form a CuCe solid solution, whereas a higher Cu doping causes the formation of bulk CuO. Copper doping favors an increase in the surface area of the CuCe catalysts and the formation of oxygen vacancies, thereby improving the redox properties. The CuCe samples exhibit higher catalytic performance compared to bare CeO2 and CuO catalysts. This is ascribed to the synergistic interaction between copper oxide and ceria. In particular, the Cu0.1Ce catalyst shows the highest catalytic performance (T50 = 59 °C), as well as excellent stability. The in situ DRIFTS results show that CO adsorbed on surface Cu+ (Cu+–CO species) can easily react with the active oxygen, while stronger adsorption of carbonate-like species causes catalyst deactivation during the reaction.
Introduction
Carbon monoxide (CO) is a toxic gaseous pollutant produced due to the incomplete combustion of carbon-containing fuels and in other application fields.1–3 The majority of CO emissions come from modern automobiles; in particular, up to 80% of CO is still emitted during the cold-start stage of a vehicle, namely the first 30 s of starting a car.4,5 The catalytic oxidation of CO with energy-efficient and environmentally friendly features has been the most widely used control technology to remediate CO emissions.6 Although noble metal catalysts offer excellent catalytic properties and desirable stability, their high cost and low abundance limit their application.Over the last few decades, ceria has been applied as an efficient three-way catalyst (TWC) for the elimination of toxic auto-exhaust gases due to its unique redox properties and high oxygen storage capacity (OCS) due to the facile redox cycle between the Ce3+ and Ce4+ in the structure.7–9 In particular, much attention has been paid to copper-doped ceria-based catalysts because of their unique activity for ambient CO oxidation.10–14 It should be noted that synergistic redox properties are produced upon the formation of CuO–CeO2 interfacial sites, which are considered to be the active sites for the CO oxidation reaction.15 Moreover, the substitution of Ce4+ cations with Cu2+ promotes the formation of structural defects and oxygen vacancies on the catalyst surface, which can favor the generation and mobility of charged species, such as electrons or oxygen anions in the solid catalyst.16 Thus, defect sites and oxygen vacancies are among the most desirable active species for oxidation catalysis.17,18 Nevertheless, some recent work has suggested that more surface oxygen vacancies may actually decrease the intrinsic activity of pure CeO2.16,19 On the other hand, the catalytic activities of nanocrystalline mesoporous materials are reported to be superior to those of their nonporous counterparts of the same material, due to their tunable porosity, surface oxygen vacancies, and large surface areas, which promote lattice oxygen mobility.20,21 For a gas–solid reaction, the large surface area and high mesoporosity of the catalyst favors easy access of the reactants to the active sites and diffusion of the products,22 thus improving the reaction efficiency on the material surface and resulting in enhanced catalytic performance. It should be noted that the preparation method could exert a basic influence on the structural properties of the catalysts, like surface area, component dispersion and strength of interaction, which in turn determine the redox properties and reactivity of the final catalysts.23 In order to synthesize a mesoporous material, the cationic surfactant CTAB is used as a soft template in the precipitation process, which may serve as a growth controller and an agglomeration inhibitor, by forming a covering film on the newly formed oxide crystal. In addition, the cationic surfactants could reduce the surface tension of the solution and readily be adsorbed onto the surface of the oxide through strong electrostatic interactions. Ma et al. have synthesized CuO/CeO2 bimetal oxides by using CTAB as the structure directing agent, which possesses a high surface area and disordered worm-like mesoporous structure.24 Wu et al. have reported that FeMnTiOx mixed oxide catalysts prepared by a CTAB-assisted process25,26 show obvious advantages in contrast to those prepared by other methods. In our previous work, we have also successfully synthesized mesoporous ceria-based catalysts doped with different transition metals using CTAB as a soft template.27
Though a number of Cu-doped ceria-based catalysts have already been reported, a comparative study is necessary to determine the dependence of the mesoporous structure on the amount of dopant and the influence of the dopant on the catalytic activity, which have not been well explored yet. In addition, a detailed investigation of the mechanism and catalytic application of doped ceria-based oxides for enhanced CO oxidation activity is still needed.
In this work, a set of CuCe catalysts with different molar ratios were prepared using a facile CTAB-assisted method. The Cu/Ce atomic ratio is optimized by using CO oxidation as a model reaction, to probe the reaction of more complex oxidation processes. Systematic techniques were employed to determine the structural/textural properties of the synthesized catalysts. Moreover, the critical factors for the superior catalytic activity were thoroughly investigated in order to correlate the catalytic behavior with the nature of the catalysts.
Experimental
Catalyst preparation
The catalysts were synthesized using the co-precipitation method applying CTAB as a soft template.27 Cu(NO3)2·3H2O (AR) and Ce(NO3)3·6H2O (AR) were added to deionized water at molar ratios of Cu/(Cu + Ce) = (0, 0.05, 0.1, 0.2, 0.3, and 1). Then, the salt solution was added to the CTAB solution (with a 1![[thin space (1/6-em)]](https://www.rsc.org/images/entities/char_2009.gif) :
:![[thin space (1/6-em)]](https://www.rsc.org/images/entities/char_2009.gif) 1 ratio of CTAB to metal ions) under vigorous stirring for 30 min, giving a clear homogeneous solution. Afterwards, a 1 M NaOH aqueous solution was added dropwise into the mixed solution under vigorous stirring until pH = 11. After stirring in the mother liquor for 3 h at 80 °C, the obtained precipitate was then filtered and repeatedly washed with sufficient deionized water and alcohol. Finally, the solid product was dried at 110 °C for 12 h in an electrical oven and then calcined at 550 °C for 6 h. The catalysts were denoted as CeO2, Cu0.05Ce, Cu0.1Ce, Cu0.2Ce, Cu0.3Ce, and CuO, respectively. For comparison, the reference CeO2 and Cu0.1Ce samples were synthesized by the co-precipitation method without CTAB (denoted as CeO2-co and Cu0.1Ce-co), and the mechanical mixture CuCe was prepared with a 1
1 ratio of CTAB to metal ions) under vigorous stirring for 30 min, giving a clear homogeneous solution. Afterwards, a 1 M NaOH aqueous solution was added dropwise into the mixed solution under vigorous stirring until pH = 11. After stirring in the mother liquor for 3 h at 80 °C, the obtained precipitate was then filtered and repeatedly washed with sufficient deionized water and alcohol. Finally, the solid product was dried at 110 °C for 12 h in an electrical oven and then calcined at 550 °C for 6 h. The catalysts were denoted as CeO2, Cu0.05Ce, Cu0.1Ce, Cu0.2Ce, Cu0.3Ce, and CuO, respectively. For comparison, the reference CeO2 and Cu0.1Ce samples were synthesized by the co-precipitation method without CTAB (denoted as CeO2-co and Cu0.1Ce-co), and the mechanical mixture CuCe was prepared with a 1![[thin space (1/6-em)]](https://www.rsc.org/images/entities/char_2009.gif) :
:![[thin space (1/6-em)]](https://www.rsc.org/images/entities/char_2009.gif) 9 ratio of CuO to CeO2 in order to compare it with the Cu0.1Ce sample (denoted as Cu0.1Ce-m).
9 ratio of CuO to CeO2 in order to compare it with the Cu0.1Ce sample (denoted as Cu0.1Ce-m).
Catalyst characterization
Powder XRD patterns were acquired using a BRUKER-AXS D8 Advance X-ray Diffractometer using Cu Kα radiation (λ = 0.15418 nm), operated at 40 kV and 40 mA. The diffractograms were recorded in the scanning angle (2θ) range of 10–80° with a step size of 0.02° and a scanning speed of 6° min−1.The average particle size and size distribution of the catalysts were observed by using the dynamic light scattering (DLS) technique on a Zetasizer Nano-S system (Malvern 3690 Instruments, UK). These measurements throw light on the stability and particle size distribution in fluids.
The morphology of the samples was analyzed using a transmission electron microscope (TEM, HT7700, Hitachi, Japan) operated at an acceleration voltage of 100 kV.
The textural properties of the as-prepared samples were determined from N2 adsorption–desorption isotherms at −196 °C on a Micrometrics ASAP 2020 analyzer. Prior to each measurement, the samples were degassed under vacuum at 300 °C for 5 h to remove the residual moisture. The specific surface areas were calculated using the Brunauer–Emmett–Teller (BET) method. The pore volumes and sizes were estimated from the pore size distribution curves determined from the adsorption isotherms using the Barrett–Joyner–Halenda (BJH) method.
The Raman spectra were recorded at room temperature (RT) on a LabRAM HR Evolution Raman spectrophotometer (Horiba Scientific, America) equipped with a TE-cooled charge coupled device (CCD) detector, using monochromatic radiation emitted by a laser (λ = 532 nm).
The temperature-programmed reduction with H2 (H2-TPR) experiments were performed in a fixed-bed quartz reactor with a thermal conductivity detector (TCD) to monitor the H2 consumption. Prior to the test, a 50 mg sample (40–80 mesh) was pretreated in situ at 500 °C for 30 min in a flow of He and cooled to RT. Finally, the reactor temperature was raised up to 900 °C at a heating rate of 10 °C min−1 in 5 vol% H2/N2 (50 mL min−1).
In situ DRIFTS analysis
The diffuse reflectance infrared Fourier transform spectra (DRIFTS) were recorded on a Nicolet iS50 spectrometer equipped with a temperature-controllable diffuse reflection chamber and a high sensitivity MCT detector. The catalysts were pretreated in a He stream at 500 °C for 30 min to clean the surface of the catalysts and then cooled down to RT. The background spectrum was taken at each temperature of interest. The sample wafers were exposed to a controlled stream of 2000 ppm CO or/and 5 vol% O2/He at a flow rate of 50 mL min−1. All the spectra were determined by accumulating 32 scans at a resolution of 4 cm−1 as a function of adsorption temperature.Evaluation of catalytic activity
The catalytic activity of CO oxidation was evaluated in a fixed-bed reactor (i.d = 6 mm) using 100 mg of catalyst (40–80 mesh). The catalysts were pretreated in He (100 mL min−1) at 500 °C for 30 min to remove surface-adsorbed species. After cooling down to RT, the inlet gas was switched to 2000 ppm CO/5 vol% O2 in He with a flow rate of 50 mL min−1 and then a TPO test was carried out in the temperature range from RT to 700 °C at a heating rate of 4 °C min−1. The outlet gas from the reactor was analyzed online by a gas chromatograph (GC) (SP-6890, Shandong Lunan Ruihong Chemical Instrument Corporation, China). The values for the conversion of CO in the CO oxidation process are defined as follows:| CO conversion (%) = (FinCO − FoutCO)/FinCO × 100%, |
Results and discussion
XRD and DLS analysis
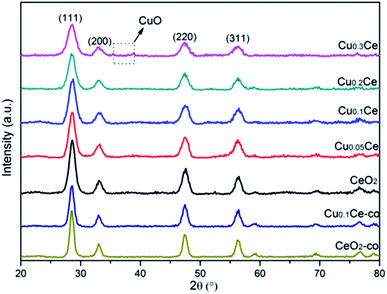
The XRD patterns of the samples with different molar ratios of Cu to Ce are shown in Fig. 1. It can be observed that all of the diffraction peaks of the samples are characteristic of the typical cubic fluorite phase of ceria (JCPDS no. 65-5923). Additionally, it can be noted that the diffraction peaks of these samples are slightly shifted to higher Bragg angles due to the incorporation of Cu ions into the ceria lattice. This interesting observation may lead to the decrease in the lattice parameter due to the smaller size of the copper ions (Table 1). Furthermore, the changes in the lattice parameter could be directly related to the concentration of oxygen vacancies and the strong interaction of CuO with the ceria phase.28 The changes in these distinct features, including peak shift and lattice parameter, compared to cubic CeO2 provide evidence of the formation of CuCe solid solutions with Cu doped into the CeO2 lattice, or/and the existence of some well dispersed CuO species on the surface of CeO2.29–31 However, at a higher Cu content (namely Cu0.3Ce), very weak reflections at 35.5° and 38.6° attributed to CuO can be detected, which indicates that when the copper doping is higher than the limit of Cux+ incorporated into the CeO2 lattice, the remainder could reside on the CeO2 surface in the form of bulk CuO crystallites. On the other hand, the diffraction peaks of these CuCe samples are broadened resulting from the crystallite nano dimension effect compared with CeO2,32 which is supported by the calculated crystallite size of the samples based on the 111 plane using the Debye–Scherrer equation (Table 1). The smaller crystallite size of the CuCe mixed oxides may be due to the introduction of Cux+ into the lattice of CeO2, which thereby suppresses the crystallite growth.33 For the comparison samples, the XRD peaks of the CeO2-co and Cu0.1Ce-co samples also match well the standard diffraction data for fluorite ceria; however, a larger crystallite size for these samples can be observed compared with the corresponding CeO2 and Cu0.1Ce samples, which illustrates that CTAB may serve as a growth controller of crystallites in the precipitation process.| Samples | 2θa (°) | ab (Å) | Xsc (nm) | SBETd (m2 g−1) | Vpe (cm3 g−1) | Dpf (nm) |
|---|---|---|---|---|---|---|
| a 111 crystal face.b Lattice parameter calculated from the characteristic XRD peaks of CeO2.c Mean crystallite size.d BET specific surface area.e Total pore volume.f Average pore diameter. | ||||||
| CeO2 | 28.464 | 5.4167 | 7.3 | 105 | 0.117 | 4.5 |
| Cu0.05Ce | 28.531 | 5.4076 | 6.6 | 113 | 0.177 | 6.3 |
| Cu0.1Ce | 28.564 | 5.4031 | 6.5 | 121 | 0.194 | 6.4 |
| Cu0.2Ce | 28.537 | 5.3990 | 6.2 | 126 | 0.194 | 6.1 |
| Cu0.3Ce | 28.556 | 5.3928 | 5.5 | 131 | 0.196 | 6.1 |
| CeO2-co | 28.490 | 5.4191 | 9.7 | 57 | 0.053 | 3.7 |
| Cu0.1Ce-co | 28.501 | 5.4078 | 8.4 | 68 | 0.085 | 4.9 |
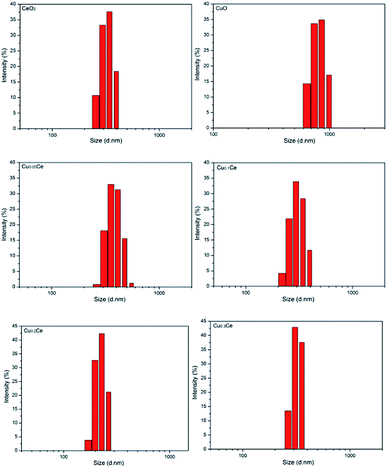
The particle sizes of the samples were also estimated by performing the DLS technique, which gives the particle size in the form of hydrodynamic radius, considering each particle as a separate sphere in Brownian motion. The size distribution is shown in Fig. 2 in the form of a histogram. The pure CuO sample has a larger particle size with an average value of about 811 nm (calculated based on Fig. 2). A narrow range of particle size distribution can be observed in CeO2, Cu0.05Ce, Cu0.1Ce, Cu0.2Ce and Cu0.3Ce, whose average particle sizes are 327 nm, 388 nm, 307 nm, 224 nm and 301 nm, respectively. These results reveal that an appropriate amount of copper doping can influence the particle growth and inhibit the agglomeration of particles due to the synergistic interaction between copper oxide and cerium oxide. Furthermore, these size values are also much larger than those calculated from the XRD results, which is because the crystallite size from XRD is the average grain size while the particle size from DLS analysis is the size of the particles composed of multiple grains.34
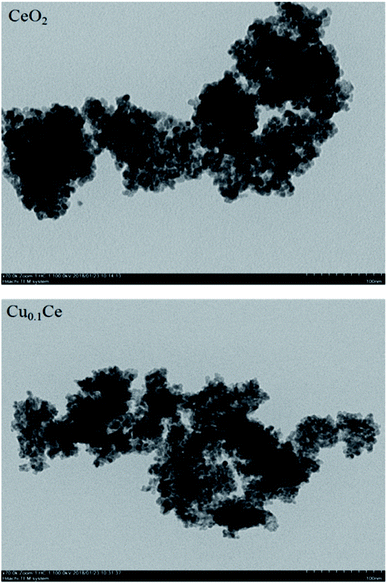
TEM was undertaken to further evaluate the morphological properties of the synthesized representative catalysts, as shown in Fig. 3. A disordered wormhole-like mesostructure, aggregated by metal oxide nanoparticles with a diameter of several nanometers, can be directly observed for the samples. The accessible pores are connected randomly, lacking discernible long-range order in the pore arrangement among the nanoparticles. Furthermore, the results also confirmed that the particle size from the DLS analysis is the size of the particles composed of multiple grains.
Textural characteristics
The nitrogen adsorption/desorption isotherms of the CuCe catalysts are plotted in Fig. 4(a). All the samples present classical type IV isotherms with well-defined H2-type hysteresis loops, confirming the formation of mesoporous materials according to IUPAC classification. The H2 type of hysteresis loop reflects a complex pore structure, including typical inkpot-shaped pores, tubular holes with an asymmetrical distribution of pore diameter and the mesopores of closely packed spherical particle, etc. As can be seen in Fig. 4(b), the mesopores in the Ce-based samples are very similar and uniform, and the most probable pore diameter of the catalyst is in the range of 4–6 nm. This result is consistent with the TEM result.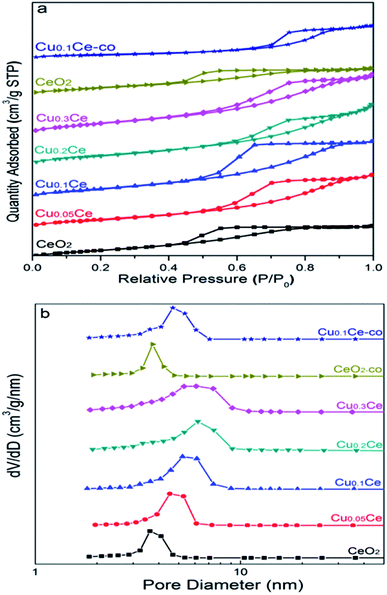 | ||
| Fig. 4 N2 sorption isotherms (a) and pore size distributions (b) of the CuCe catalysts with different CuO contents. | ||
The corresponding results of textural properties are summarized in Table 1. It can be seen that the specific surface area of pure CeO2 is 105 m2 g−1, and the BET surface areas of the catalysts increase from 105 to 131 m2 g−1 with increasing Cu content, indicating that the introduction of Cu ions into the ceria lattice diminished the crystallite size, resulting in an increase in the surface area, which is in accordance with the XRD results.35 Moreover, as the Cu content increased, the pore size and pore volume of the samples remained stable at around 0.194 cm3 g−1 and 6 nm, respectively. For comparison, the surface area of CeO2-co and Cu0.1Ce-co is only 57 m2 g−1 and 69 m2 g−1, respectively, which is smaller than that of CeO2 (105 m2 g−1) and Cu0.1Ce prepared with CTAB (121 m2 g−1). Moreover, the samples prepared without CTAB also possess a smaller pore size and pore volume compared with the corresponding sample using CTAB. These results indicate that the use of CTAB in the precipitation process favors the synthesis of mesoporous materials with a large surface area. The large surface area and high mesoporosity of the catalyst allows easy access of reactants to the active sites and diffusion of products from the catalyst surface.
Raman spectroscopy
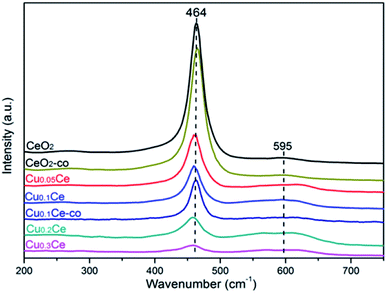
Raman spectroscopy allows us to probe the presence of oxygen defects in ceria-based materials. It can be seen from Fig. 5 that all samples exhibit a prominent and symmetrical band at 464 cm−1 corresponding to the triply degenerated F2g Raman active mode of fluorite-type structure CeO2 and a weak band at 595 cm−1 attributed to the presence of Frenkel-type anion defects in the ceria lattice.16,36 In the latter case, an oxygen ion is displaced from its lattice position to an interstitial position, thus leading to a vacancy at its initial position and a defect at the interstitial site. In addition, the ratio between the areas of the peaks at 595 cm−1 and 464 cm−1 (noted as A595/A464) is the most appropriate way to compare the concentration of oxygen vacancies in the solid solutions: the higher the value of A595/A464, the higher the amount of oxygen vacancies.33,36 The calculated results are summarized in Table 2. The A595/A464 values follow the order: Cu0.3Ce > Cu0.2Ce > Cu0.1Ce > Cu0.05Ce > CeO2, and the results suggest that the incorporation of Cu ions into the lattice of CeO2 favors the formation of additional oxygen vacancies. Obviously, the relative concentration of oxygen vacancies of Cu0.1Ce-co is lower than that of Cu0.1Ce. On the other hand, with increasing Cu content, the F2g band of CeO2 becomes weaker and shifts distinctly toward lower wavenumbers, and the red shift of this band is connected with the lattice shrinkage due to the incorporation of Cu ions into the CeO2 lattice. These results are in agreement with the analysis results of XRD.| Samples | A595/A464a | H2 consumptionb (mmol g−1) | H2/Cu ratioc | T50d (°C) | T90d (°C) |
|---|---|---|---|---|---|
| a The area ratio of the Raman bands at 595 and 464 cm−1.b The total H2 consumption of the reduction peaks from RT to 350 °C.c The ratio of actual amount of H2 consumption to theoretical amount of H2 consumption.d Temperature for 50% and 90% conversion for CO oxidation. | |||||
| CeO2 | 0.11 | — | — | 315 | 411 |
| Cu0.05Ce | 0.15 | 0.76 | 1.216 | 101 | 154 |
| Cu0.1Ce | 0.31 | 1.58 | 1.264 | 59 | 92 |
| Cu0.2Ce | 0.66 | 2.41 | 0.964 | 70 | 101 |
| Cu0.3Ce | 1.07 | 3.60 | 0.960 | 70 | 101 |
| CeO2-co | 0.08 | — | — | 351 | 437 |
| Cu0.1Ce-co | 0.22 | 1.22 | 0.976 | 76 | 108 |
H2-TPR
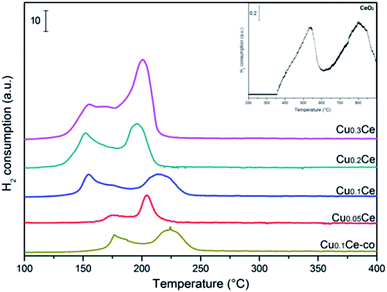
The redox properties of the catalysts were characterized by H2-TPR. As can be seen in Fig. 6, pure CeO2 exhibits two reduction peaks due to the surface and bulk reduction, which are centred at 500 °C and 800 °C, respectively. The difference in these two successive reduction temperatures is due to the different binding energy of oxygen to cerium cations in the lattice.37 A well-defined two-step reduction profile (designated as α and β) is observed for all CuCe catalysts in the range of 100–250 °C, which indicates that there are at least two copper species in the catalysts. It has been reported that the α and β peaks can be ascribed to the reduction of finely dispersed CuO species strongly interacting with the CeO2 and the reduction of larger CuO particles weakly associated with CeO2, respectively.12,24 The α and β peaks coexist in all TPR profiles even at 5 mol% CuO content, and the area of peak β is always larger than that of peak α. With increasing CuO content from 5 to 30 mol%, the intensities of the α and β peaks increase. When the CuO content increases up to 30 mol%, the intensity of the β peak continually increases and the α and β peaks coalesce and overlap to some extent, which could be due to some larger CuO particles occurring, corresponding to the fact that a separate CuO phase is obviously detected by XRD over the Cu0.3Ce sample. It can be clearly seen that with an increase in Cu amount from 5 to 10 mol%, peak α moves from 175 °C to 154 °C. It should be noted that the reduction peak temperature of Cu0.1Ce is much lower than that of Cu0.1Ce-co, which suggests that the redox property of Cu0.1Ce with more oxygen vacancies is stronger than that of Cu0.1Ce-co. On a further increase in the Cu amount, it stabilizes at around 154 °C. Furthermore, no reduction peak can be seen for CeO2 at a temperature less than 400 °C. As is well known, the reduction profile of pure CuO is characterized by a single peak at about 300 °C. The H2-TPR peak temperature of the CuCe catalysts is much lower than that of pure CuO and CeO2. This finding suggests that a strong synergistic interaction between ceria and copper oxide takes place, namely, the Ce–O bond is weakened by the substitution of ceria and Cu–O–Ce structures are formed on the surface, leading to an easier reduction of both CeO2 and CuO.Quantitative analysis of the H2 consumption from RT to 350 °C was carried out (Table 2) and the results show that the H2-consumption progressively increases with the Cu-content, thus confirming the beneficial role of copper towards the reducibility of ceria-based catalysts. On the other hand, for Cu0.05Ce and Cu0.1Ce samples, the ratio of actual amount of H2 consumption to the theoretical amount of H2 consumption is larger than 1, suggesting that the reduction peak areas come from the reduction of CuO, but also CeO2 takes part in the reaction in the range of lower temperature due to the strong synergistic interaction. However, the H2/Cu ratio is less than 1 for the Cu0.2Ce and Cu0.3Ce, which implies that more large CuO particles weakly interact with CeO2, confirming that the reduction of surface oxygen species could be hindered due to the formation of excess CuO crystallites with higher Cu-content, which reduces the interaction of Cu–O–Ce structures. In general, the high value of H2 consumption implies that the samples contain more reducible oxygen species. As discussed in the XRD section, the oxygen vacancies would be generated once the Cu ions are incorporated into the CeO2 lattice, which is also confirmed by Raman analyses. The oxygen vacancies would result in charge imbalance and lattice distortion of CeO2, thereby creating more active sites on the surface that adsorb more oxygen molecules. The adsorbed oxygen molecules are very reactive oxygen species and are readily reduced at relatively low temperatures.
Catalytic performance
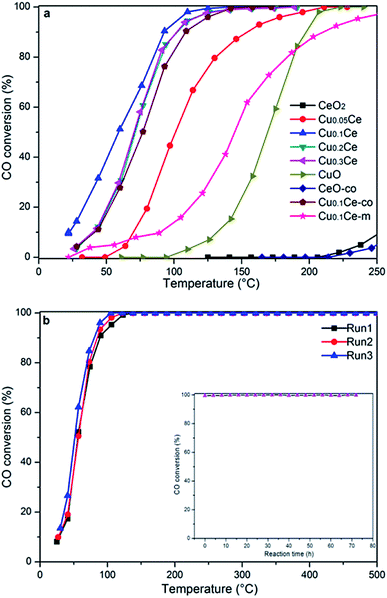
The activity results corresponding to various samples are represented in Fig. 7(a). For comparison, CO oxidation was also performed with CeO2-co, Cu0.1Ce-co and Cu0.1Ce-m samples. It is obvious that pure CeO2 exhibits almost no activity in this temperature window and CuO shows modest catalytic activity. The CeO2-co sample exhibits lower catalytic performance compared with the CeO2 prepared with CTAB as expected. The increased catalytic performance of the CeO2 sample can be ascribed to the mesostructures and high surface area. In contrast, when the content of Cu reaches 5 mol%, its catalytic activity is improved to a certain extent, suggesting that appropriate doping of CuO into CeO2 contributes to an increase in catalytic performance for CO. The CO conversions gradually increase with an increase in the content of Cu until 10 mol% (Cu0.1Ce). The mechanical mixture Cu0.1Ce-m also exhibits enhanced catalytic performance compared with single CeO2 and CuO, which confirms the synergistic interaction between CuO and CeO2. For comparison purposes, we have calculated the temperature at which 50% conversion occurs, denoted as T50. The Cu0.1Ce catalyst exhibits the best catalytic activity and the T50 is 59 °C, which is also superior to that of the Cu0.1Ce-co sample. With further increasing CuO content, the catalytic performance of the samples decreases slightly. The catalytic activity of CO oxidation in terms of T50 is in the order: Cu0.1Ce > Cu0.2Ce = Cu0.3Ce > Cu0.05Ce > CuO > CeO2.The catalytic oxidation of CO on an active metal supported ceria catalyst is proposed to involve reductive and oxidative steps, which was interpreted by the classical Mars-van Krevelen and Langmuir–Hinshelwood mechanisms. In the former mechanism, the adsorbed CO (COad) is oxidized by lattice oxygen (OL). In the latter case, the COad is oxidized mainly by adsorbed oxygen (Oad), which is the rate-determining process. Therefore, the mobility and/or reducibility of the active oxygen (Oad and/or OL) is of crucial importance for the CO oxidation reaction. Following the previous characterizations, some reasonable analyses under the current conditions are concluded to further illustrate factors that affect the catalytic activity. The results of XRD suggest that the incorporation of Cu ions with smaller ionic radii into the ceria lattice results in defective solid solutions. The synergistic interaction between CuO and CeO2 has a positive effect on the generation of surface oxygen vacancies, which has also been confirmed by the Raman spectroscopy study. Gaseous oxygen in the feed gases could be absorbed at surface oxygen vacancies and sequentially activated as active oxygen (O2−) by activation of the catalysts. In addition, the generated oxygen vacancies acting as active sites could also improve the mobility of oxygen species from the bulk to the surface, which is well shown by the results of the H2-TPR experiment. The large surface area and high mesoporosity of the doped catalyst allows easy access of reactants (CO) to the active sites and diffusion of products (CO2) from the catalyst surface. Thus, the Cu-doped ceria-based catalysts exhibit better catalytic performance than pure oxides.
According to the results of structure and Raman characterization, the BET surface areas and oxygen vacancies of the doped catalysts increase with the Cu content, but the catalytic activity of Cu0.2Ce and Cu0.3Ce is slightly decreased compared with Cu0.1Ce. In this sense, the surface area is not the main factor influencing the catalytic activity. Furthermore, more surface oxygen vacancies may even decrease the intrinsic activity of the catalysts.16 These results indicate that the role of ceria surface oxygen vacancies in CO oxidation may be more complex than ever expected. Given that the H2/Cu ratio of Cu0.1Ce (1.264) is larger than 1, the interface between CuO and CeO2 has a stronger synergistic interaction for Cu0.1Ce, and the interaction decreases with increasing Cu content. It should be noted that the active sites of the Cu-doped ceria for CO oxidation are located in the interface between CuO and the CeO2 substrate.38 When the doping amount of CuO increases, some bulk CuO clusters could appear and cover the surface active sites,39 because a separate CuO phase is obviously detected by XRD over the Cu0.3Ce sample.
For practical application purposes, catalytic stability is an important feature for materials used in industrial applications. Therefore, CO oxidation cycling tests have been performed over the Cu0.1Ce catalyst as a function of temperature. An additional long-term stability test in normal feed gas was conducted at constant temperature. As shown in Fig. 7(b), the Cu0.1Ce catalyst exhibited high stability, and no deactivation occurred for a time-on-stream of 72 h at 120 °C (inset to Fig. 7(b)).
In situ DRIFTS analysis
In order to investigate the influencing factors of the CO oxidation activity and explore the reaction mechanism further, the in situ DRIFTS technique was carried out over the CuCe catalysts and the results are shown in Fig. 8.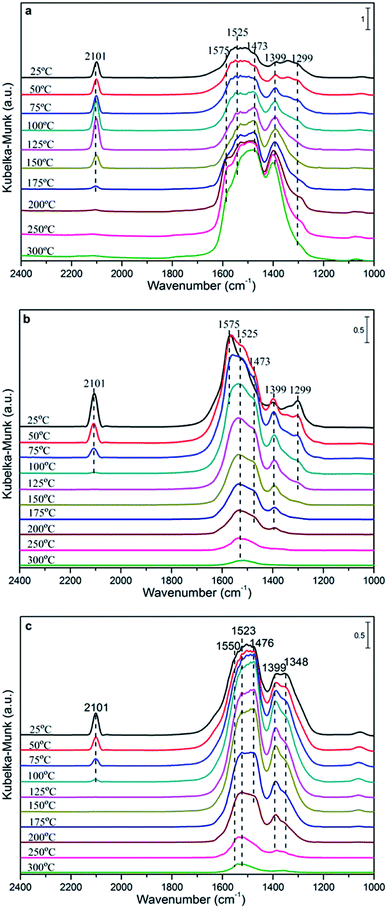 | ||
| Fig. 8 DRIFTS spectra recorded after exposure to CO on the Cu0.1Ce sample (a) and CO + O2 on the Cu0.1Ce (b) and Cu0.2Ce (c) samples at different temperatures. | ||
Fig. 8(a) shows the spectra of CO adsorption over Cu0.1Ce with the purpose of probing the surface species. CO can absorb on either Cu surfaces to form adsorbed CO or on CeO2 surfaces to form various carbonate, bicarbonate and formate species in the 1700–1000 cm−1 range.13,16,32,40 It is widely reported that the bands at 1575, 1525 and 1299 cm−1 are ascribed to bidentate carbonate species. The bands attributed to bridged carbonate and monodentate carbonates appear at 1399 and 1473 cm−1. Furthermore, the intensity of the bands attributed to these carbonates enhances on further raising the temperature. In addition, bridged formate (1356 cm−1) is observed at low temperature and disappears when the temperature is increased up to 100 °C. In principle, the CO molecule is an electron-donor probe during adsorption, so the active interface oxygen species may capture the CO molecule, forming interface carbonate species. The peak at about 2101 cm−1 in the spectra should be attributed to the vibration of Cu+–CO, which indicates the presence of some Cu+ species in the sample. Generally, at ambient temperature, the adsorption of Cu+–CO is the most stable.41,42 Meanwhile, the intensity of the band for Cu+–CO shows a maximum at 125 °C and a disappearance at 200 °C, which may be due to the interaction of CO with Cu2+ and Cu+ ions with unsaturated coordination leading to their reduction, i.e., from Cu2+ to Cu+ to Cu0.
The DRIFTS spectra of CO and O2 co-adsorption over Cu0.1Ce are shown in Fig. 8(b). It can be seen that the intensity of Cu+–CO at ambient temperature is slightly weaker than that of only CO adsorption, which could be due to the preferential adsorption of O2 molecules on the surface of the catalyst to form O2− species in the oxygen vacancies, restraining the adsorption of CO.42 The Cu+–CO species weakens gradually with the increase in temperature and disappears completely at 100 °C, which suggests that gaseous CO may be completely oxidized to CO2 by excess O2. This is confirmed by the catalytic activity of CO oxidation. The bands that appeared between 1200 and 1700 cm−1 increase gradually and reach the maximum at 50 °C, then weaken gradually when the temperature exceeds 100 °C. This may be due to the carbonate-like species first being produced through the conversion of CO2 or other processes and then desorbing from the catalyst surface at higher temperatures. On the other hand, the CO conversion tend to grow slowly when the reaction temperature exceed 100 °C. It is reasonable that the carbonate species would limit the reaction rate and lead to low activity due to the produced carbonate-like species blocking some of the active sites, resulting in surface like-poisoning.13,43
For comparison purposes, CO and O2 co-adsorption in situ DRIFTS spectra of the Cu0.2Ce sample were recorded so as to explore the mechanism and better understand the difference in catalytic activity for the CO oxidation reaction. It can be seen from Fig. 8(c) that the change of the adsorbed species with temperature is similar to that of Cu0.1Ce. It should be noted that the band of Cu+–CO shows a lower intensity at RT and obviously exists at 100 °C compared to Cu0.1Ce. The respective intensities of these Cu+-carbonyls provide a measure to evaluate the potential of CO oxidation for each catalyst.44 That is to say, the intensity of the Cu+-carbonyl band may be proportional to the CO oxidation activity. The bands attributed to these carbonates and carboxylates with higher intensity reach the maximum at 100 °C, and decrease gradually with increasing temperature after 125 °C for Cu0.2Ce. Two new bands ascribed to bridged formate and carboxylates are observed at 1348 and 1550 cm−1. These observations indicate that an increase in Cu doping may improve the adsorption capacity for carbonaceous species, which could result from its larger surface area and more oxygen vacancies. In turn, the carbon deposition phenomenon could easily cover the catalyst surface, blocking some active sites and further causing catalyst deactivation during the reaction.
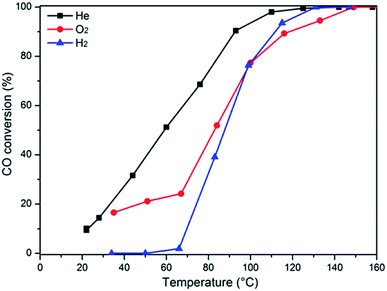
In order to further determine the influence of the pretreatment conditions on the catalytic activity, the representative sample Cu0.1Ce was pretreated in different atmospheres (He, O2 and H2) before the CO oxidation reaction, as shown in Fig. 9. The observed T50 temperatures of the catalysts pretreated with He, O2, and H2 are 59 °C, 82 °C and 87 °C, respectively. Taking into account the H2-TPR results, in an oxidizing or reducing atmosphere, Cux+ species could be oxidized to Cu2+ or reduced to Cu0. Thus, it can be concluded that the presence of more Cu+species could result in higher activity, which confirmed the DRIFTS results. Furthermore, this consequence is in accordance with the literature,45 which reports partially reduced copper (Cu+) as the most active species.
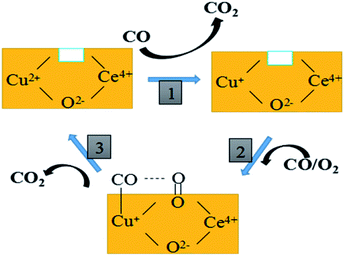
Based on the above discussion and previous reports, the proposed cyclic schematic representation of CO oxidation involves a combination of steps as shown in Fig. 10. In the first step, the surface Cu–O–Ce species could be reduced by CO in the mixed atmosphere to form more Cu+ species and surface synergetic oxygen vacancies. This process of electron transfer activates the lattice oxygen nearby the copper species. In the second step, the exposed Cu+ and oxygen vacancy could provide an adsorption site for CO and an activation site for O2, respectively. Finally, this kind of active oxygen (O2−) can easily react with CO molecules adsorbed on Cu+ (Cu+–CO) to form CO2 via intermediate carbonate-like species. In short, both the lattice oxygen derived from ceria and the active oxygen (O2−) generated on the CuCe interface can react with the adsorbing CO to form CO2. The consumed surface oxygen can be refilled from bulk diffusion in the catalyst lattice and gaseous oxygen by the oxygen vacancies near to the copper species.
Conclusions
A series of mesostructured CuCe catalysts were successfully prepared via a CTAB-assisted co-precipitation method and tested for low-temperature CO oxidation. In these catalysts, Cu could enter the CeO2 matrix with a fluorite-like structure to form a solid solution, but a higher Cu content causes the formation of bulk CuO. A small crystallite size (5–7 nm) and high surface area (105–131 m2 g−1) of the nanocatalysts can be obtained. The synergistic interaction of Cu and Ce species can produce large amounts of oxygen vacancies and improve the redox ability, thereby favoring the catalytic activity. Among the obtained catalysts, Cu0.1Ce exhibits the highest catalytic activity for CO oxidation with the lowest T50 = 59 °C and high catalytic stability. Active oxygen species from oxygen vacancies can easily react with Cu+–CO to produce CO2 via intermediate carbonate-like species. Furthermore, the stronger adsorption of carbonate-like species causes catalyst deactivation during the CO oxidation reaction due to the fact that the carbon deposition may block some active sites.Conflicts of interest
There are no conflicts to declare.Acknowledgements
This work was financially supported by the National Natural Science Foundation of China (No. 21777055), Shandong Provincial Natural Science Foundation (ZR2017BB004), Shandong Province Key Research and Development Plan (2017GGX202004), and Shandong Province Major Science and Technology Innovation Project (2017CXGC1004).Notes and references
- H. Zhu, Z. Qin, W. Shan, W. Shen and J. Wang, J. Catal., 2005, 233, 41–50 CrossRef CAS.
- F. Yang, J. Graciani, J. Evans, P. Liu, J. Hrbek, J. F. Sanz and J. A. Rodriguez, J. Am. Chem. Soc., 2011, 133, 3444–3451 CrossRef CAS PubMed.
- H. J. Freund, G. Meijer, M. Scheffler, R. SchlöGl and M. Wolf, Angew. Chem., 2011, 50, 10064–10094 CrossRef CAS PubMed.
- E. J. Peterson, A. T. Delariva, S. Lin, R. S. Johnson, H. Guo, J. T. Miller, K. J. Hun, C. H. Peden, B. Kiefer and L. F. Allard, Nat. Commun., 2014, 5, 4885–4895 CrossRef CAS.
- C. Wang, C. Wen, J. Lauterbach and E. Sasmaz, Appl. Catal., B, 2017, 206, 1–8 CrossRef CAS.
- S. Royer and D. Duprez, ChemInform, 2011, 3, 24–65 CrossRef CAS PubMed.
- H. Daly, J. Ni, D. Thompsett and F. C. Meunier, J. Catal., 2008, 254, 238–243 CrossRef CAS.
- G. Wang, L. Wang, X. Fei, Y. Zhou, R. F. Sabirianov, W. N. Mei and C. L. Cheung, Catal. Sci. Technol., 2013, 3, 2602–2609 CAS.
- W. Liu, W. Wang, K. Tang, J. Guo, Y. Ren, S. Wang, L. Feng and Y. Yang, Catal. Sci. Technol., 2016, 6, 2427–2434 CAS.
- D. Mrabet, A. Abassi, R. Cherizol and T. O. Do, Appl. Catal., A, 2012, 447–448, 60–66 CrossRef CAS.
- D. Gu, C. J. Jia, H. Bongard, B. Spliethoff, C. Weidenthaler, W. Schmidt and F. Schüth, Appl. Catal., B, 2014, 152–153, 11–18 CrossRef CAS.
- M. F. Luo, J. M. Ma, J. Q. Lu, Y. P. Song and Y. J. Wang, J. Catal., 2007, 246, 52–59 CrossRef CAS.
- L. Qi, Q. Yu, Y. Dai, C. Tang, L. Liu, H. Zhang, F. Gao, L. Dong and Y. Chen, Appl. Catal., B, 2012, 119–120, 308–320 CrossRef CAS.
- Z. Luo, D. Mao, W. Shen, Y. Zheng and J. Yu, RSC Adv., 2017, 7, 9732–9743 RSC.
- J. L. Ayastuy, A. Gurbani, M. P. González-Marcos and M. A. Gutiérrez-Ortiz, Appl. Catal., A, 2010, 387, 119–128 CrossRef CAS.
- M. Piumetti, S. Bensaid, D. Fino and N. Russo, Appl. Catal., B, 2016, 197, 35–46 CrossRef CAS.
- S. Bensaid, M. Piumetti, C. Novara, F. Giorgis, A. Chiodoni, N. Russo and D. Fino, Nanoscale Res. Lett., 2016, 11, 494–507 CrossRef.
- J. C. Vedrine, Appl. Catal., A, 2014, 474, 40–50 CrossRef CAS.
- S. Liu, X. Wu, W. Liu, W. Chen, R. Ran, M. Li and D. Weng, J. Catal., 2016, 337, 188–198 CrossRef CAS.
- A. S. Poyraz, C. H. Kuo, S. Biswas, C. K. King'Ondu and S. L. Suib, Nat. Commun., 2013, 4, 2952–2961 Search PubMed.
- W. Song, A. S. Poyraz, Y. Meng, Z. Ren, S. Y. Chen and S. L. Suib, Chem. Mater., 2014, 26, 4629–4639 CrossRef CAS.
- R. Kore, R. Srivastava and B. Satpati, ACS Catal., 2013, 3, 2891–2904 CrossRef CAS.
- J. Y. Luo, M. Ming, L. Xiang, X. G. Li, Y. Q. Zha, T. D. Hu, Y. N. Xie and Z. Jing, J. Catal., 2008, 254, 310–324 CrossRef CAS.
- X. Ma, X. Feng, X. He, H. Guo, L. Lv, J. Guo, H. Cao and T. Zhou, Microporous Mesoporous Mater., 2012, 158, 214–218 CrossRef CAS.
- S. Wu, X. Yao, L. Zhang, Y. Cao, W. Zou, L. Li, K. Ma, C. Tang, F. Gao and L. Dong, Chem. Commun., 2015, 51, 3470–3473 RSC.
- S. Wu, L. Zhang, X. Wang, W. Zou, Y. Cao, J. Sun, C. Tang, F. Gao, Y. Deng and L. Dong, Appl. Catal., A, 2015, 505, 235–242 CrossRef CAS.
- H. Zhu, J. Xu, Y. Yichuan, Z. Wang, Y. Gao, W. Liu and H. Yin, J. Colloid Interface Sci., 2017, 508, 1–13 CrossRef CAS.
- X. Wu, Q. Liang, W. Duan, J. Fan and R. Rui, Catal. Today, 2007, 126, 430–435 CrossRef CAS.
- S. Li, H. Zhu, Z. Qin, G. Wang, Y. Zhang, Z. Wu, Z. Li, G. Chen, W. Dong and Z. Wu, Appl. Catal., B, 2013, 144, 498–506 CrossRef.
- J. Li, P. Zhu, S. Zuo, Q. Huang and R. Zhou, Appl. Catal., A, 2010, 381, 261–266 CrossRef CAS.
- C. Deng, Q. Huang, X. Zhu, Q. Hu, W. Su, J. Qian, L. Dong, B. Li, M. Fan and C. Liang, Appl. Surf. Sci., 2016, 389, 1033–1049 CrossRef CAS.
- X. Yao, Y. Xiong, W. Zou, L. Zhang, S. Wu, X. Dong, F. Gao, Y. Deng, C. Tang and Z. Chen, Appl. Catal., B, 2014, 144, 152–165 CrossRef CAS.
- S. Putla, M. H. Amin, B. M. Reddy, A. Nafady, K. A. Al Farhan and S. K. Bhargava, ACS Appl. Mater. Interfaces, 2015, 7, 16525–16535 CAS.
- Z. Wang, H. Zhu, L. Ai, X. Liu, M. Lv, L. Wang, Z. Ma and Z. Zhang, J. Colloid Interface Sci., 2016, 478, 209–216 CrossRef CAS PubMed.
- P. Venkataswamy, K. N. Rao, D. Jampaiah and B. M. Reddy, Appl. Catal., B, 2015, 162, 122–132 CrossRef CAS.
- Y. Li, Z. Wei, F. Gao, L. Kovarik, R. A. L. Baylon, C. H. F. Peden and Y. Wang, ACS Catal., 2015, 5, 3006–3012 CrossRef CAS.
- N. Sutradhar, A. Sinhamahapatra, S. Pahari, M. Jayachandran, B. Subramanian, H. C. Bajaj and A. B. Panda, J. Phys. Chem. C, 2011, 115, 7628–7637 CAS.
- G. Avgouropoulos and T. Ioannides, Appl. Catal., A, 2003, 244, 155–167 CrossRef CAS.
- B. Skårman, D. Grandjean, R. E. Benfield, A. Hinz, A. Andersson and L. R. Wallenberg, J. Catal., 2002, 211, 119–133 Search PubMed.
- A. Davóquiñonero, M. Navlanigarcía, D. Lozanocastello, A. Buenolópez and J. A. Anderson, ACS Catal., 2016, 6, 1723–1731 CrossRef.
- C. Deng, B. Li, L. Dong, F. Zhang, M. Fan, G. Jin, J. Gao, L. Gao, F. Zhang and X. Zhou, Phys. Chem. Chem. Phys., 2015, 17, 16092–16109 RSC.
- L. Dong, Y. Tang, B. Li, L. Zhou, F. Gong, H. He, B. Sun, C. Tang, F. Gao and L. Dong, Appl. Catal., B, 2016, 180, 451–462 CrossRef CAS.
- F. C. Meunier, D. Tibiletti, A. Goguet, D. Reid and R. Burch, Appl. Catal., A, 2005, 289, 104–112 CrossRef CAS.
- D. Gamarra, C. Belver, A. Marcos Fernándezgarcía and A. Martínezarias, J. Am. Chem. Soc., 2007, 129, 12064–12065 CrossRef CAS PubMed.
- A. Martínez-Arias, D. Gamarra, M. Fernández-García, A. Hornés, P. Bera, Z. Koppány and Z. Schay, Catal. Today, 2009, 143, 211–217 CrossRef.
| This journal is © The Royal Society of Chemistry 2018 |

