DOI:
10.1039/C7RA13064C
(Paper)
RSC Adv., 2018,
8, 13370-13387
Fast removal of Co(II) from aqueous solution using porous carboxymethyl chitosan beads and its adsorption mechanism
Received
5th December 2017
, Accepted 15th March 2018
First published on 10th April 2018
Abstract
Porous carboxymethyl chitosan (PCMC) beads were synthesized via ionic coacervation/chemical crosslinking, using polyethylene glycol (PEG) as a porogen and calcium chloride and glutaraldehyde as physical and chemical cross-linkers. The as-synthesized PCMC beads were characterized using SEM, EDS, BET, TGA, FTIR and XPS analysis and then tested for the removal of Co(II) from aqueous solution. The effects of the initial pH, Co(II) concentration and temperature were investigated. It was found that the adsorption equilibrium is reached within 6 h and the maximum adsorption capacity is 46.25 mg g−1. In addition, the kinetics and equilibrium data are well described by pseudo-second-order kinetics and the Langmuir isotherm model. Moreover, the desorption and re-adsorption performance was also studied, and the results revealed that the prepared new adsorbent still showed good adsorption performance after five cycles of regeneration. Finally, the adsorption mechanism, including chemical and physical adsorption, was proposed on the basis of the microstructure analysis, adsorption kinetics and isotherm results, and chemical adsorption was found to be the main adsorption mechanism during the process of the removal of Co(II).
1. Introduction
It is well established that water pollution caused by toxic heavy metals has a serious impact on human beings, animals, and plants in the environment. Recently, this worldwide environmental problem has caused great concern. It must also be mentioned that heavy metals accumulate via the food chain or in drinking water and cause various diseases as well as biological and genetic disorders. As we all know, industrial processes such as mining, electroplating, electric device manufacturing, and battery manufacturing are all major sources of heavy metal pollution.1–3 Cobalt, one of the heavy metals and an oligo element, is necessary for metabolic processes in humans to ensure good health as it is an important component of vitamin B12.4,5 Nevertheless, high concentrations of cobalt can produce a variety of undesirable effects including: low blood pressure, heart failure, diarrhoea, and damage to the thyroid and liver in human beings.4,6 Therefore, we should urgently find an effective method to remove heavy metal contaminants from aquatic systems and keep the pollutant amount at the minimum standard appropriate for living organisms. To this end, numerous techniques (e.g. chemical precipitation,7 ion-exchange,8 coagulation9 and adsorption10) have been studied extensively for the removal of metal pollution. Among these methods, adsorption is of great importance for wastewater treatment due to its high efficiency, flexibility in design and operation, renewability and favorable selectivity.11–14 It should be pointed out that the type of adsorbent plays a critical role in the adsorption process.15
Notably, chitosan, derived from the deacetylation of chitin and which is one of the most abundant natural polymeric materials after cellulose on Earth, has been widely used as an adsorbent for heavy metal removal owing to its ability to remove a substantial number of metal ions in the presence of both amino and hydroxyl groups.16–19 However, the amino groups undergo protonation easily in acidic environments and this results in severe limitations for applications.20 Generally, in order to enhance the stability and mechanical properties of chitosan, the surface of chitosan is modified via a suitable chemical approach. Several excellent investigations were carried out to make derivatives of chitosan via chemical modification techniques, such as sulfonation, quaternarization, hydroxylation, and carboxymethylation.21,22 Among these chitosan derivatives, carboxymethyl chitosan (CMC) is an excellent biodegradable, water-soluble polysaccharide that contains active hydroxyl (–OH), carboxyl (–COOH), and amine (–NH2) groups in the molecule. These groups make it possible to offer enough adsorption sites for chelation with heavy metal ions. It is important to highlight that these compounds can react with many divalent and trivalent cations (i.e., Ca2+, Ba2+, and Fe3+) to produce a stable gel due to electrostatic attraction.23,24 Hence, many medical researchers have reported that calcium, a divalent cation, was used for the physical crosslinking of CMC to maintain the biological efficiency of the molecules.25
In fact, the adsorption properties of CMC have been intensively investigated. For instance, Sun et al.26 found that the prepared CMC was a suitable adsorbent for the removal of Cu(II) ions. Wang et al.27 investigated the adsorption properties of CMC towards Pb(II) ions. Meng et al.28 reported that a novel technique combining surface imprinting and polymer crosslinking was applied to synthesize Ag+-imprinted thiourea/glutaraldehyde grafted CMC beads, and that they demonstrated extremely good selective adsorption of Ag+ from a bimetallic aqueous solution. Song et al.29 reported that a novel xanthated CMC was prepared to remove Cu(II) and Ni(II) from aqueous solutions. It is worthwhile mentioning that CMC is often prepared as microspheres or beads instead of as flakes or powder in the application of removing heavy metal ions. However, there are relatively few studies devoted to the methods for the preparation of CMC beads. It also seems that a relatively long time is needed to reach adsorption equilibrium during the CMC bead adsorption process,30 which mainly results from the large mass transfer resistance in the process of the metal ions diffusing into the beads. In order to improve the adsorption kinetics of CMC beads, they are usually prepared with a porous structure.31,32 Also, so far very little information is available about the adsorption mechanism of CMC.
As reported in this paper, porous carboxymethyl chitosan beads (hereinafter referred to as PCMC beads) were synthesized via an ionic coacervation/chemical crosslinking method for the removal of Co(II) from aqueous solution, in which polyethylene glycol (PEG) was used as a porogen33 and calcium chloride and glutaraldehyde were used as physical and chemical cross-linkers, respectively. The PCMC beads possessed a porous structure, and this provided adsorption performance with fast mass transfer properties. The structure of the prepared PCMC beads was characterized and analyzed using thermogravimetric analysis (TGA), Brunauer–Emmett–Teller (BET) analysis, scanning electron microscopy (SEM), and energy-dispersive X-ray spectroscopy (EDS). The Co(II) adsorption equilibria, kinetics, isotherms and related influencing factors were also explored. Furthermore, the adsorption mechanism of the PCMC beads was investigated via Fourier transform infrared (FTIR) spectroscopy and X-ray photoelectron spectroscopy (XPS). Finally the reusability of the prepared adsorbent was also studied.
2. Materials and methods
2.1 Materials
CMC (pharmaceutical grade, degree of substitution >80%, average molecular mass ca. 300![[thin space (1/6-em)]](https://www.rsc.org/images/entities/char_2009.gif) 000 and a viscosity of 20 cps) was supplied by Aladdin Industrial Co., Ltd, Shanghai, China. PEG-2000 (average molecular mass ca. 1800–2200) was selected as the porogen to prepare the porous structure. CaCl2 was provided by Titan Chemical Technology Co., Ltd, Shanghai, China. Glutaraldehyde (Lingfeng Chemical Co., Ltd., Shanghai, China) was utilized as a crosslinking reagent for solidification. CoCl2·6H2O, HCl, NaOH, and ethanol were purchased from Chinese Medicine Group Chemical Reagent Co., Ltd (Shanghai, China). Co(II) stock solution (1000 mg L−1) was prepared by dissolving cobalt chloride in deionized water and then diluting to the required initial concentrations. 0.1 mol L−1 HCl and 0.1 mol L−1 NaOH were used to adjust the pH value of the working solutions. All chemicals used in this study were of analytical reagent grade.
000 and a viscosity of 20 cps) was supplied by Aladdin Industrial Co., Ltd, Shanghai, China. PEG-2000 (average molecular mass ca. 1800–2200) was selected as the porogen to prepare the porous structure. CaCl2 was provided by Titan Chemical Technology Co., Ltd, Shanghai, China. Glutaraldehyde (Lingfeng Chemical Co., Ltd., Shanghai, China) was utilized as a crosslinking reagent for solidification. CoCl2·6H2O, HCl, NaOH, and ethanol were purchased from Chinese Medicine Group Chemical Reagent Co., Ltd (Shanghai, China). Co(II) stock solution (1000 mg L−1) was prepared by dissolving cobalt chloride in deionized water and then diluting to the required initial concentrations. 0.1 mol L−1 HCl and 0.1 mol L−1 NaOH were used to adjust the pH value of the working solutions. All chemicals used in this study were of analytical reagent grade.
2.2 Preparation of CMC beads and PCMC beads
Different amounts of PEG (0.4, 0.8, 1.2, 1.6, and 2 g) were dissolved in 50 mL of deionized water to obtain a viscous solution after stirring at room temperature. 2.0 g CMC was then added into the corresponding PEG solution under the stirring of an electric mixer to generate a homogeneous dispersion. This prepared mixture solution is the dispersed phase and the CaCl2 solution is the continuous phase. The dispersed phase was placed in a 10 mL syringe equipped with a flat nozzle (Φ = 600 μm). Driven by a micro-injection pump, the mixture solution was dropped into 100 mL 2% CaCl2 solution (the distance between the top of the nozzle and the surface of the CaCl2 solution was 15 cm) at a speed of 60 ml h−1 to generate micro-beads. The obtained beads were sealed in the CaCl2 solution to solidify for an hour. Then, the coagulated beads were washed several times with deionized water and placed in 100 mL 1% glutaraldehyde solution to further solidify for an hour. Finally, the PCMC beads were washed with ethanol and deionized water during vacuum filtration several times. The washed beads were dried at 40 °C for 8 h in an oven. The CMC beads were prepared using the same protocol except without PEG participation. The effects of the amount of PEG and the glutaraldehyde solidifying time on forming pristine PCMC beads were studied in advance. Fig. 1(a) shows an illustrative diagram for the preparation of the PCMC beads. The images of the PCMC beads at different periods are shown in Fig. 1(b), (c) and (d).
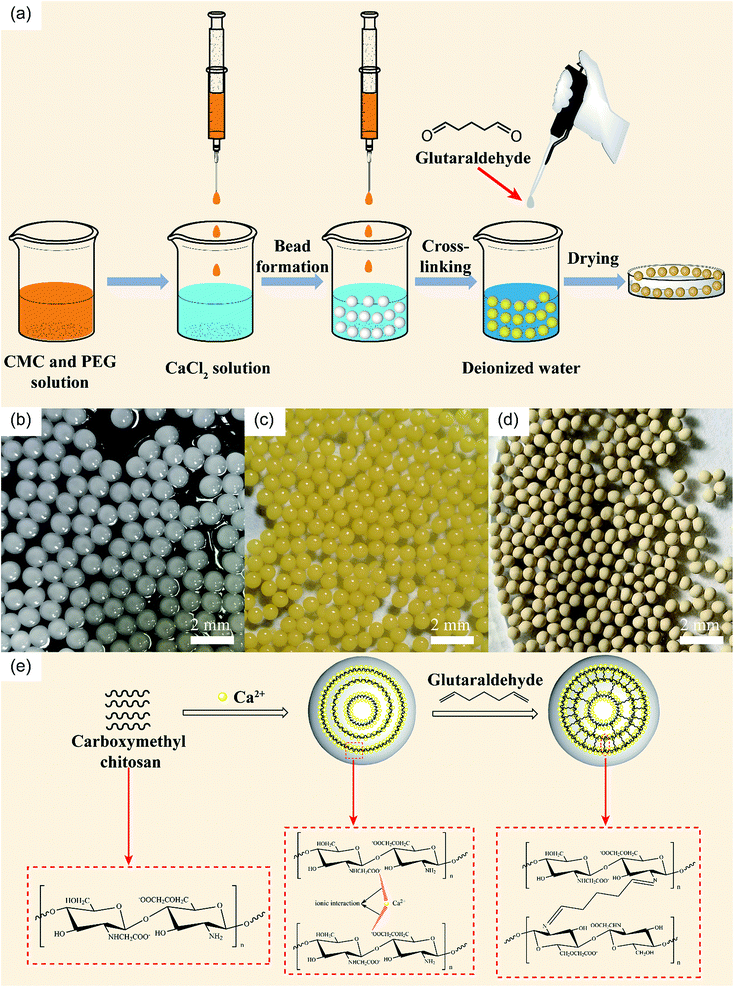 |
| | Fig. 1 (a) Schematic illustration of the preparation of PCMC beads. Photos of CaCl2 physical-crosslinking beads (b), glutaraldehyde chemical-crosslinking beads (c), and beads after drying (d). (e) Mechanism of PCMC beads formation. | |
We prepared the PCMC beads by adding PEG as the pore template. The mechanism of using PEG to generate the porous structure starts with PEG being easily dissolved in water. When the prepared beads are washed with deionized water, the PEG in the beads can dissolve in water. Then, a great number of pores can be formed both on the surface and inside the prepared beads.
2.3 Characterization and analysis
The cobalt concentration was determined using an inductively coupled plasma optical emission spectrometer (Agilent ICP-725ES, Agilent Technologies, America). The Fourier transformed infrared (FTIR) spectra were obtained using a spectrometer (Nicolet 6700, Thermo Fisher, America) with KBr pellets in the wavenumber range of 4000–500 cm−1. The surface morphology and microstructures of the CMC and PCMC beads were examined using SEM (S3400N, HITACHI, Japan). EDX analysis was performed for elemental composition using the same S3400N during SEM studies. Thermal analysis of the PCMC beads was accomplished on a Thermo Gravimetric Analyzer (Pyris 1 TGA, PerkinElmer Co., Ltd, America) in the temperature range 30–610 °C with a heating rate of 10 °C min−1 in a nitrogen medium. The specific surface area, pore size and pore volume of the PCMC beads were investigated using a TriStar II Plus 2.02 Surface Area and Pore Size Analyzer (Micromeritics Instrument Co., Ltd, America) with a N2 adsorption–desorption method under 0.08 MPa. XPS was applied to determine the existing states of the atoms of the adsorbent before and after metal ion adsorption, using an ESCALAB 25 spectrometer (Thermo Fisher Scientific, America).
2.4 Characterization of the mechanical properties
The mechanical properties were tested via a self-made method using a strength test machine (HPA, Handpi, China). The measured method was operated according to the preparation described in the literature with slight modifications.34 Three uniform-sized PCMC beads forming an equilateral triangle were put between two glass sides. Then, the pressure was increased gradually on the centre of the glass slide until at least one of the beads was fractured. The value of the fractured pressure was recorded on the dashboard of the test machine. The mechanical intensity was calculated by dividing the fractured pressure value by the whole sectional area of the three spheres. This measuring experiment was carried out twelve times and the average value was taken as the mechanical strength after removing the maximum and minimum values.
2.5 Characterization of the swelling properties
The swelling properties of the PCMC beads were investigated in experimental solution (pH 6.0 and 200 mg L−1). A certain amount of the PCMC beads (0.05 g) was soaked in this experimental solution at room temperature and the beads were taken out at regular intervals. The residual water on the surface was blotted with filter paper. The wet beads were weighed and the swelling ratio was calculated according to the following formula:| |
 | (1) |
where Wt is the weight (g) of the wet beads at time t and W0 is the weight (g) of the initial beads. When the wet beads reached swelling equilibrium, the maximum swelling ratio (MSR) was obtained. All the experiments were carried out in triplicate and the experimental results were averaged.
2.6 Adsorption experiments
To investigate the ability of the PCMC beads and CMC beads to remove cobalt from aqueous solution, batch experiments were carried out by adding 25 mL cobalt solution into 50 mL plastic centrifuge tubes with the adsorbent (0.05 g). The plastic centrifuge tubes were placed in a thermostatic water bath vibrator (DSHZ-300A, Peiying Experimental Equipment Co., Ltd, Suzhou) and shaken at 200 rpm.
In the tests involving kinetic adsorption, cobalt solutions with different initial concentrations (50, 100 and 200 mg L−1) were obtained by diluting the stock solution with deionized water. The experiment was carried out at an initial pH of 6.0 and at 30 °C. A fixed volume of solution was taken out at fixed time intervals. The adsorbed amount of Co(II) per unit weight of the beads at time ti, q(ti) (mg g−1), was calculated with the equation as follows:
| |
 | (2) |
where
C0 is the initial concentration of the cobalt solution and
Ci is the concentration of the cobalt solution at time
ti.
V0 is the initial volume of the solution and
V is the volume of the extracted fixed sample.
m is the weight of adsorbent used in the experiment.
In order to study the effects of the initial pH of the aqueous solution and the reaction temperature on the adsorption of Co(II) onto the PCMC beads, 0.1 mol L−1 NaOH and 0.1 mol L−1 HCl were used to adjust the pH value of the experimental solution in the range of 2–7, and the reaction temperature was separately set to 30, 40, 50, 60 and 70 °C. Adsorption isotherm studies were performed at the initial cobalt concentrations of 20, 50, 100, 150, 200, 250 and 300 mg L−1 at pH 6.0. The adsorption time is 24 h and reaction temperatures are 30, 45 and 60 °C.
ICP was used to determine the residual Co(II) concentration of the solution. The adsorption capacity, q (mg g−1), was calculated with the equation as follows:
| |
 | (3) |
where
C0 is the initial concentration of the Co(
II) solution and
Ce is the equilibrium concentration of the Co(
II) solution.
V0 is the initial volume of the solution and
m is the weight of adsorbent added into the tube.
In order to ensure the non-accidental nature of experimental results, all the experiments were carried out in triplicate and the experimental results were averaged. Then, the group of experimental data with the closest average was chosen to be presented in our paper.
2.7 The effect of other metal ions
In order to study the effects of other metal ions on the uptake of Co(II), multiunit groups of competitive adsorption experiments were carried out. Several typical toxic heavy metals of public concern from wastewater were selected, including Pb2+, Ni2+, and Mn2+. As well as these competitive metal ions, we also selected ions with two different charges to the cobalt ion, like Na+ and Al3+. During the competitive experiments, metal ions of the same charge, as one group, were mixed together to form coexisting solutions of various ions. Metal ions of different charges, as another group, were also formed into mixed solutions. 0.05 g PCMC beads was added into a centrifuge tube that contained 25 mL of 200 mg L−1 Co(II)/M(II) (M = Pb, Mn, Ni) solution (pH = 6.0). After adsorption for 24 h, the adsorption amounts of the PCMC beads for Co(II) and other competitive metal ions were calculated. The distribution coefficient Kd (mL g−1) and competitive coefficient k are given as follows:| |
 | (4) |
| |
 | (5) |
where C0 and Ce represent the initial and equilibrium concentrations of the metal ions, respectively. Kd1 and Kd2 are the distribution coefficients of Co(II) and the competitive metal ions, respectively. V is the volume of the solution. m is the weight of the PCMC beads used in the experiments.
2.8 Desorption and regeneration studies
For the desorption and reuse studies, 0.1 mol L−1 HCl was chosen as the desorbent in the following experiments. A certain amount of PCMC beads after adsorbing Co(II) was added into 30 mL HCl and shaken at 30 °C for 24 h. Then, the beads were filtered and submerged in 30 mL 0.1 mol L−1 NaOH for 6 h to activate their functional groups. Finally, the beads were washed with deionized water during vacuum filtration several times until neutral pH was reached. After drying at 40 °C in an oven, the collected beads were further used as the adsorbent of the next adsorption cycle. The regeneration experiments were conducted five times.
3. Results and discussion
3.1 Optimal composition of the prepared PCMC beads
In order to remove Co(II) through an experiment under optimal conditions, the effects of the amount of PEG and the crosslinking time on the adsorption of Co(II) were investigated in this paper.
The results of Co(II) uptake by the PCMC beads with different amounts of PEG are shown in Fig. 2a. It displays the inverse V-shaped variation in Co(II) adsorption when the PEG content increased. When the PEG content was 0.6 g (CMC![[thin space (1/6-em)]](https://www.rsc.org/images/entities/char_2009.gif) :
:![[thin space (1/6-em)]](https://www.rsc.org/images/entities/char_2009.gif) PEG = 5
PEG = 5![[thin space (1/6-em)]](https://www.rsc.org/images/entities/char_2009.gif) :
:![[thin space (1/6-em)]](https://www.rsc.org/images/entities/char_2009.gif) 3), the adsorption capacity for Co(II) was the best.
3), the adsorption capacity for Co(II) was the best.
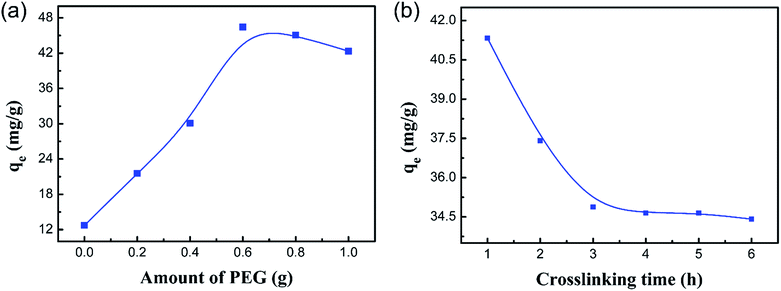 |
| | Fig. 2 Effect of the amount of PEG (a) and the crosslinking time (b) for the PCMC bead adsorption of Co(II). | |
The effect of the crosslinking time on the adsorption of Co(II) is shown in Fig. 2b. It is noteworthy that the adsorption capacity for Co(II) decreased slowly as the crosslinking time was raised from 1 to 6 h. This suggested that the favorable crosslinking time of glutaraldehyde for the effective removal of Co(II) is 1 h. This resulted from the fact that the amino groups of CMC are involved in chemical linkages with the aldehyde groups of glutaraldehyde (Schiff base reaction), and the amino groups are involved in chemical chelation with Co(II) ions in the adsorption process as ref. 35 demonstrated.
In addition to an efficient removal rate and to being environmentally friendly, the mechanical strength of an adsorbent is also critical as the adsorbent must be protected from damage when resisting various forces during the application process. The mechanical strength of the PCMC beads with different crosslinking times was studied, as shown in Table 1. As can be seen, the crosslinking time that gives the best mechanical strength is 3 h, followed by 1 h crosslinking time. Fig. 3 shows the schematic diagram of the measuring equipment for mechanical strength, and shows different micro images of PCMC beads before and after fracture.
Table 1 The mechanical strength of PCMC beads with different crosslinking times
| Crosslinking time (h) |
1 |
2 |
3 |
4 |
5 |
6 |
| Mechanical strength (MPa) |
0.32 |
0.29 |
0.42 |
0.22 |
0.18 |
0.19 |
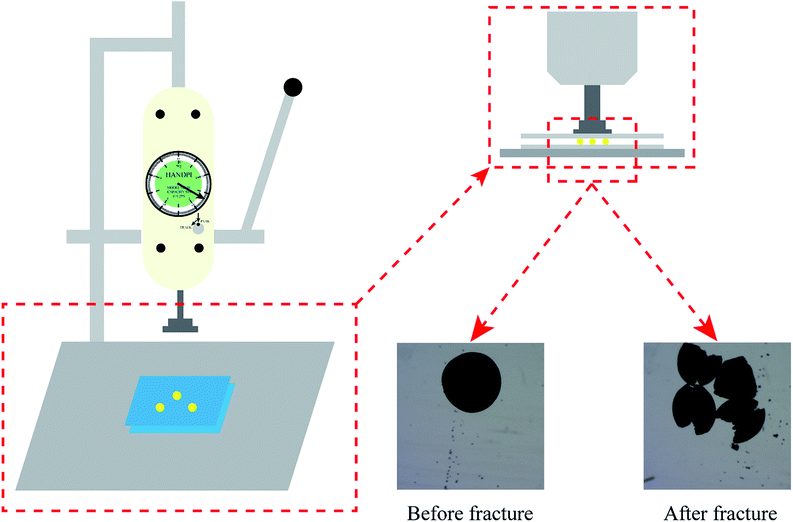 |
| | Fig. 3 Schematic diagram of mechanical strength measurements. | |
Therefore, in consideration of both the adsorption and mechanical properties, the PCMC beads with CMC![[thin space (1/6-em)]](https://www.rsc.org/images/entities/char_2009.gif) :
:![[thin space (1/6-em)]](https://www.rsc.org/images/entities/char_2009.gif) PEG = 5
PEG = 5![[thin space (1/6-em)]](https://www.rsc.org/images/entities/char_2009.gif) :
:![[thin space (1/6-em)]](https://www.rsc.org/images/entities/char_2009.gif) 3 and 1 h crosslinking time were found to be superior to the other beads. As a result, the following adsorption experiments were all based on the PCMC beads with the above preparation conditions.
3 and 1 h crosslinking time were found to be superior to the other beads. As a result, the following adsorption experiments were all based on the PCMC beads with the above preparation conditions.
3.2 Structural characterization and analysis of the PCMC beads
The IR spectra of the CMC and PCMC beads are shown in Fig. 4. Fig. 4a shows the basic characteristics of CMC at: 3421 cm−1 (N–H and O–H stretching vibration), 2920 and 2881 cm−1 (C–H symmetric and asymmetric stretching vibration), 1605 and 1425 cm−1 (an asymmetric and a symmetric vibration peak of COO−), and 1078 cm−1 (C–OH stretching vibration). Comparing to Fig. 4a, the spectrum of the PCMC beads (Fig. 4b) shows a new peak at 1651 cm−1 that was attributed to the C![[double bond, length as m-dash]](https://www.rsc.org/images/entities/char_e001.gif) N linkage derived from the Schiff base, and this clearly indicates that the crosslinking reaction with glutaraldehyde occurred on the amine groups in CMC. The asymmetric (1605 cm−1) and symmetric (1425 cm−1) stretching vibrations of the COO− group were shifted to 1593 and 1420 cm−1, respectively, due to the ionic interaction between the carboxylic groups and the calcium ions. The wavenumber at 1078 cm−1 that was assigned to the C–OH stretching vibration moved to 1067 cm−1, possibly suggesting that C–OH may participate in the crosslinking reaction.
N linkage derived from the Schiff base, and this clearly indicates that the crosslinking reaction with glutaraldehyde occurred on the amine groups in CMC. The asymmetric (1605 cm−1) and symmetric (1425 cm−1) stretching vibrations of the COO− group were shifted to 1593 and 1420 cm−1, respectively, due to the ionic interaction between the carboxylic groups and the calcium ions. The wavenumber at 1078 cm−1 that was assigned to the C–OH stretching vibration moved to 1067 cm−1, possibly suggesting that C–OH may participate in the crosslinking reaction.
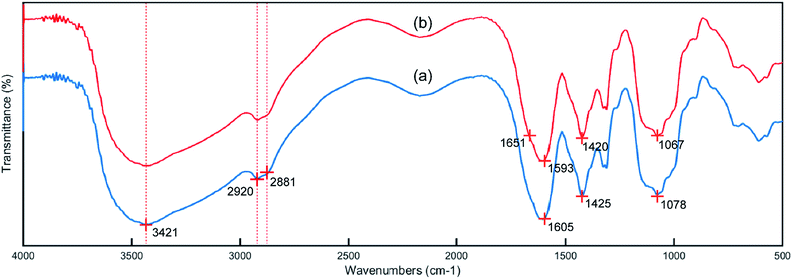 |
| | Fig. 4 IR spectra of the CMC (a) and PCMC (b) beads. | |
The SEM images of a PCMC and CMC bead with different magnification both of the surface and cross-section are shown in Fig. 5a–p. From Fig. 5a and i we can observe clearly that the PCMC and CMC beads are both about 1 mm in diameter. The high-magnification SEM images (Fig. 5c and d) of the PCMC bead show essentially the rough surface morphology composed of randomly distributed pores with a pore size of 10–40 nm, and this is similar to the ones calculated from the BET results (Table 2). In the cross-sectional images of the PCMC bead (Fig. 5e and f), there are long parallel channels extending from the core to the surface of the bead. These channels are the places where PEG added into the beads and dissolved in water when the beads were washed with water. Hence, this is also the reason that a great number of pores were formed both on the surface of and inside the beads. In contrast, the SEM images of the CMC bead (Fig. 5i and j) show a very different morphology as they present a smooth surface. To gain more insight, the cross-sectional SEM images of the CMC bead were also collected, as shown in Fig. 5m–p. As predicted, the morphology of the cross-section is smooth in accordance with the surface of the CMC bead. On the basis of the comparison between the SEM images of the PCMC and CMC beads, it can be concluded that the porous structure greatly facilitates the PCMC beads in the removal of Co(II) ions directly.
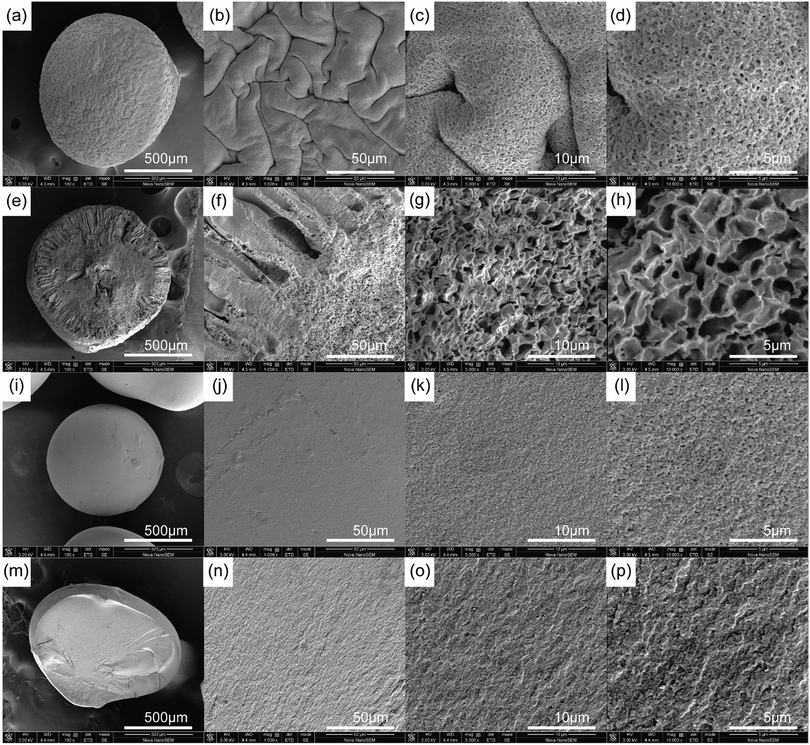 |
| | Fig. 5 SEM images of a PCMC bead (a–d) and its cross-section (e–h), and a CMC bead (i–l) and its cross-section (m–p) at 100×, 1000×, 5000×, and 10000× magnification, respectively. | |
Table 2 Comparison of the BET surface area of various chitosan adsorbents
| Adsorbents |
BET surface area (m2 g−1) |
Ref. |
| Tin(IV) cross-linked chitosan |
3.02 |
37 |
| Aliquant 336 functionalized chitosan |
2.43 |
38 |
| SDS-modified chitosan |
0.67 |
39 |
| Chitosan-EGDE beads |
0.62 |
40 |
| Chitosan |
1.20 |
41 |
| PVA/chitosan |
1.95 |
42 |
| ADH-CMCS microspheres |
20.1 |
43 |
| CMC beads |
0.49 |
This work |
| PCMC beads |
9.36 |
This work |
The element change in the adsorbent during the adsorption process was confirmed through EDS, as shown in Fig. 6. The EDS spectrum of a PCMC bead (Fig. 6a) indicates that carbon, nitrogen and oxygen were the primary elements in the beads. It should be pointed out that the peak of calcium emerged clearly in the EDS spectrum, which further confirmed that calcium was chelated into the PCMC beads successfully. As for the EDS spectrum of a PCMC bead after the adsorption of Co(II) (Fig. 6b), it is worthwhile mentioning that the existence of a cobalt element peak proved that Co(II) was adsorbed on the PCMC bead.
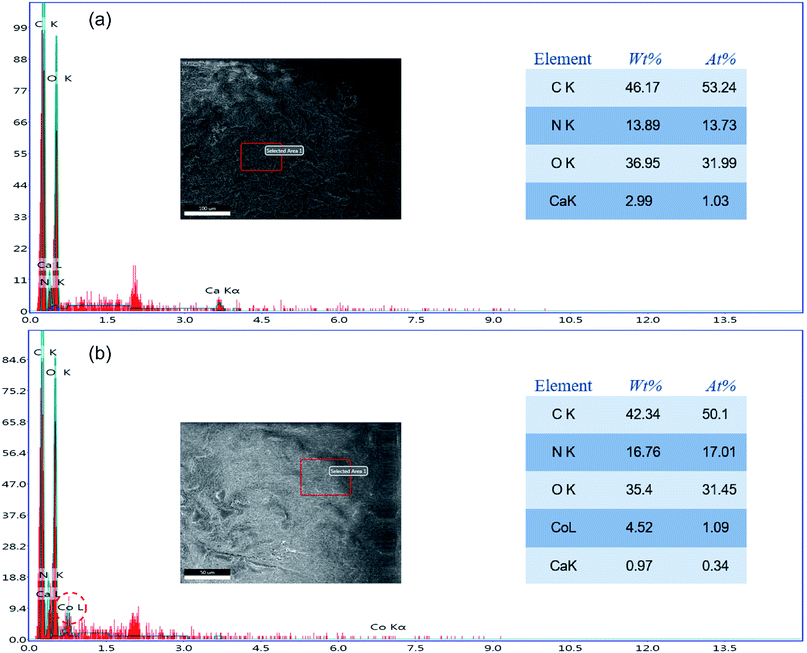 |
| | Fig. 6 EDS spectra of a PCMC bead before (a) and after (b) adsorption of Co(II). | |
The TGA curve of the PCMC beads is shown in Fig. 7a. As can be seen from the TGA curve, the degradation process mainly had three stages of mass loss during the heating process. The first stage (A) was in the range of 40–150 °C, with a weight loss of 18%, which corresponds to the loss of water physically adsorbed into the PCMC beads. The second stage (B) began at 250 °C, with a high value of mass loss of about 49.95%, which resulted from the decomposition and ablation of the CMC molecule chains. The mass loss at the last stage (C), observed between 460 and 520 °C, was 22.44%. This could be attributed to the carbonization of the CMC structure of the molecule. Notably, the TGA results could provide the basis for selecting the optimal desorption temperature and time during the BET experiment.
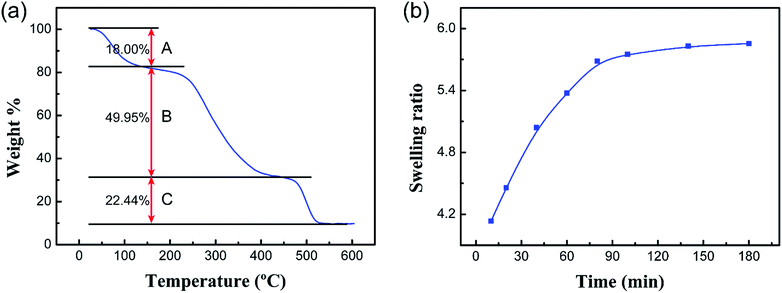 |
| | Fig. 7 (a) TGA curve of the PCMC beads and (b) the swelling ratios of the PCMC beads with contact time in the experimental solution. | |
Brunauer–Emmett–Teller (BET) gas sorptometry measurements were conducted to examine the porous nature of the PCMC beads. Fig. 8a shows the N2 adsorption/desorption isotherm. The isotherm corresponds to a type IV isotherm in the Brunauer classification, indicating that the PCMC beads are typical mesoporous materials.35,36 According to the IUPAC classification, the hysteresis loop basically belongs to type H3, which shows a parallel plate slit pore structure. It also proved the presence of a mesoporous structure in the PCMC beads. Fig. 8b shows the pore size distribution curve of the PCMC beads. Using the BJH method and the desorption branch of the isotherm, the surface parameters of the PCMC beads were calculated. The BET surface area, pore size, and pore volume of the PCMC beads were 9.36 m3 g−1, 12.81 nm, and 0.023 cm3 g−1, respectively. The BET surface area of either natural or artificial chitosan adsorbents reported in previous studies is summarized and compared with that of the PCMC and CMC beads in Table 2.
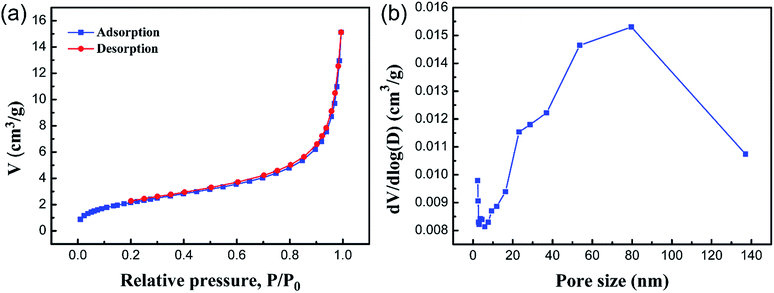 |
| | Fig. 8 Nitrogen adsorption–desorption isotherm of the PCMC beads (a) and the BJH-adsorption pore size distribution curve of the PCMC beads (b). | |
Obviously, in comparison to other adsorbents in the literature, a large value of specific surface area for the PCMC beads is beneficial for the removal of Co(II). The BET results strongly support the fact that the PCMC beads have a porous structure, and this is consistent with the observations from SEM.
Swelling property measurements were carried out to examine the water-absorption rate of the PCMC beads. Fig. 7b shows the absorption rate curve of the PCMC beads in the experimental solution. As can be seen, the swelling ratio increased with increasing contact time and absorption equilibrium was nearly obtained when the contact time was 3 h, which indicated that the porous structure of the PCMC beads could facilitate the diffusion of water from the surface to inside the bead. The swelling property measurement results indirectly support the fact that the porous structure is beneficial to the adsorption rate, which is in good accordance with the adsorption kinetics results described in the below section.
3.3 Effect of pH
It is generally accepted that the adsorption process is significantly affected by pH in aqueous solution, which results from the protonation of the amino groups and the degree of ionization of the adsorbate.44 In order to investigate the optimum pH value for the removal of Co(II), batch mode experiments with different pH values were conducted and the results are shown in Fig. 9. Clearly, when increasing the pH value from 2 to 6, the adsorption capacity increases from 1.54 to 47.28 mg g−1 for the PCMC beads. As described above, the low value of the adsorption capacity resulted from the effect of the surface charge of the adsorbent and the degree of ionization and speciation of the adsorbate. In other words, it could be analyzed using the following theory. According to previous research, the amino protonation and carboxyl ionization reaction is expressed as:When the pH value is lower, the protonation of the amino groups results in a decrease in the adsorption capacity, as shown in eqn (6). Also, more positively charged hydrogen ions will be available at lower pH, so the equilibrium (eqn (7)) is shifted to the left and the ionization of the carboxyl groups is inhibited. It was observed that the competition between cobalt ions and hydrogen ions for adsorption sites was the major reason that the chelation and adsorption of Co(II) was restrained. With an increase in the pH value, the amino groups are deprotonated, which causes an increase in Co(II) adsorption. The equilibrium is shifted to the right and promotes the ionization of the carboxyl groups at higher pH levels. The formed –COO− groups further facilitate the removal of Co(II). However, when the pH is increased to about 7, the adsorption capacity drops a little bit, given that a small amount of the CMC chains become –O–.45
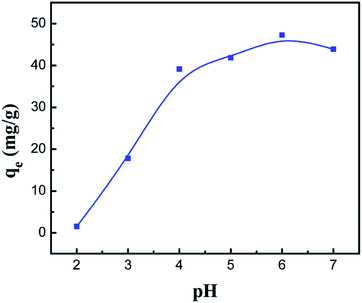 |
| | Fig. 9 Effect of the pH value on the adsorption capacity of the PCMC beads. | |
3.4 Effect of temperature and adsorption thermodynamics
For the sake of investigating the effect of temperature on the adsorption of Co(II) onto the PCMC beads, experiments were carried out in the range of 30 to 70 °C and the results are shown in Fig. 10a. It was indicated that the adsorption capacity decreases slightly with increasing temperature. Hence, we conducted the following experiments at a temperature of 30 °C.
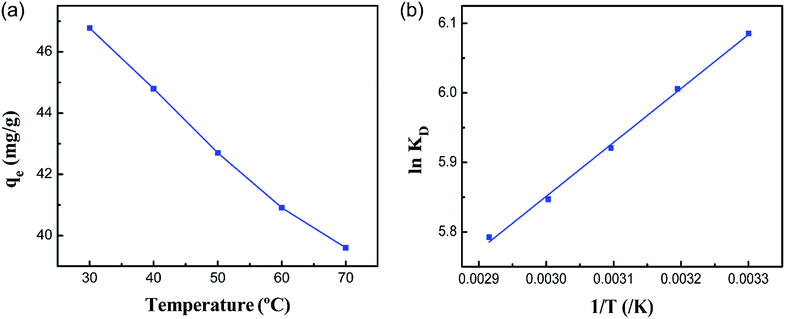 |
| | Fig. 10 (a) Effect of temperature on the adsorption capacity of the PCMC beads for Co(II) and (b) the relationship between ln![[thin space (1/6-em)]](https://www.rsc.org/images/entities/char_2009.gif) KD and 1/T for Co(II) adsorption of the PCMC beads. KD and 1/T for Co(II) adsorption of the PCMC beads. | |
As we all know, measurement of the Gibbs energy change (ΔG0) is an effective method for investigating whether adsorption is spontaneous or not. On the basis of the laws of thermodynamics, ΔG0 can be calculated from the following equations:46,47
| |
ΔG0 = −RT![[thin space (1/6-em)]](https://www.rsc.org/images/entities/char_2009.gif) ln ln![[thin space (1/6-em)]](https://www.rsc.org/images/entities/char_2009.gif) KD KD
| (8) |
| |
 | (10) |
| |
 | (11) |
where
R is the universal gas constant (8.314 J mol
−1 K
−1) and
T is the absolute temperature (K).
Ce (mmol L
−1) is the equilibrium concentration of Co(
II) in solution and
qe (mmol L
−1) is the equilibrium amount of Co(
II) on the adsorbent.
KD is the thermodynamic equilibrium constant equal to
qe/
Ce. During the adsorption process, the Gibbs free energy change is related to the characteristics of the adsorbate and the adsorption mechanism. Based on the Van’t Hoff equation,
48 the relationship of
qe/
Ce (
KD) and
T can be expressed as
eqn (11). The adsorption thermodynamic parameters of the enthalpy (Δ
H0) and entropy (Δ
S0) changes were calculated by plotting ln(
qe/
Ce)
versus (1/
T). The results are shown in
Fig. 10b and
Table 3.
Table 3 Thermodynamic parameters for the adsorption process of Co(II) on PCMC
| T (K) |
ΔG0 (kJ mol−1) |
ΔH0 (kJ mol−1) |
ΔS0 (J mol−1 K−1) |
| 303 |
−15.33 |
−6.446 |
29.31 |
| 313 |
−15.62 |
|
|
| 323 |
−15.89 |
|
|
| 333 |
−16.18 |
|
|
| 343 |
−16.51 |
|
|
From Table 3, it can be seen that the values of ΔG0 are negative at all temperatures, indicating that the adsorption process of Co(II) onto the PCMC beads is spontaneous. The values of ΔH0 and ΔS0 were −6.446 kJ mol−1 and 29.31 J mol−1 K−1, respectively. The negative value of ΔH0 confirms that the adsorption reaction is exothermic. Therefore, a higher temperature would hinder the adsorption of Co(II) by the PCMC beads. The positive value of ΔS0 demonstrates the increase of randomness at the solid/solution interface during the adsorption process.35
3.5 Adsorption kinetics
The adsorption kinetics represent the solute removal rate, which reflects the residence time of the adsorbate at the solid/solution interface. Determination of the value of the residence time is a significant method to explore when the adsorption process reaches equilibrium. To investigate the adsorption mechanism and behavior, kinetic models including pseudo-first-order, pseudo-second-order and intraparticle diffusion models are widely used to fit adsorption data. The pseudo-first-order and second-order kinetic models can be expressed as follows:| |
 | (12) |
| |
 | (13) |
where t is contact time (h), qt and qe are the adsorption capacity for Co(II) at time t and equilibrium (mg g−1), respectively, and K1 (h−1) and K2 (g mg−1 h−1) are the rate constants.
To further evaluate the rate-controlling step, the model of intraparticle diffusion is also used, which is given as follows:
| |
 | (14) |
where
K3 (mg g
−1 h
−0.5) is the rate constant of the intraparticle diffusion.
Fig. 11a shows the effect of contact time on the adsorption capacity for Co(II) on the PCMC and CMC beads with different initial concentrations. It is observed that the adsorption equilibria of the PCMC beads were all established at about 16 h and the maximum capacity was about 43 mg g−1. It should be pointed out that the adsorption equilibrium time at an initial concentration of 200 mg L−1 was 6 h. In contrast, for the CMC beads, a long time of about 140 h was taken to reach the adsorption equilibrium at all initial concentrations. The adsorption equilibrium times of other reported chitosan-based adsorbents for Co(II) are summarized and compared with that of the PCMC beads in Table 5. Such a fast adsorption rate confirms that the porous structure is beneficial to the diffusion of the adsorbate.
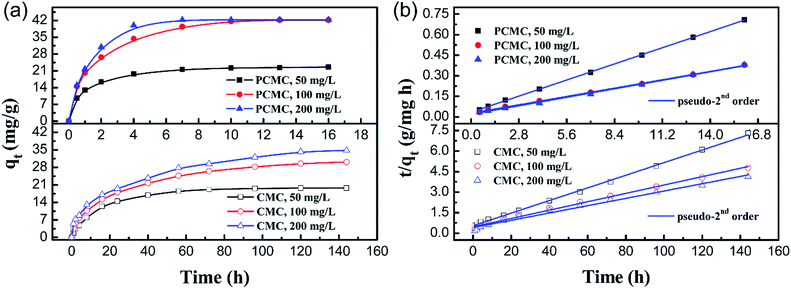 |
| | Fig. 11 (a) Effect of contact time on the adsorption capacity of the PCMC and CMC beads at different initial concentrations and (b) the kinetic curves (fitting to the pseudo-second order equation) for the adsorption of Co(II) onto the PCMC and CMC beads. | |
The values of different adsorption kinetics model parameters were obtained by calculating the slope and intercept of linear fitting and the results are listed in Table 4. Table 4 shows that the pseudo-second-order kinetic model was more suitable for fitting the experimental data than the pseudo-first-order model for both the PCMC and CMC beads on the basis of the correlation coefficients (R2). The kinetic curves (Fig. 11b) of fitting to the pseudo-second-order model for the adsorption of Co(II) onto the PCMC and CMC beads more intuitively confirm the above facts. It was suggested that the whole adsorption process was mainly controlled by chemical reaction.48
Table 4 Adsorption kinetics parameters of the different models for Co(II) adsorption on the CMC and PCMC beads
| Initial concentration (mg L−1) |
Pseudo-first-order |
Pseudo-second-order |
Intraparticle diffusion |
| Qe (mg g−1) |
K1 (h−1) |
R2 |
Qe (mg g−1) |
K2 (g mg−1 h−1) |
R2 |
K3 (mg g−1 h−0.5) |
C |
R2 |
| 50 |
CMC |
17.76 |
0.0483 |
0.9949 |
21.71 |
0.0039 |
0.9988 |
1.6951 |
3.141 |
0.8550 |
| PCMC |
10.77 |
0.2594 |
0.9618 |
23.78 |
0.0529 |
0.9998 |
3.6973 |
9.870 |
0.8243 |
| 100 |
CMC |
28.18 |
0.0316 |
0.9723 |
32.72 |
0.0020 |
0.9935 |
2.4965 |
3.642 |
0.9519 |
| PCMC |
34.92 |
0.3941 |
0.9894 |
45.96 |
0.0176 |
0.9992 |
8.3918 |
13.22 |
0.8770 |
| 200 |
CMC |
30.22 |
0.0251 |
0.9886 |
37.44 |
0.0017 |
0.9861 |
2.7746 |
4.657 |
0.9733 |
| PCMC |
40.35 |
0.6716 |
0.9936 |
50.05 |
0.0168 |
0.9980 |
14.201 |
8.369 |
0.9110 |
Moreover, in comparison with the pseudo-first-order and pseudo-second-order models, the R2 values of intraparticle diffusion for the PCMC and CMC beads were relatively lower, suggesting that intraparticle diffusion was not the rate-controlling step. According to the results of the adsorption kinetics study for Co(II) onto the PCMC and CMC beads, chemical adsorption was the main adsorption method during the adsorption process.
3.6 Adsorption isotherms
The adsorption isotherm is defined as the description of the interactive behavior of the solution and adsorbent. In this work, to further explore adsorption behaviors and mechanisms, the Langmuir and Freundlich models were applied to study the adsorption equilibrium. The linear forms of the Langmuir and Freundlich models are represented by the following equations:| |
 | (15) |
| |
 | (16) |
where qe and Qm are the adsorption capacity at equilibrium and the maximal adsorption capacity, respectively (mg g−1). KL and KF are the Langmuir and Freundlich constants, respectively (L mg−1 and mg g−1). Ce is the equilibrium concentration of Co(II) (mg L−1).
Fig. 12a shows the effect of the initial concentration of Co(II) on the adsorption capacity at different temperatures. It was illustrated that the equilibrium adsorption amount (qe) increases along with increasing initial concentration, and adsorption reaches equilibrium when C0 is 200 mg L−1. The maximum adsorption capacity of the PCMC beads under the optimized conditions was 46.25 mg g−1. The adsorption capacities of other reported chitosan-based adsorbents for Co(II) are summarized and compared with that of the PCMC beads in Table 5.
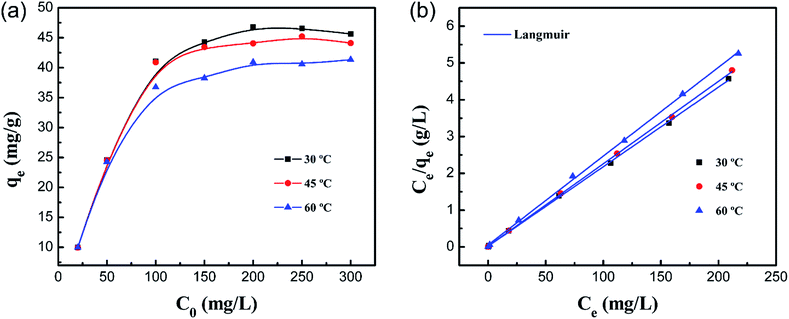 |
| | Fig. 12 (a) Effect of the initial concentration on the adsorption capacity of the PCMC beads for Co(II) and (b) the Langmuir model for the adsorption of Co(II) on the PCMC beads. | |
Table 5 Adsorption performance for the adsorption of Co(II) onto different chitosan-based adsorbents
| Adsorbent |
Adsorption equilibrium time (h) |
Adsorption capacity (mg g−1) |
Ref. |
| Cobalt(II) imprinted chitosan |
72 |
29.52 |
50 |
| Polyvinyl alcohol (PVA)/chitosan |
18 |
14.39 |
51 |
| A novel xanthate-modified magnetic chitosan |
8 |
18.5 |
52 |
| Surface-grafted Co(II)-imprinted chitosan |
9 |
22 |
53 |
| Whisker surface ion-imprinted chitosan |
3 |
33.75 |
54 |
| DTPA-chitosan |
12 |
49.1 |
55 |
| PCMC beads |
6 |
46.25 |
This work |
The values from the Langmuir and Freundlich experimental data were obtained using the linear fitting method and the results are shown in Table 6. Obviously, the Langmuir isotherm model better fitted the experimental data than the Freundlich isotherm model based on the higher R2, indicating that the adsorption process is monolayer surface adsorption with a finite number of identical adsorption sites that are homogeneously distributed on the adsorbent surface.49 It is worthwhile mentioning that the decrease of KL with temperature shows that there is a physical interaction between the adsorbent and Co(II). Therefore, it was revealed that the adsorption process of Co(II) by the PCMC beads may also involve physical adsorption.
Table 6 Adsorption isotherm parameters of Co(II) onto the PCMC beads for different models
| Temperature (°C) |
Langmuir |
Freundlich |
| Qmax (mg g−1) |
KL (L mg−1) |
R2 |
n |
KF (mg g−1) |
R2 |
| 30 |
PCMC |
46.25 |
1.1144 |
0.9995 |
6.1912 |
22.04 |
0.9501 |
| 45 |
PCMC |
44.62 |
1.1039 |
0.9996 |
5.578 |
19.66 |
0.8791 |
| 60 |
PCMC |
41.41 |
0.4420 |
0.9993 |
6.1463 |
18.97 |
0.9358 |
3.7 Competitive adsorption study
The competitive adsorption of ions of the same charge (Pb2+, Mn2+ and Ni2+) and different charges (Al3+ and Na+) from their mixed solutions was investigated using the PCMC beads. Fig. 13 and Table 7 show the results of the competitive experiments. As expected, the PCMC beads didn’t exhibit good adsorption selectivity for Co(II) in the presence of competitive metal ions because we didn’t do any special treatment on the prepared adsorbents, like ion imprinting. Therefore, the preferential adsorption of specific metal ions depends entirely on the properties of carboxymethyl chitosan.
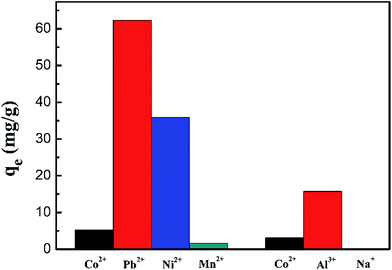 |
| | Fig. 13 Adsorption capacity of Co(II) onto the PCMC beads in the presence of competitive metal ions. | |
Table 7 Distribution coefficient and competitive coefficient data of the PCMC beads
| Metal type |
PCMC beads |
| Kd (mL g−1) |
k |
| Co2+ |
22.99 |
— |
| Pb2+ |
564.76 |
0.0407 |
| Ni2+ |
218.24 |
0.1053 |
| Mn2+ |
6.87 |
3.3445 |
| Co2+ |
13.57 |
— |
| Al3+ |
87.69 |
0.1548 |
| Na+ |
— |
— |
Fig. 13 shows the adsorption capacity of the PCMC beads for each metal ion. From Fig. 13, we can clearly see that the adsorbent first adsorbs Pb2+ and Al3+ with the same and different charges, respectively. Also, the adsorbent hardly removes Na+. The distribution coefficients (Kd) and selectivity coefficients (k) of these metal ions are summarized in Table 7. By comparing the Kd and k values for these metal ions, we also could get the above conclusion in a quantitative way.
According to the results of the competitive adsorption experiments, the adsorbent has poor adsorption capacity of Co(II) in the mixed metal ion solution. Hence the preparation of adsorbents for selective adsorption of cobalt ions is the direction of our efforts.
3.8 Adsorption mechanism
3.8.1 Infrared spectra analysis. To illustrate the adsorption mechanism of Co(II) by the PCMC beads, the FTIR spectra of the PCMC beads before (a) and after (b) adsorption of Co(II) ions were obtained and are shown in Fig. 14. By comparing the FTIR spectra in Fig. 14a and b, it was observed that the characteristic peaks at around 3421 and 1067 cm−1, assigned to the N–H and O–H stretching vibrations, respectively, both shifted to lower wavenumbers. These changes after the adsorption of Co(II) onto the PCMC beads suggest that the Co(II) may coordinate with the nitrogen atoms in the amino groups and with the oxygen atoms in the hydroxyl groups on the PCMC beads. Furthermore, the peaks at 1593 and 1420 cm−1, assigned to the asymmetric and symmetric stretching vibrations of COO−, changed to 1600 and 1409 cm−1, respectively, demonstrating that the carboxyl groups were also involved in the adsorption process.
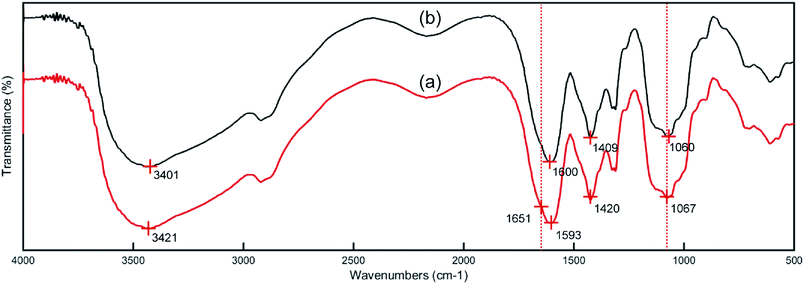 |
| | Fig. 14 FTIR spectra of the PCMC beads before (a) and after (b) Co(II) adsorption. | |
3.8.2 XPS study. To further confirm the discoveries from the FTIR spectra, XPS was also used to analyze the interactions between the adsorbate and adsorbent. Fig. 15a shows the XPS survey spectra of the PCMC beads before and after Co(II) adsorption. In the spectrum of the PCMC beads after Co(II) adsorption, a strong Co 2p peak appears at about 800 eV, and this confirmed that Co(II) was adsorbed on the PCMC beads. The XPS spectrum of Co 2p after Co(II) adsorption by the PCMC beads is shown in Fig. 15b and the binding energies (BEs) of C 1s, O 1s, N 1s, Co 2p1/2 and Co 2p3/2 obtained from the XPS spectra of the PCMC beads are listed in Table 8. It was observed that the peaks for Co 2p3/2 and Co 2p1/2 were at 781.6 and 785.4 eV and 797.3 and 802.2 eV, respectively. After the Co(II) adsorption process, the BE of one peak for Co 2p3/2 decreased, in contrast with the XPS data of CoCl2·6H2O obtained by Ivanova et al.,56 where the BE was 782.9 eV. It was suggested that the cobalt ion receives an electron from other atoms like oxygen or nitrogen in the PCMC beads, leading to an increase in the electronic density. Thus, these observed findings have proven the existence of the chelation between the PCMC beads and cobalt ions during the adsorption process.
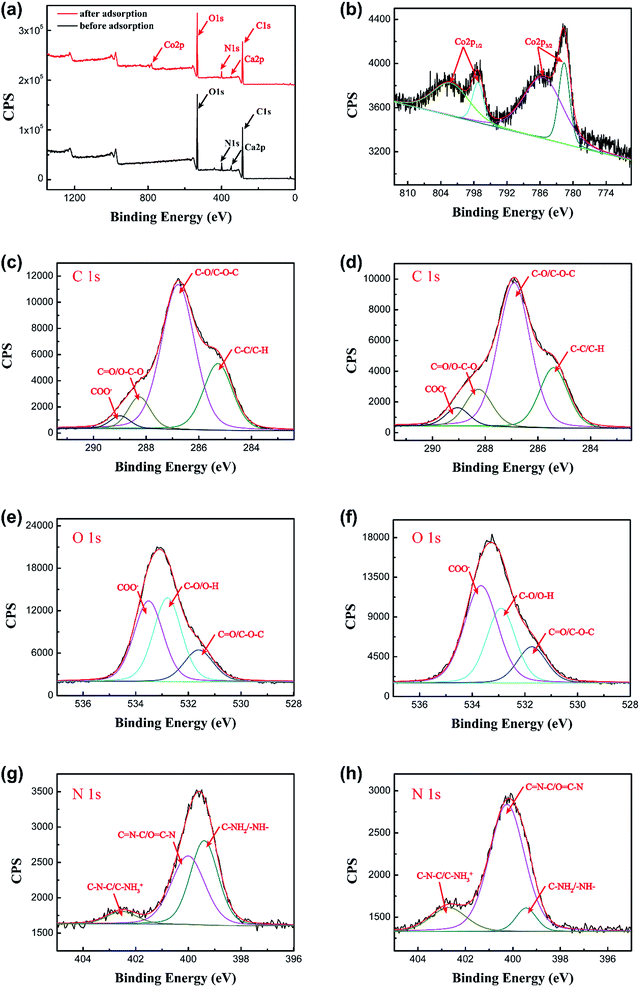 |
| | Fig. 15 (a) XPS spectra for the PCMC beads before and after Co(II) adsorption, and (b) the Co 2p spectrum of the PCMC beads after Co(II) adsorption. XPS spectra of C 1s, O 1s and N 1s before ((c), (e), and (g)) and after ((d), (f), and (h)) Co(II) adsorption of the PCMC beads. | |
Table 8 Binding energies (BEs) of C 1s, O 1s, N 1s, Co 2p3/2 and Co 2p1/2 obtained from the XPS spectra of the PCMC beads before and after Co(II) adsorption
| Elements |
PCMC bead BE (eV) |
Adsorbed PCMC bead BE (eV) |
Assignments |
| C 1s |
284.9 |
284.9 |
C–C or C–H |
| 286.4 |
286.4 |
C–O or C–O–C |
| 287.8 |
287.8 |
C![[double bond, length as m-dash]](https://www.rsc.org/images/entities/char_e001.gif) O or O–C–O O or O–C–O |
| 288.6 |
288.6 |
COO− |
| O 1s |
531.6 |
531.7 |
C![[double bond, length as m-dash]](https://www.rsc.org/images/entities/char_e001.gif) O or C–O–C O or C–O–C |
| 532.8 |
532.9 |
C–O or O–H |
| 533.5 |
533.7 |
COO− |
| N 1s |
399.4 |
399.5 |
C–NH2 or –NH– |
| 400.0 |
400.3 |
C![[double bond, length as m-dash]](https://www.rsc.org/images/entities/char_e001.gif) N–C or O N–C or O![[double bond, length as m-dash]](https://www.rsc.org/images/entities/char_e001.gif) C–N C–N |
| 402.5 |
402.7 |
C–N–C or C–NH3+ |
| Co 2p3/2 |
— |
781.6 |
Co(0) or Co(I) |
| — |
785.4 |
Co(II) |
| Co 2p1/2 |
— |
797.3 |
Co(0) or Co(I) |
| — |
802.2 |
Co(II) |
Fig. 15c–h show the high resolution spectra of C 1s, O 1s and N 1s of the PCMC beads before and after Co(II) adsorption. As can be seen from Fig. 15c and d, the BEs of the four peaks from the C 1s spectrum were 284.9, 286.4, 287.8 and 288.6 eV, which can be assigned to C–C (aromatic), C–O (alcoholic hydroxyl and ether), C![[double bond, length as m-dash]](https://www.rsc.org/images/entities/char_e001.gif) O (carbonyl) and COO− (carboxyl and ester), respectively.57 Obviously, the C 1s XPS spectra show no significant changes to the PCMC beads before and after Co(II) adsorption, demonstrating that cobalt ions don’t coordinate with the C atoms during the adsorption process. After comparing the O 1s XPS spectra of the PCMC beads before and after Co(II) adsorption from Fig. 15e and f, it was suggested that the three individual component peaks of the O 1s spectrum at 531.6, 532.8 and 533.5 eV, which were assigned to the C
O (carbonyl) and COO− (carboxyl and ester), respectively.57 Obviously, the C 1s XPS spectra show no significant changes to the PCMC beads before and after Co(II) adsorption, demonstrating that cobalt ions don’t coordinate with the C atoms during the adsorption process. After comparing the O 1s XPS spectra of the PCMC beads before and after Co(II) adsorption from Fig. 15e and f, it was suggested that the three individual component peaks of the O 1s spectrum at 531.6, 532.8 and 533.5 eV, which were assigned to the C![[double bond, length as m-dash]](https://www.rsc.org/images/entities/char_e001.gif) O, C–O and COO− functional groups, respectively, were shifted in binding energy after Co(II) adsorption. These changes may have resulted from the chelation between cobalt ions and the oxygen atoms, leading to the decrease of its electron density. In addition, from Fig. 15g and h, it was observed that there were three peaks at 399.4, 400.0, and 402.5 eV before Co(II) adsorption, which were attributed to C–NH2 or –NH–, C
O, C–O and COO− functional groups, respectively, were shifted in binding energy after Co(II) adsorption. These changes may have resulted from the chelation between cobalt ions and the oxygen atoms, leading to the decrease of its electron density. In addition, from Fig. 15g and h, it was observed that there were three peaks at 399.4, 400.0, and 402.5 eV before Co(II) adsorption, which were attributed to C–NH2 or –NH–, C![[double bond, length as m-dash]](https://www.rsc.org/images/entities/char_e001.gif) N–C or O
N–C or O![[double bond, length as m-dash]](https://www.rsc.org/images/entities/char_e001.gif) C–N and C–N–C or C–NH3+, respectively. Nevertheless, the peaks were moved to 399.5, 400.3 and 402.7 eV after the adsorption of Co(II) and similar findings have been reported by Chen et al.52 This confirmed that the cobalt ions bind onto the N atoms during Co(II) adsorption, and that the shared bond between the N atom and the Co(II) consists of a lone pair of electrons that are donated from the nitrogen atoms. Hence, the XPS analysis results proved that the oxygen atoms of the hydroxyl and carboxyl groups and the nitrogen atoms of the amino groups may be involved in the adsorption reaction, which is in accord with the FTIR results.
C–N and C–N–C or C–NH3+, respectively. Nevertheless, the peaks were moved to 399.5, 400.3 and 402.7 eV after the adsorption of Co(II) and similar findings have been reported by Chen et al.52 This confirmed that the cobalt ions bind onto the N atoms during Co(II) adsorption, and that the shared bond between the N atom and the Co(II) consists of a lone pair of electrons that are donated from the nitrogen atoms. Hence, the XPS analysis results proved that the oxygen atoms of the hydroxyl and carboxyl groups and the nitrogen atoms of the amino groups may be involved in the adsorption reaction, which is in accord with the FTIR results.
3.8.3 Adsorption mechanism. On the basis of the kinetic, FTIR and XPS analysis results, it was demonstrated that the Co(II) adsorption process of the PCMC beads is a chemical reaction between the cobalt ions and the functional groups including hydroxyl, amino and carboxyl groups. Moreover, the adsorption isotherm experimental data of the PCMC beads were better fitted by the Langmuir model, and this revealed that monolayer adsorption occurred on the surface of the PCMC beads with a finite number of adsorption sites. Nonetheless, the decrease of the KL value reflected that physical adsorption may also take place in the process of Co(II) adsorption. Consequently, the possible adsorption mechanism of Co(II) removal by the PCMC beads is shown in Fig. 16. As shown in Fig. 16, for the Co(II) adsorption process by the PCMC beads, physical, chemical and electrostatic adsorption occurs according to the adsorption kinetics, isotherm and microstructure analysis, and chemical reaction was dominant in the adsorption process.
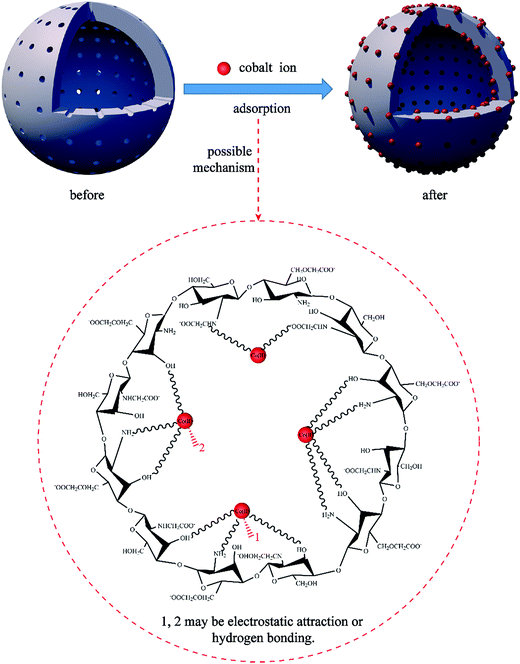 |
| | Fig. 16 Possible mechanism for Co(II) adsorption by the PCMC beads. | |
3.9 Desorption and re-adsorption performance
It is generally accepted that reusability is one of the essential factors to evaluate a new adsorbent. Fig. 17 shows the results of the adsorption capacity after 5 cycles of adsorption–desorption with the PCMC beads for the removal of Co(II). It was observed that the adsorption capacity slightly decreased with increasing cycle time and showed no obvious loss, indicating that the adsorbent was a promising material with good reusability for the removal of cobalt from wastewater.
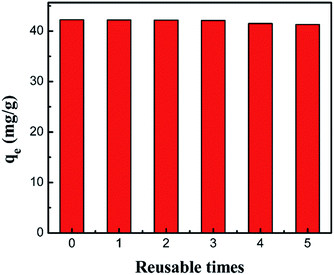 |
| | Fig. 17 Regeneration of the PCMC beads (0.05 g adsorbent, 25 mL 200 mg L−1 cobalt solution, pH 6.0). | |
4. Conclusion
In this study, an adsorbent for the fast removal of Co(II) was successfully prepared using carboxymethyl chitosan (CMC) and polyethylene glycol (PEG) through blending and cross-linking. The maximum adsorption capacity of the PCMC beads for Co(II) was 46.25 mg g−1 at pH 6.0 and at 30 °C. The adsorption equilibrium was obtained at about 6 h. Adsorption of Co(II) onto the PCMC beads followed the pseudo-second-order kinetic model, and this revealed that chemical adsorption was the rate-limiting step rather than mass transport. The Langmuir isotherm was more suitable for describing the adsorption process of the PCMC beads, which indicated that it was mainly monolayer adsorption. The results of the TGA and mechanical strength tests showed its good thermostability and well-defined mechanical properties. BET and SEM analysis revealed that the new adsorbent possessed a large specific surface area and irregular porous morphology. The FTIR and XPS results illustrated that the adsorption of Co(II) by the PCMC beads was chemical chelation between the cobalt ions and functional groups including hydroxyl, amino and carboxyl groups, and that this may also be alongside physical adsorption. Furthermore, the PCMC beads still showed good adsorption performance after five cycles of regeneration. Overall, the PCMC beads are a promising adsorbent for fast removal of Co(II) from aqueous solution.
Conflicts of interest
There are no conflicts to declare.
Acknowledgements
This work was supported by the National Basic Research Program of China (973 Program, 2014CB748500), the National Natural Science Foundation of China (51406057, 51578239, and 51322805) and the Joint fund of the equipment pre Research Ministry of Education (6141A02033204).
References
- V. Dhanapal and K. Subramanian, Carbohydr. Polym., 2015, 117, 123 CrossRef CAS PubMed.
- L. Fan, C. Luo, Z. Lv, F. Lu and H. Qiu, Colloids Surf., B, 2011, 88, 574 CrossRef CAS PubMed.
- S. A. Sadeek, N. A. Negm, H. H. H. Hefni and M. M. A. Wahab, Int. J. Biol. Macromol., 2015, 81, 400 CrossRef CAS PubMed.
- M. Abbas, S. Kaddour and M. Trari, J. Ind. Eng. Chem., 2014, 20, 745 CrossRef CAS.
- G. Klug, Mol. Microbiol., 2014, 91, 635 CrossRef CAS PubMed.
- S. Rengaraj and S. H. Moon, Water Res., 2002, 36, 1783 CrossRef CAS PubMed.
- S. Mauchauffée and E. Meux, Chemosphere, 2007, 69, 763 CrossRef PubMed.
- V. Verma, S. Tewari and J. Rai, Bioresour. Technol., 2008, 99, 1932 CrossRef CAS PubMed.
- M. Mohsen-Nia, P. Montazeri and H. Modarress, Desalination, 2007, 217, 276 CrossRef CAS.
- H. Liu and C. Wang, RSC Adv., 2013, 4, 3864 RSC.
- C. Y. Chen, C. Y. Yang and A. H. Chen, J. Environ. Manage., 2011, 92, 796 CrossRef CAS PubMed.
- H. Ren, Z. Gao, D. Wu, J. Jiang, Y. Sun and C. Luo, Carbohydr. Polym., 2016, 137, 402 CrossRef CAS PubMed.
- S. Noor, M. Waseem, U. Rashid, M. Anis-ur-Rehman, W. Rehman and K. Mahmood, Chin. Chem. Lett., 2014, 25, 819 CrossRef CAS.
- B. Xiang, W. Fan, X. Yi, Z. Wang, F. Gao, Y. Li and H. Gu, Carbohydr. Polym., 2016, 136, 30 CrossRef CAS PubMed.
- Ä. Sargäın, G. Arslan and M. Kaya, Carbohydr. Polym., 2016, 138, 201 CrossRef PubMed.
- T. Feng and L. Xu, RSC Adv., 2013, 3, 21685 RSC.
- Z. Liu, H. Bai and D. D. Sun, New J. Chem., 2011, 35, 137 RSC.
- L. Tan, J. Xu, X. Xue, Z. Lou, J. Zhu, S. Baig and X. Xu, RSC Adv., 2014, 4, 45920 RSC.
- J. Wang and C. Chen, Bioresour. Technol., 2014, 160, 129 CrossRef CAS PubMed.
- R. K. Upadhyay, N. Soin and S. S. Roy, J. Cheminf., 2014, 45, 3823 Search PubMed.
- K. Kurita, Prog. Polym. Sci., 2001, 26, 1921 CrossRef CAS.
- N. K. Patel and V. K. Sinha, Int. J. Polym. Mater. Polym. Biomater., 2009, 58, 548 CrossRef CAS.
- H. C. Jian, P. L. Guo, Q. L. Liu, C. N. Jian, B. W. Wen and M. L. Jin, Chem. Eng. J., 2010, 165, 465 CrossRef.
- B. Mandal and S. K. Ray, Carbohydr. Polym., 2013, 98, 257 CrossRef CAS PubMed.
- Y. H. Lin, H. C. Liang, M. C. Chen and H. W. Sung, Biomaterials, 2005, 26, 2105 CrossRef CAS PubMed.
- S. Sun and A. Wang, J. Hazard. Mater., 2006, 131, 103 CrossRef CAS PubMed.
- C. Wang, Q. Song and J. Gao, Water Sci. Technol., 2013, 68, 1873 CrossRef CAS PubMed.
- M. Zhang, Y. Zhang and R. Helleur, Chem.
Eng. J., 2015, 264, 56 CrossRef CAS.
- Q. Song, C. Wang, Z. Zhang and J. Gao, Sep. Sci. Technol., 2014, 49, 1235 CrossRef CAS.
- L. Nan and R. Bai, Sep. Purif. Technol., 2005, 42, 237 CrossRef.
- C. Peniche, M. Fernández, A. Gallardo, A. López-Bravo and J. S. Román, Macromol. Biosci., 2003, 3, 540 CrossRef CAS.
- Y. Zheng, D. Huang and A. Wang, Anal. Chim. Acta, 2011, 687, 193 CrossRef CAS PubMed.
- M. Zeng, X. Zhang, L. Shao, C. Qi and X. M. Zhang, J. Organomet. Chem., 2012, 704, 29 CrossRef CAS.
- H. Zhao, J. Xu, W. Lan, T. Wang and G. Luo, Chem. Eng. J., 2013, 229, 82 CrossRef CAS.
- W. S. W. Ngah and S. Fatinathan, Chem. Eng. J., 2008, 143, 62 CrossRef CAS.
- W. S. W. Ngah, S. A. Ghani and A. Kamari, Bioresour. Technol., 2005, 96, 443 CrossRef PubMed.
- A. Shekhawat, S. Kahu, D. Saravanan and R. Jugade, Carbohydr. Polym., 2017, 172, 205 CrossRef CAS PubMed.
- H. Cui, J. Chen, H. Yang, W. Wang, Y. Liu, D. Zou, W. Liu and G. Men, Chem. Eng. J., 2013, 232, 372 CrossRef CAS.
- C. Tempfer and E. Kubista, Macromol. Res., 2008, 16, 492 CrossRef.
- K. Azlan, N. Saime and L. Lai Ken, J. Environ. Sci., 2009, 21, 296 CrossRef CAS.
- L. Pivarčiová, O. Rosskopfová, M. Galamboš, P. Rajec and P. Hudec, J. Radioanal. Nucl. Chem., 2016, 308, 93 CrossRef.
- A. Rajeswari, A. Amalraj and A. Pius, Journal of Water Process Engineering, 2016, 9, 123 CrossRef.
- E. Zheng, Q. Dang, C. Liu, B. Fan, J. Yan, Z. Yu and H. Zhang, Colloids Surf., A, 2016, 502, 34 CrossRef CAS.
- K. J. Osvaldo, G. Leandroviníciusalves, F. Rossimiriampereirade and G. Laurentfrédéric, Carbohydr. Polym., 2009, 77, 643 CrossRef.
- R. S. Juang and H. J. Shao, Adsorption, 2002, 8, 71 CrossRef CAS.
- Y. A. Aydın and N. D. Aksoy, Chem. Eng. J., 2009, 151, 188 CrossRef.
- M. Hasan, A. L. Ahmad and B. H. Hameed, Chem. Eng. J., 2008, 136, 164 CrossRef CAS.
- S. P. Kuang, Z. Z. Wang, J. Liu and Z. C. Wu, J. Hazard. Mater., 2013, 260, 210 CrossRef CAS PubMed.
- C. Septhum, S. Rattanaphani, J. B. Bremner and V. J. Rattanaphani, J. Hazard. Mater., 2007, 148, 185 CrossRef CAS PubMed.
- P. A. Nishad, A. Bhaskarapillai, S. Velmurugan and S. V. Narasimhan, Carbohydr. Polym., 2012, 87, 2690 CrossRef.
- Y. Zhu, J. Hu and J. Wang, Prog. Nucl. Energy, 2014, 71, 172 CrossRef CAS.
- Y. Chen and J. Wang, Nucl. Eng. Des., 2012, 242, 452 CrossRef CAS.
- Y. Liu, J. Gao, C. Li, J. Pan, Y. Yan and J. Xie, Chin. J. Chem., 2010, 28, 548 CrossRef CAS.
- J. Pan, W. Guan, Z. Zhang, X. Wang, C. Li and Y. Yan, Chin. J. Chem., 2011, 28, 2483 CrossRef.
- E. Repo, J. K. Warchol, T. A. Kurniawan and M. E. T. Sillanpää, Chem. Eng. J., 2010, 161, 73 CrossRef CAS.
- T. Ivanova, A. Naumkin, A. Sidorov, I. Eremenko and M. Kiskin, J. Electron Spectrosc. Relat. Phenom., 2007, 156–158, 200 CrossRef CAS.
- J. C. Zheng, H. M. Feng, M. H. Lam, P. K. Lam, Y. W. Ding and H. Q. Yu, J. Hazard. Mater., 2009, 171, 780 CrossRef CAS PubMed.
|
| This journal is © The Royal Society of Chemistry 2018 |
Click here to see how this site uses Cookies. View our privacy policy here.  Open Access Article
 * and
Yong Zhu
![[thin space (1/6-em)]](https://www.rsc.org/images/entities/char_2009.gif) 000 and a viscosity of 20 cps) was supplied by Aladdin Industrial Co., Ltd, Shanghai, China. PEG-2000 (average molecular mass ca. 1800–2200) was selected as the porogen to prepare the porous structure. CaCl2 was provided by Titan Chemical Technology Co., Ltd, Shanghai, China. Glutaraldehyde (Lingfeng Chemical Co., Ltd., Shanghai, China) was utilized as a crosslinking reagent for solidification. CoCl2·6H2O, HCl, NaOH, and ethanol were purchased from Chinese Medicine Group Chemical Reagent Co., Ltd (Shanghai, China). Co(II) stock solution (1000 mg L−1) was prepared by dissolving cobalt chloride in deionized water and then diluting to the required initial concentrations. 0.1 mol L−1 HCl and 0.1 mol L−1 NaOH were used to adjust the pH value of the working solutions. All chemicals used in this study were of analytical reagent grade.
000 and a viscosity of 20 cps) was supplied by Aladdin Industrial Co., Ltd, Shanghai, China. PEG-2000 (average molecular mass ca. 1800–2200) was selected as the porogen to prepare the porous structure. CaCl2 was provided by Titan Chemical Technology Co., Ltd, Shanghai, China. Glutaraldehyde (Lingfeng Chemical Co., Ltd., Shanghai, China) was utilized as a crosslinking reagent for solidification. CoCl2·6H2O, HCl, NaOH, and ethanol were purchased from Chinese Medicine Group Chemical Reagent Co., Ltd (Shanghai, China). Co(II) stock solution (1000 mg L−1) was prepared by dissolving cobalt chloride in deionized water and then diluting to the required initial concentrations. 0.1 mol L−1 HCl and 0.1 mol L−1 NaOH were used to adjust the pH value of the working solutions. All chemicals used in this study were of analytical reagent grade.


![[thin space (1/6-em)]](https://www.rsc.org/images/entities/char_2009.gif) :
:![[thin space (1/6-em)]](https://www.rsc.org/images/entities/char_2009.gif) PEG = 5
PEG = 5![[thin space (1/6-em)]](https://www.rsc.org/images/entities/char_2009.gif) :
:![[thin space (1/6-em)]](https://www.rsc.org/images/entities/char_2009.gif) 3), the adsorption capacity for Co(II) was the best.
3), the adsorption capacity for Co(II) was the best.
![[thin space (1/6-em)]](https://www.rsc.org/images/entities/char_2009.gif) :
:![[thin space (1/6-em)]](https://www.rsc.org/images/entities/char_2009.gif) PEG = 5
PEG = 5![[thin space (1/6-em)]](https://www.rsc.org/images/entities/char_2009.gif) :
:![[thin space (1/6-em)]](https://www.rsc.org/images/entities/char_2009.gif) 3 and 1 h crosslinking time were found to be superior to the other beads. As a result, the following adsorption experiments were all based on the PCMC beads with the above preparation conditions.
3 and 1 h crosslinking time were found to be superior to the other beads. As a result, the following adsorption experiments were all based on the PCMC beads with the above preparation conditions.![[double bond, length as m-dash]](https://www.rsc.org/images/entities/char_e001.gif) N linkage derived from the Schiff base, and this clearly indicates that the crosslinking reaction with glutaraldehyde occurred on the amine groups in CMC. The asymmetric (1605 cm−1) and symmetric (1425 cm−1) stretching vibrations of the COO− group were shifted to 1593 and 1420 cm−1, respectively, due to the ionic interaction between the carboxylic groups and the calcium ions. The wavenumber at 1078 cm−1 that was assigned to the C–OH stretching vibration moved to 1067 cm−1, possibly suggesting that C–OH may participate in the crosslinking reaction.
N linkage derived from the Schiff base, and this clearly indicates that the crosslinking reaction with glutaraldehyde occurred on the amine groups in CMC. The asymmetric (1605 cm−1) and symmetric (1425 cm−1) stretching vibrations of the COO− group were shifted to 1593 and 1420 cm−1, respectively, due to the ionic interaction between the carboxylic groups and the calcium ions. The wavenumber at 1078 cm−1 that was assigned to the C–OH stretching vibration moved to 1067 cm−1, possibly suggesting that C–OH may participate in the crosslinking reaction.


![[thin space (1/6-em)]](https://www.rsc.org/images/entities/char_2009.gif) KD and 1/T for Co(II) adsorption of the PCMC beads.
KD and 1/T for Co(II) adsorption of the PCMC beads.![[thin space (1/6-em)]](https://www.rsc.org/images/entities/char_2009.gif) ln
ln![[thin space (1/6-em)]](https://www.rsc.org/images/entities/char_2009.gif) KD
KD


![[double bond, length as m-dash]](https://www.rsc.org/images/entities/char_e001.gif) O or O–C–O
O or O–C–O![[double bond, length as m-dash]](https://www.rsc.org/images/entities/char_e001.gif) O or C–O–C
O or C–O–C![[double bond, length as m-dash]](https://www.rsc.org/images/entities/char_e001.gif) N–C or O
N–C or O![[double bond, length as m-dash]](https://www.rsc.org/images/entities/char_e001.gif) C–N
C–N![[double bond, length as m-dash]](https://www.rsc.org/images/entities/char_e001.gif) O (carbonyl) and COO− (carboxyl and ester), respectively.57 Obviously, the C 1s XPS spectra show no significant changes to the PCMC beads before and after Co(II) adsorption, demonstrating that cobalt ions don’t coordinate with the C atoms during the adsorption process. After comparing the O 1s XPS spectra of the PCMC beads before and after Co(II) adsorption from Fig. 15e and f, it was suggested that the three individual component peaks of the O 1s spectrum at 531.6, 532.8 and 533.5 eV, which were assigned to the C
O (carbonyl) and COO− (carboxyl and ester), respectively.57 Obviously, the C 1s XPS spectra show no significant changes to the PCMC beads before and after Co(II) adsorption, demonstrating that cobalt ions don’t coordinate with the C atoms during the adsorption process. After comparing the O 1s XPS spectra of the PCMC beads before and after Co(II) adsorption from Fig. 15e and f, it was suggested that the three individual component peaks of the O 1s spectrum at 531.6, 532.8 and 533.5 eV, which were assigned to the C![[double bond, length as m-dash]](https://www.rsc.org/images/entities/char_e001.gif) O, C–O and COO− functional groups, respectively, were shifted in binding energy after Co(II) adsorption. These changes may have resulted from the chelation between cobalt ions and the oxygen atoms, leading to the decrease of its electron density. In addition, from Fig. 15g and h, it was observed that there were three peaks at 399.4, 400.0, and 402.5 eV before Co(II) adsorption, which were attributed to C–NH2 or –NH–, C
O, C–O and COO− functional groups, respectively, were shifted in binding energy after Co(II) adsorption. These changes may have resulted from the chelation between cobalt ions and the oxygen atoms, leading to the decrease of its electron density. In addition, from Fig. 15g and h, it was observed that there were three peaks at 399.4, 400.0, and 402.5 eV before Co(II) adsorption, which were attributed to C–NH2 or –NH–, C![[double bond, length as m-dash]](https://www.rsc.org/images/entities/char_e001.gif) N–C or O
N–C or O![[double bond, length as m-dash]](https://www.rsc.org/images/entities/char_e001.gif) C–N and C–N–C or C–NH3+, respectively. Nevertheless, the peaks were moved to 399.5, 400.3 and 402.7 eV after the adsorption of Co(II) and similar findings have been reported by Chen et al.52 This confirmed that the cobalt ions bind onto the N atoms during Co(II) adsorption, and that the shared bond between the N atom and the Co(II) consists of a lone pair of electrons that are donated from the nitrogen atoms. Hence, the XPS analysis results proved that the oxygen atoms of the hydroxyl and carboxyl groups and the nitrogen atoms of the amino groups may be involved in the adsorption reaction, which is in accord with the FTIR results.
C–N and C–N–C or C–NH3+, respectively. Nevertheless, the peaks were moved to 399.5, 400.3 and 402.7 eV after the adsorption of Co(II) and similar findings have been reported by Chen et al.52 This confirmed that the cobalt ions bind onto the N atoms during Co(II) adsorption, and that the shared bond between the N atom and the Co(II) consists of a lone pair of electrons that are donated from the nitrogen atoms. Hence, the XPS analysis results proved that the oxygen atoms of the hydroxyl and carboxyl groups and the nitrogen atoms of the amino groups may be involved in the adsorption reaction, which is in accord with the FTIR results.


