DOI:
10.1039/C8NJ04849E
(Paper)
New J. Chem., 2019,
43, 463-473
Fabrication of 2D heterojunction photocatalyst Co-g-C3N4/MoS2 with enhanced solar-light-driven photocatalytic activity
Received
25th September 2018
, Accepted 21st November 2018
First published on 22nd November 2018
Abstract
A novel 2D heterojunction composite photocatalyst Co-g-C3N4/MoS2 obtained by coupling Co-doped g-C3N4 and MoS2 nanosheets has been successfully fabricated via a facile impregnation and calcination method. The results of photocatalytic experiments showed that the as-prepared catalyst exhibited markedly enhanced photocatalytic activity. The rates for the degradation of rhodamine B (RhB) and hydrogen evolution under simulated sunlight irradiation using a catalyst were about 6.4 and 4.7 times higher than those of pristine g-C3N4. Moreover, the photocatalytic activity of the as-prepared product was compared with that of the 2D heterojunction g-C3N4/MoS2 or Co-doped g-C3N4 only. It was revealed that the photocatalytic activity of Co-g-C3N4/MoS2 was better than those of g-C3N4/MoS2 and Co-g-C3N4. The great improvement in photocatalytic activity performance is mainly ascribed to the Co-doping and formation of a 2D heterojunction, resulting in a fast charge carrier transfer, effective suppression of recombination of charge carriers, and an increase of light absorption. The doping amount of cobalt and the loading amount of MoS2 have a great influence on the photocatalytic activity of g-C3N4, and they were studied in detail. The present work reveals that the combination of the formed-2D heterojunction with Co-doping should be a good strategy to boost the solar-light-driven photocatalytic activity of semiconductor catalysts.
1. Introduction
Recently, the photocatalytic activity of polymer g-C3N4 has become a focus of attention owing to its excellent properties, such as exhibiting a visible-light response, being metal-free, and having chemical and thermal stabilities. Moreover, g-C3N4 is a cost-effective and environmentally friendly photocatalyst since it is mainly composed of earth-abundant elements (C and N) and can be easily synthesized from cheap precursors such as urea, dicyanamide, melamine and thiourea via thermal condensation at an appropriate temperature.1–3 Therefore, g-C3N4 is considered as a promising visible light-responsive semiconductor photocatalyst, which can play an important role in the fields of photocatalysis, photoelectron apparatus and chemical sensors.4–6 However, as with many other photocatalysts, the use of g-C3N4 alone is still hampered by its intrinsic drawbacks, such as a small specific surface area, limited visible light utilization due to its weak absorption above 460 nm, and low efficiency of photogenerated electron–hole separation.7,8 Up to now, numerous strategies have been proposed to address these problems, such as exfoliation into thin nanosheets, element doping, copolymerization, noble metal deposition, supermolecular assembly, and designing heterojunction composites.9–15 Among these strategies, heterogeneous coupling is considered to be an efficient strategy that can restrain the recombination of photogenerated electrons and holes substantially.16 There are already various semiconductors, such as TiO2, CdS, ZnO, WO3, MoS2, etc., which have been used to construct heterojunctions.17–26 Among them, MoS2 is one of the most ideal choices owing to its two-dimensional semiconducting properties wherein a two-dimensional layered structure and a two-dimensional heterojunction can provide a higher charge mobility.26,27 Moreover, MoS2 has a well-matched band position with g-C3N4.28 Some efforts have been made to prepare MoS2/g-C3N4 composite photocatalysts.29–31 However, even after constructing this kind of heterojunction, as reported in the literature, improvement in the photocatalytic activity of g-C3N4 is still limited.32 The probable reason is that the photogenerated electrons and holes that are not consumed will accumulate in the catalyst leading to inhibition of their separation. On the other hand, the photogenerated electrons and holes that cannot be transferred in time will recombine, resulting in the decrease of photocatalytic activity.33 Therefore, this challenge demands a new strategy to solve this problem.
Some research studies have reported that some metals can bind with or intercalate into the matrix of g-C3N4, which provides a facile method to fine tune the structure and reactivity of g-C3N4.34,35 Particularly, transition metal atoms (such as Co) can be trapped by the rich pyridine-like nitrogen in g-C3N4 to form potential active sites for photocatalysis.36–38 Cobalt can homogeneously incorporate into the framework of g-C3N4 to form potential sites, which speeds the transfer rate of charge carriers and thus boosts the photocatalytic activity of g-C3N4.36–38
In this study, we succeeded in introducing cobalt into the framework of g-C3N4 and constructing 2D Co-g-C3N4/MoS2 heterojunctions by a facile impregnation and calcination method. To our knowledge, this is the first time that construction of 2D Co-g-C3N4/MoS2 heterojunctions has been achieved. The synthesized photocatalysts were characterized in detail. The photocatalytic experimental results demonstrated that the Co-g-C3N4/MoS2 heterojunction catalyst, compared with the pure g-C3N4 and common g-C3N4/MoS2 heterojunction photocatalyst, showed a remarkably enhanced performance for the degradation of rhodamine B (RhB) dye and H2 evolution under simulated sunlight irradiation.
2. Experimental
2.1 Materials
Dicyandiamide (DCD), Co(OAc)2·4H2O, ammonium molybdate tetrahydrate, thioacetamide, rhodamine B (RhB), ρ-benzoquinone, Na2EDTA, tert-butyl alcohol, triethanolamine (TEOA), platinum chloride, and anhydrous sodium sulfate were purchased from Sinopharm Chemical Regent Co., Ltd, China. Deionized water was used throughout all experiments.
2.2 Synthesis of g-C3N4 and Co-g-C3N4 nanosheets
Bulk g-C3N4 powder was synthesized according to the procedure described in a previous paper.39 In detail, dicyandiamide was placed into a covered alumina crucible and then heated in a muffle furnace at a ramping rate of 5 °C min−1 to 550 °C, and the target temperature was maintained for 4 h in static air. After being naturally cooled to room temperature, the yellow product was collected and milled into powder in a mortar.
The nanosheets of g-C3N4 were prepared by thermal oxidation etching of the bulk g-C3N4 obtained as above in static air as follows: 400 mg of the bulk g-C3N4 was placed in an open ceramic container and heated at 500 °C for 2 h at a ramping rate of 5 °C min−1. A light yellow powder of g-C3N4 nanosheets was finally obtained.
Co-g-C3N4 was synthesized by heating a mixture of dicyandiamide and cobalt acetate tetrahydrate. 4 g of dicyandiamide and a definite amount of cobalt acetate tetrahydrate were dissolved in 50 mL of deionized water and the mixture was stirred vigorously for 60 minutes. The resulting solution was then transferred to a culture dish and placed in an oven at 60 °C overnight. After this, a magenta sample was obtained, which was then calcined at 550 °C for 4 h in air at a heating rate of 5 °C min−1 to obtain the bulk Co-g-C3N4 product. The obtained bulk product was ground and placed in a crucible, which was then calcined at 500 °C for 2 h in air at a heating rate of 5 °C min−1. A light yellow powder of Co-g-C3N4 nanosheets was finally obtained. By adding different amounts of cobalt acetate tetrahydrate, Co-g-C3N4 nanosheets with different levels of Co-doping were prepared. The products with mass ratios of cobalt acetate tetrahydrate to dicyandiamide of about 0.5%, 1%, 1.25% and 2.5% were denoted as 0.5-Co-g-C3N4, 1.0-Co-g-C3N4, 1.25-Co-g-C3N4 and 2.5-Co-g-C3N4, respectively.
2.3 Synthesis of MoS2 nanosheets
In a typical procedure, 0.88 g of ammonium molybdate tetrahydrate and 0.94 g of thioacetamide were dissolved in ionized water by magnetic stirring and sonication. The mixed solution was then placed in a 100 mL autoclave, heated to 220 °C and held for 13 h. After cooling down to room temperature, the product was collected, washed several times with deionized water and ethanol, and dried in a vacuum oven at 80 °C overnight.
2.4 Synthesis of 2D heterojunction Co-g-C3N4/MoS2
The 2D heterojunction of Co-g-C3N4/MoS2 was synthesized via a facile impregnation and calcination method. Appropriate amounts of 1.25-Co-g-C3N4 and MoS2 were dispersed in ethanol respectively and sonicated for 30 min to form a colloidal solution. Then, a certain amount of MoS2 solution was added dropwise into the Co-g-C3N4 solution and stirred for 24 h, and the mixture was heated at 60 °C to remove ethanol with magnetic stirring. Finally, the product was heated at 300 °C for 3 h to further consolidate the heterojunction interface. The obtained 2D Co-g-C3N4/MoS2 heterojunction nanosheets with different MoS2 mass contents of about 1%, 3%, 5% and 10% were denoted as Co-g-C3N4/MoS2-1, Co-g-C3N4/MoS2-3, Co-g-C3N4/MoS2-5 and Co-g-C3N4/MoS2-10, respectively.
2.5 Characterization
The power X-ray diffraction (XRD) patterns were recorded using a Rigaku D/max-2500 X-ray diffractometer using Cu-Kα radiation. The transmission electron microscopy (TEM) images were recorded using a JEOL JEM-2010F at an accelerating voltage of 200 kV with an energy-dispersive X-ray (EDX) spectrometer. UV-vis absorption spectra were obtained using a Hitachi 3010 UV-3600 spectrometer (Hitachi, Japan). UV-UV-vis-NIR diffuse reflectance spectroscopy (DRS) were performed at room temperature using a Shimadzu UV-3600 spectrometer with BaSO4 as a reference. The photoluminescence (PL) spectra were obtained using a Hitachi F-4500 fluorescence spectrophotometer with an excitation wavelength of 370 nm.
2.6 Photocatalytic degradation of RhB and the detection of active species
The photocatalytic activities of the samples for the degradation of rhodamine B were tested with a Hitachi U-3010 spectrophotometer using an SGY-IB multifunction photochemical reactor (Nanjing Sidongke Electric Co. Ltd) as the photocatalytic reaction device. A 300 W xenon lamp (PL-X500D) with a wavelength distribution similar to solar light was chosen as a light source. In a typical experiment, 20 mg of the photocatalyst was suspended in a quartz cuvette containing 50 mL of RhB aqueous solution (20 mg L−1). The suspension was stirred in the dark for 30 min to establish an adsorption–desorption equilibrium between the photocatalyst and the target contaminants before irradiation. The photoreaction vessels were then exposed to simulated solar light irradiation. At regular time intervals, the photoreacted solutions were analyzed by recording the variation of the absorption band maximum (553 nm) in the UV-vis spectrum of RhB.
The degradation ratio (η) of the dye was calculated using the following equation:
| η = [(C0 − C)/C0] × 100% = [(A0 − A)/A0] × 100% |
where
C0 and
C are the initial and residual concentrations of RhB in solution, respectively, and
A0 and
A are the absorbance of RhB at 553 nm.
In addition, in order to detect the generated active species in the photocatalysis, ρ-benzoquinone (1 mM), Na2EDTA (1 mM), and tert-butyl alcohol (1 mM) were used as superoxide radical (˙O2−), photogenerated hole (h+), and hydroxyl radical (˙OH) scavengers, respectively, during the photocatalysis testing with all other conditions being the same.
2.7 Hydrogen (H2) evolution test
A photocatalytic hydrogen generation reaction was carried out in a Pyrex top-irradiation reaction vessel connected to a glass closed gas circulation system. In a typical experiment, 20 mg of the photocatalyst powder with 3 wt% Pt was dispersed in a mixture of 40 mL of deionized water and 10 mL of triethanolamine (TEOA) by sonication for 3 min. The resulting reactant dispersion was placed in a reaction vessel and stirred. The reaction system was evacuated each time for half an hour to completely remove air before irradiation. The temperature of the reactant solution during the reaction was maintained at room temperature by cooling water flow. Photocatalytic reactions were initiated by using a 300 W Xe-lamp (PLS-SXE300). The amount of H2 generated was analyzed by online GC7900 gas chromatography.
2.8 Electrochemical and photoelectrochemical measurements
The photocurrents were measured by using an electrochemical workstation (CHI660A, Chen Hua Instruments, Shanghai, China) in a standard three-electrode system, which employed a platinum wire as the counter electrode, Ag/AgCl as the reference electrode, and the as-prepared photocatalysts served as working electrodes. The photocurrent intensity of the photocatalysis was measured at 0 V with the light on and off. Na2SO4 (1 M) was used as the supporting electrolyte for photocurrent measurements. A 300 W Xe lamp was utilized as a light source. Nyquist plots were obtained over the frequency range of 100–106 Hz with an ac amplitude of 10 mV at the open circuit.
3. Results and discussion
3.1 XRD analysis
Fig. 1a shows the XRD patterns of g-C3N4, 0.5-Co-g-C3N4, 1.0-Co-g-C3N4, 1.25-Co-g-C3N4, and 2.5-Co-g-C3N4. It can be seen that the g-C3N4 nanosheets exhibit two distinct peaks at 27.5° and 12.9°. The strong peak at 27.5° corresponds to the in-plane structural packing motif and the weak peak at 12.9° corresponds to the interlayer stacking of aromatic systems, which can be indexed to the (002) and (100) diffraction planes of g-C3N4 (JCPDS 87-1526).40 After the incorporation of cobalt into the g-C3N4 network, the XRD patterns show a significant intensity decrease of the diffraction peaks, and the intensities of the diffraction peaks decrease with the increase in cobalt content. This result illustrates the inhibition of polymer condensation by cobalt doping. In addition, no peaks of cobalt, cobalt oxide, cobalt nitride, and cobalt carbide were observed in the patterns of g-C3N4, even when cobalt content increased to 2.5%. This indicates that cobalt is incorporated into the framework of g-C3N4 homogeneously. The Co species chemically coordinated to the g-C3N4 matrix, most likely in the form of Co–N bonds.41 As shown in Fig. 1b, the diffraction peaks of MoS2 at 14.2°, 33.2° and 57.3° are in good agreement with the (002), (100) and (110) planes of the hexagonal phase of MoS2 (JCPDS 37-1492).42 No apparent diffraction peaks of MoS2 can be recognized in the patterns of Co-g-C3N4/MoS2, which may be due to the low content of MoS2 and its high dispersion in the interior of g-C3N4.43 These results confirm the combination of g-C3N4 and MoS2 simultaneously without changing the phase structure of g-C3N4. The presence of MoS2 in the Co-g-C3N4/MoS2 composite can be confirmed by TEM, HRTEM and XPS analyses, as discussed later.
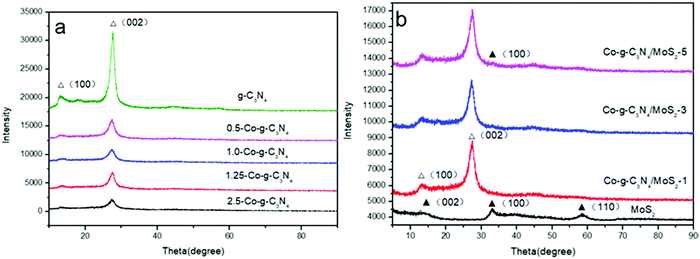 |
| | Fig. 1 XRD patterns of pure g-C3N4, Co-g-C3N4, MoS2 and Co-g-C3N4/MoS2. | |
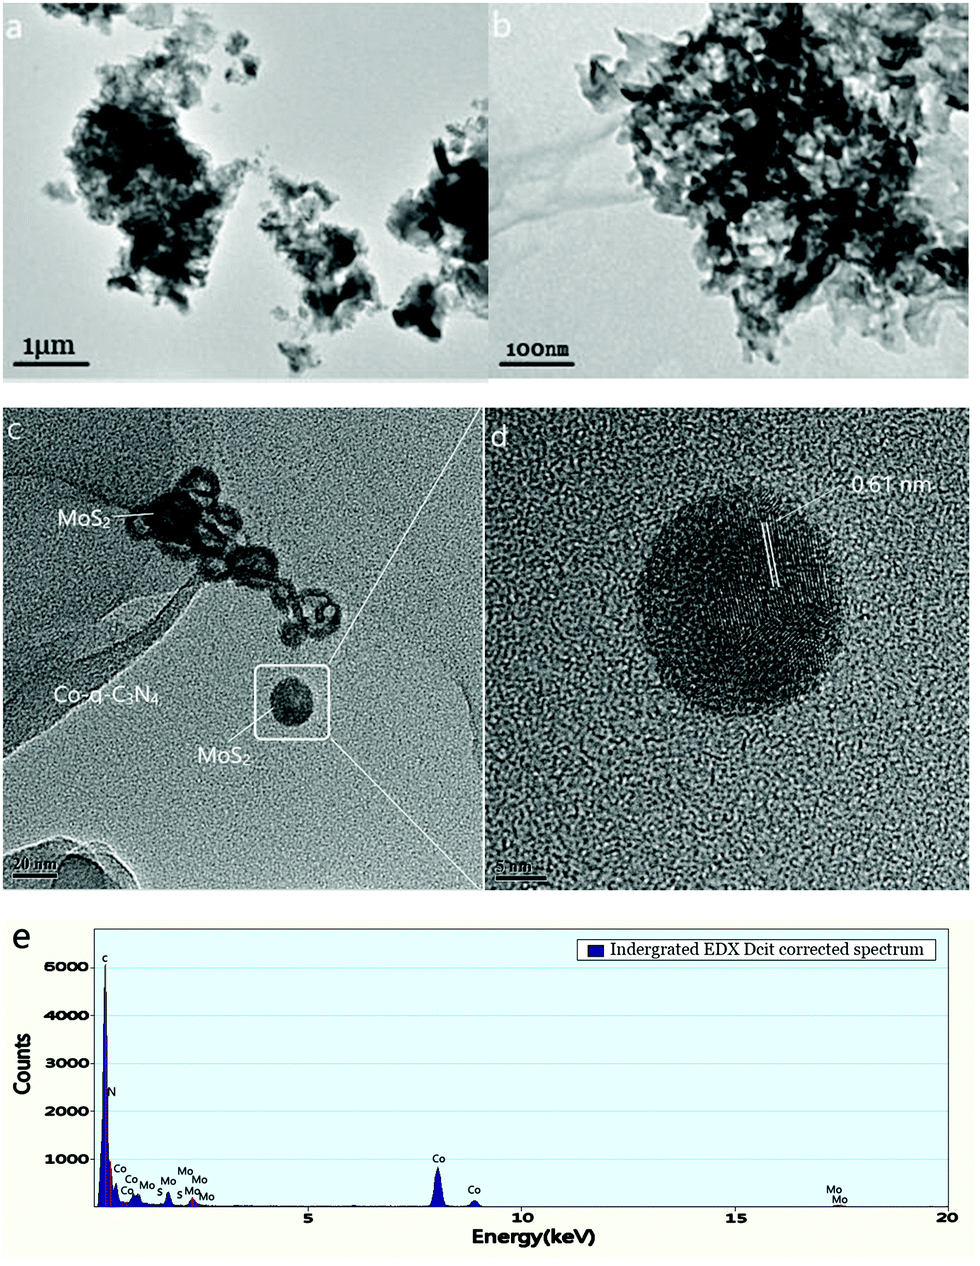
3.2 TEM and HRTEM images
The microstructures of the prepared products were examined by TEM. As shown in Fig. 2a and b, similar thin and irregular nanosheet structures were observed in both pure g-C3N4 and Co-g-C3N4. This indicates that the basic morphology did not change after Co-doping. In addition, there was no accumulation of particles on the surface of g-C3N4, indicating that the cobalt was incorporated in the framework of g-C3N4.
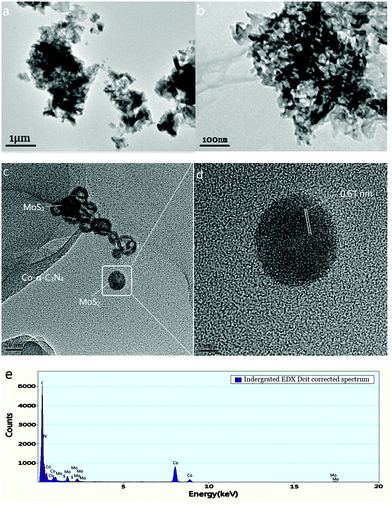 |
| | Fig. 2 TEM images of g-C3N4 (a), Co-g-C3N4 (b), and Co-g-C3N4/MoS2 (c). HRTEM images of MoS2 (d). EDS spectrum of Co-g-C3N4/MoS2 (e). | |
The TEM image of Co-g-C3N4/MoS2 (Fig. 2c) shows that MoS2 was present as irregular nanosheets or nanodots, horizontally loaded on the surface of the Co-g-C3N4 nanosheets, which formed a 2D heterojunction structure with an intimate interfacial contact. The boundaries between MoS2 and Co-g-C3N4 were clear, suggesting their intimate attachment. These results are similar to a previous report.44 It is worth mentioning that the 2D structure could effectively increase the contact area and increase the specific surface area.45Fig. 2d shows a magnified image of the area circled in Fig. 2c. As shown in Fig. 2d, the crystal lattice distance of 0.61 nm measured by HRTEM, is in agreement with the (002) planes of MoS2.28 The HRTEM images demonstrate that high-quality MoS2 nanolayers were well distributed on the surface of g-C3N4 to form the 2D heterojunction. This structure is very favorable for photocatalytic reactions. EDX spectroscopy was applied to confirm the chemical composition of the as-prepared samples. As shown in Fig. 2e, all of the elements including C, N, Co, Mo and S were detected in the composite, further confirming that the exact ingredients were desirably combined to form the Co-g-C3N4/MoS2 heterojunction.
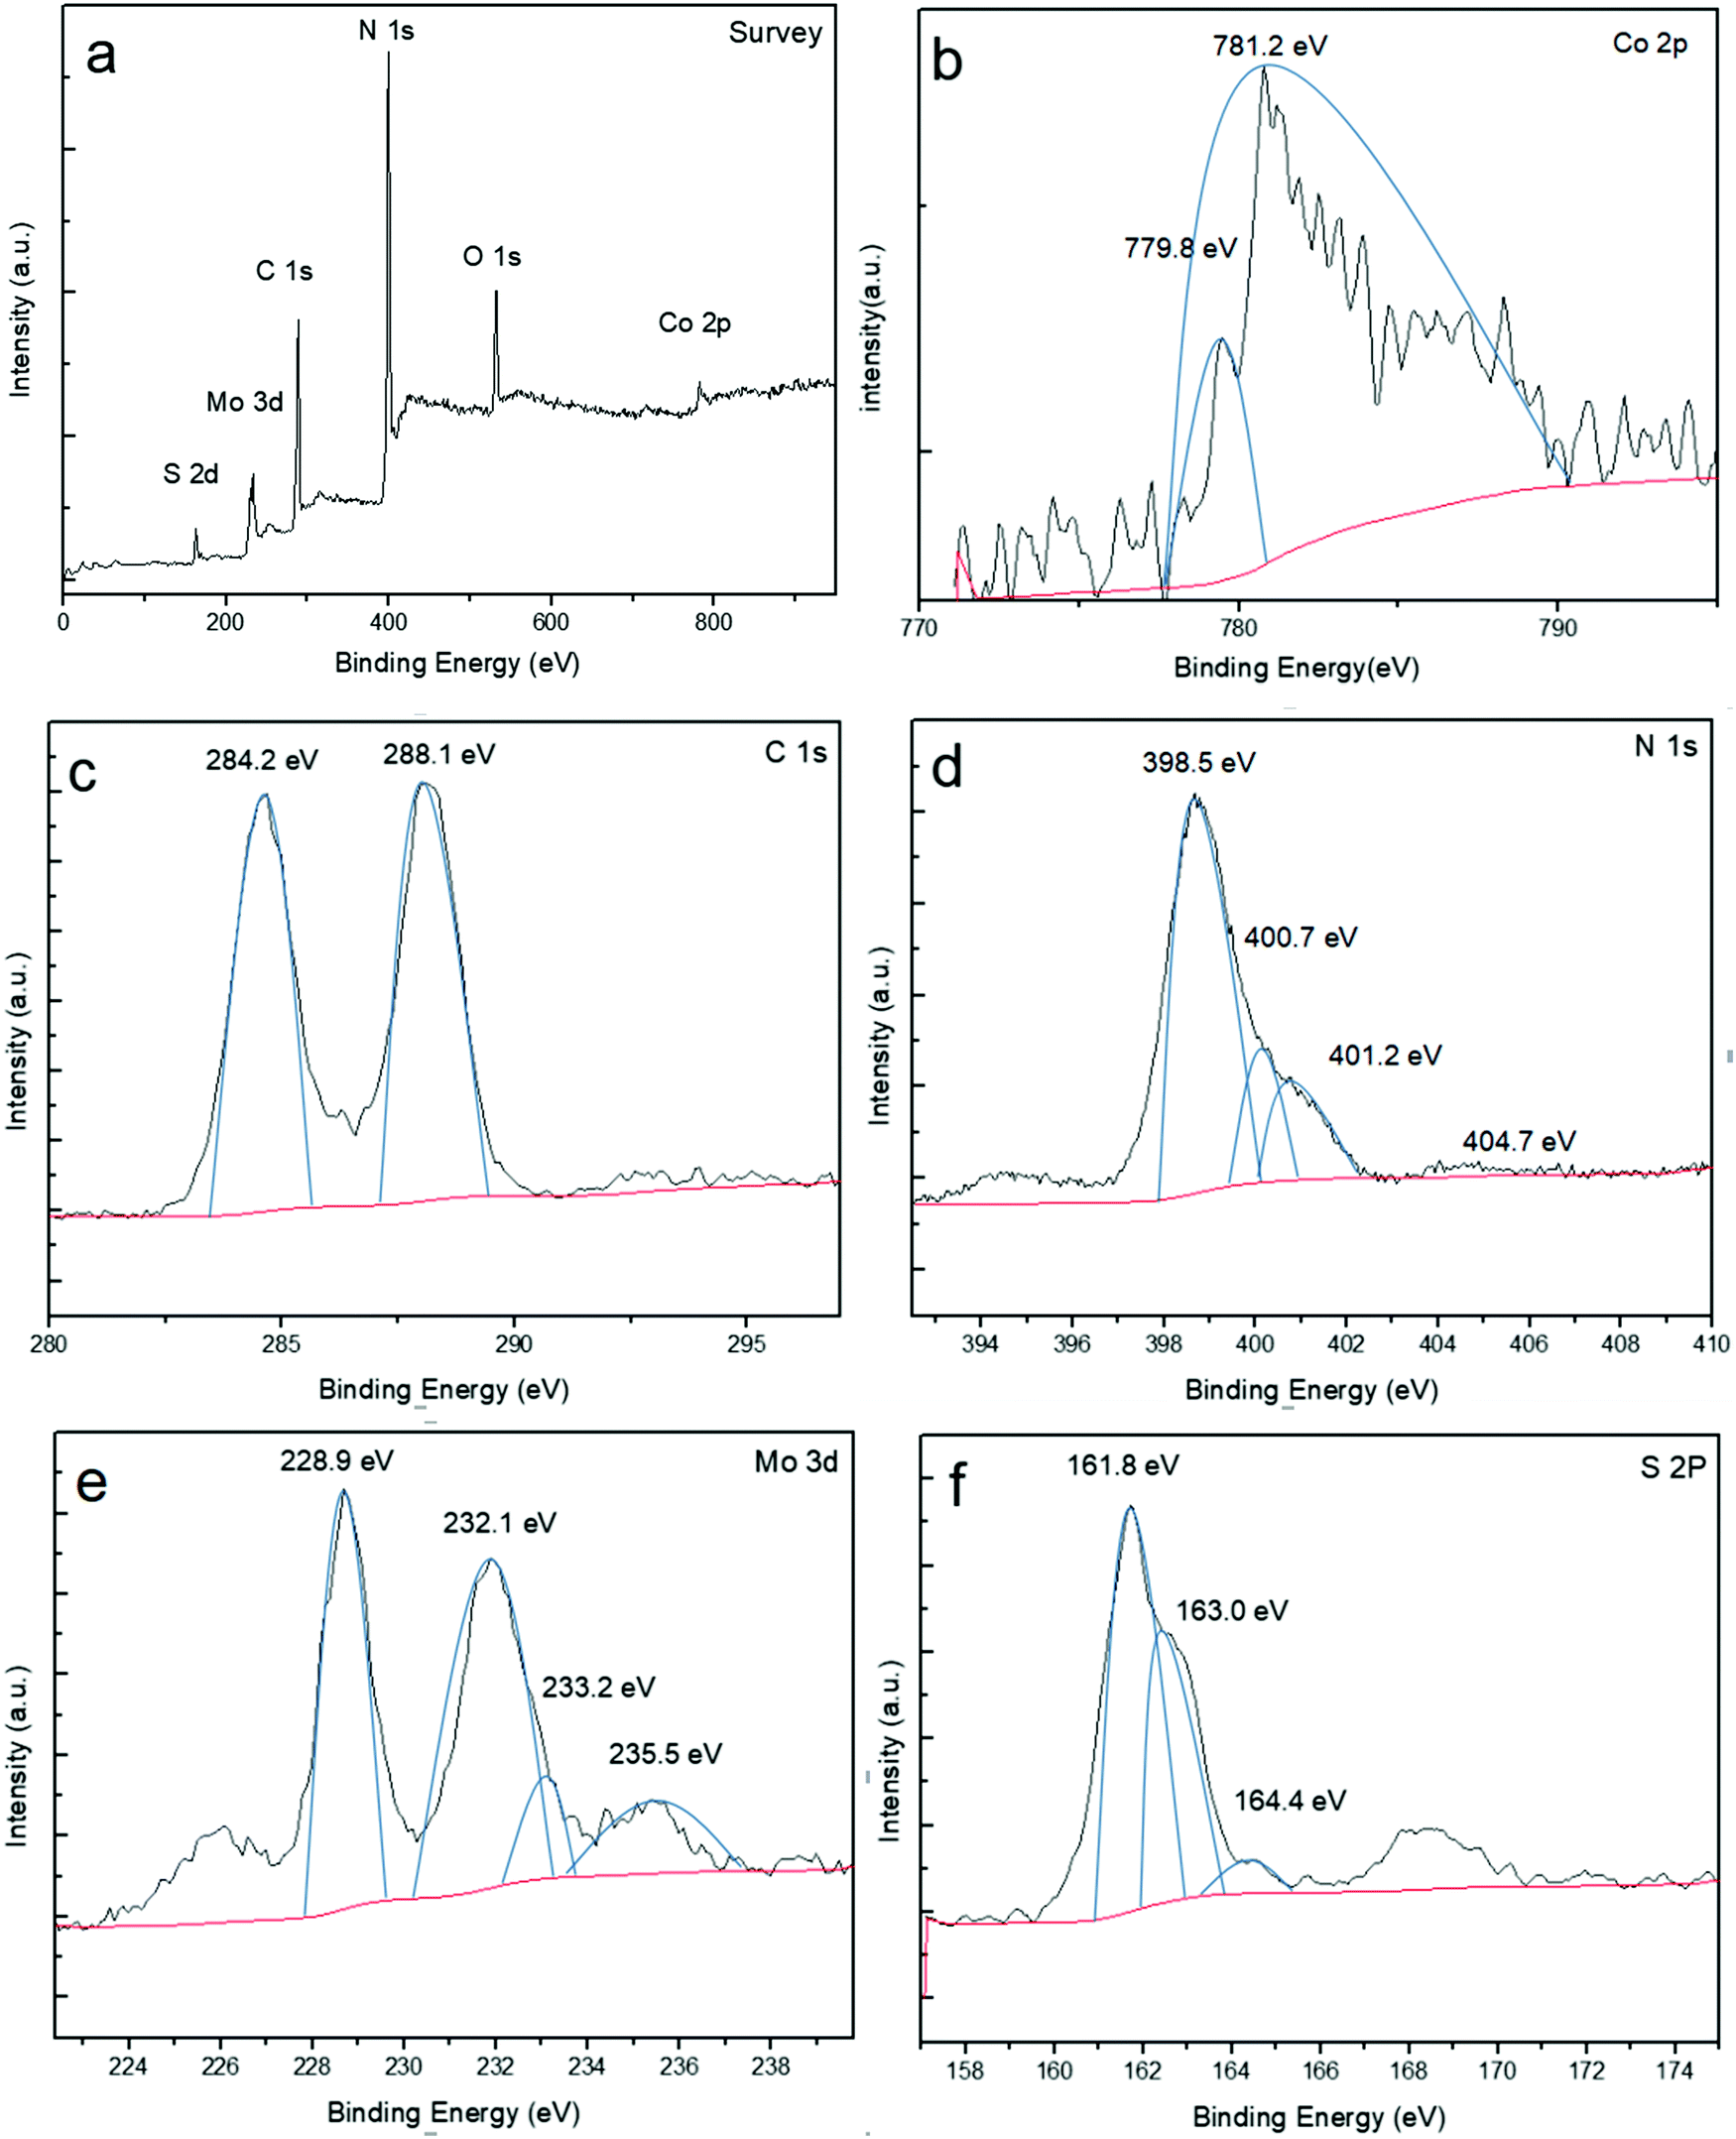
3.3 XPS analysis
X-ray photoelectron spectroscopy (XPS) was used to further study the chemical bonding state and elemental composition of the product (Fig. 3). As depicted in Fig. 3a, the survey scan shows that there are six predominant elements of Co, C, N, Mo, O and S, in good agreement with the chemical composition of the Co-g-C3N4/MoS2 composite except the O element. The peak of O 1s at 532.2 eV is attributed to the adsorbed H2O. As observed in Fig. 3b, there are two peaks at about 779.8 eV and 781.1 eV in the Co 2p spectrum. A typical spectrum reveals a binding energy (BE) peak associated with Co 2p3/2 of 781.1 eV which can be ascribed to the Co(II) state in the form of Co–Nx.46 This value is higher than that of metallic Co (∼779 eV) and Co oxide (∼780 eV) as a result of the increased electronegativity of N (3.04) compared to that of Co (1.88) and O (2.55),46 thus excluding the presence of cobalt oxide and metallic Co in the composites. According to the above results, it is believed that Co partially replaces C of g-C3N4 and is doped into the framework of g-C3N4. The high resolution spectra of C 1s, N 1s, Mo 3d and S 2p were also recorded. In Fig. 3c, two single peaks of C 1s located at 284.2 and 288.1 eV respectively can be seen. The former one is attributed to the sp2 hybridized C–C bonds of graphitic carbon. The latter one is related to the sp2-bonded carbon (N–C![[double bond, length as m-dash]](https://www.rsc.org/images/entities/char_e001.gif) N) in the triazine rings of g-C3N4.47 The largest peak of N 1s at 398.5 eV in Fig. 3d corresponds to sp2-bonded nitrogen in the form of C–NC. The C–NC bond is considered as a structural unit of the conjugated unit, while the weak peak at 400.7 eV is caused by the tertiary nitrogen N–(C)3 group. These two nitrogens together with the sp2-bonded carbon (N–CN) constitute the heptazine heterocyclic ring (C6N7) units.48 All the peaks of C 1s and N 1s are almost the same as those of the original carbon nitride, illustrating the fact that the modification with Co-doping and MoS2-coupling does not change the structure of the polymers. In the high-resolution Mo 3d spectrum (Fig. 3e), two characteristic peaks centered at 228.9 and 232.1 eV correspond to Mo 3d5/2 and Mo 3d3/2, respectively, indicating the major Mo(IV) species of 1T-MoS23/2 in the hybrid.49–51 Another small peak located at 233.2 eV represents the Mo(IV) species of 2H-MoS2.52,53 Moreover, an additional peak at 235.5 eV could be attributed to the presence of Mo(VI) with slight oxidation in air.49–51 Sulfur species were analyzed from the high-resolution S 2p spectrum (Fig. 3f), and the main doublets located at 161.8 and 163.0 eV represent the S 2p3/2 and S 2p1/2 species of 1T-MoS2. However, the characteristic peaks of 2H-MoS2 are located at higher binding energies of 163 and 164.6 eV, respectively.
N) in the triazine rings of g-C3N4.47 The largest peak of N 1s at 398.5 eV in Fig. 3d corresponds to sp2-bonded nitrogen in the form of C–NC. The C–NC bond is considered as a structural unit of the conjugated unit, while the weak peak at 400.7 eV is caused by the tertiary nitrogen N–(C)3 group. These two nitrogens together with the sp2-bonded carbon (N–CN) constitute the heptazine heterocyclic ring (C6N7) units.48 All the peaks of C 1s and N 1s are almost the same as those of the original carbon nitride, illustrating the fact that the modification with Co-doping and MoS2-coupling does not change the structure of the polymers. In the high-resolution Mo 3d spectrum (Fig. 3e), two characteristic peaks centered at 228.9 and 232.1 eV correspond to Mo 3d5/2 and Mo 3d3/2, respectively, indicating the major Mo(IV) species of 1T-MoS23/2 in the hybrid.49–51 Another small peak located at 233.2 eV represents the Mo(IV) species of 2H-MoS2.52,53 Moreover, an additional peak at 235.5 eV could be attributed to the presence of Mo(VI) with slight oxidation in air.49–51 Sulfur species were analyzed from the high-resolution S 2p spectrum (Fig. 3f), and the main doublets located at 161.8 and 163.0 eV represent the S 2p3/2 and S 2p1/2 species of 1T-MoS2. However, the characteristic peaks of 2H-MoS2 are located at higher binding energies of 163 and 164.6 eV, respectively.
 |
| | Fig. 3 XPS spectra of Co-g-C3N4/MoS2: (a) survey, (b) Co 2p, (c) C 1s, (d) N 1s, (e) Mo 3d, and (f) S 2p. | |
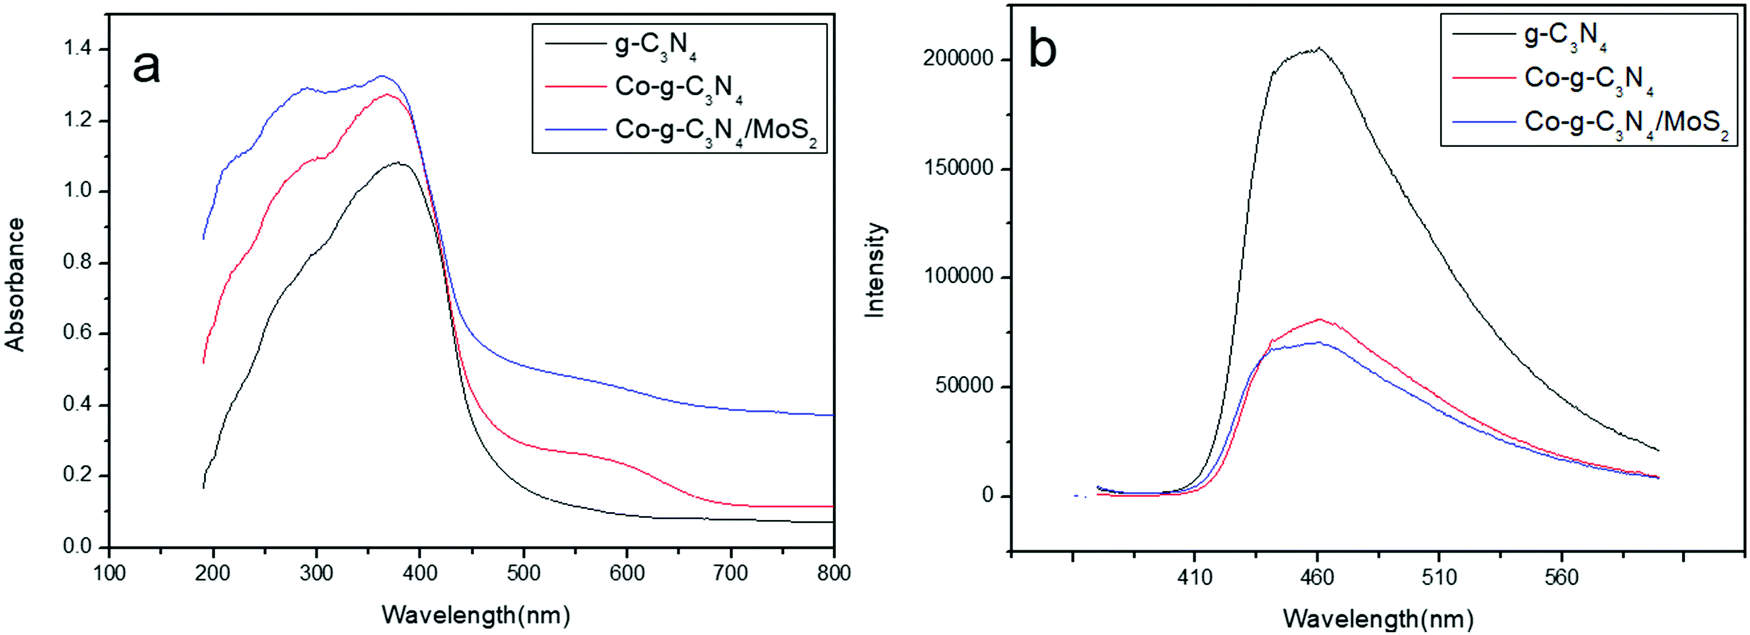
3.4 Optical properties
The photocatalytic activities of photocatalysts are closely related to their light absorption strength and response range. For a comparison of the optical properties, UV-vis-NIR diffuse reflectance spectroscopy (DRS) of the prepared sample was undertaken. As shown in Fig. 4a, g-C3N4 shows a strong intrinsic absorption band from the UV to the visible range with an absorption edge at 460 nm. This was caused by the excitation of electrons from the valence band to the conduction band of g-C3N4, corresponding to its bandgap energy of 2.79 eV.54 It is clear that the absorption band edge shifts to the red wavelength region and an enhanced absorption of g-C3N4 is observed in the whole range from UV up to red regions when Co or MoS2 is introduced into the system. The UV-vis results suggest that doping Co and coupling MoS2 to form heterojunctions can enable g-C3N4 to absorb more visible light to produce electron–hole pairs, resulting in enhanced catalytic activity.
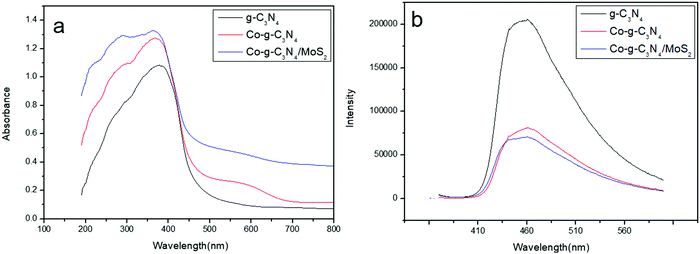 |
| | Fig. 4 (a) UV-vis diffuse reflectance spectra of the samples. (b) PL spectra of the samples. | |
The migration, transfer and recombination rates of the electron–hole pairs in the photocatalysts have great influence on the photocatalytic activity. PL spectra were used to investigate the behavior of electron–hole pairs.55 Usually, a lower PL intensity of photocatalysts indicates a lower recombination rate of electron–hole pairs and a higher photocatalytic activity.56 The PL spectra of g-C3N4, Co-g-C3N4 and Co-g-C3N4/MoS2 are shown in Fig. 4b. The excitation wavelength of the PL spectra was set at 370 nm and the main emission peaks of all samples were centered at around 480 nm. It can be observed that pure g-C3N4 displays an intense fluorescence emission peak at 480 nm, corresponding to its band gap recombination of electron–hole pairs, while the PL intensities of Co-g-C3N4 and Co-g-C3N4/MoS2 are much lower than that of g-C3N4 and the PL intensity of Co-g-C3N4/MoS2 is the lowest one. The strong fluorescence emission of g-C3N4 indicates a fast recombination of charge carriers, and a distinct fluorescence quenching of Co-g-C3N4 and Co-g-C3N4/MoS2 indicates an efficient inhibition of the recombination of charge carriers. This might be due to the fast electron transfer and the accelerated separation process of electron–hole pairs in Co-g-C3N4 and Co-g-C3N4/MoS2, associated with the Co-doping and the formation of the 2D heterojunction structure.
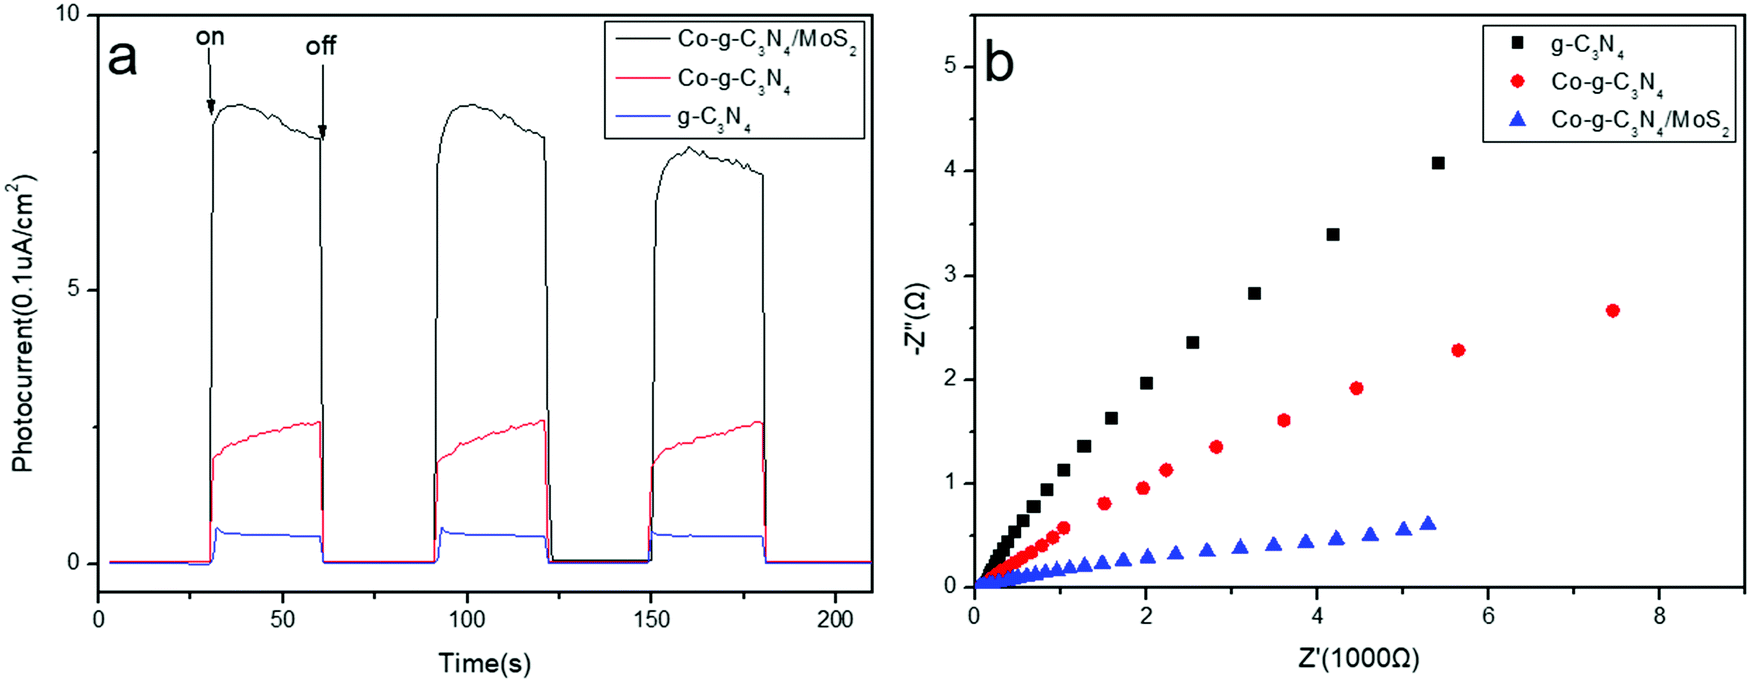
3.5 Photoelectrochemical measurement
Photoelectrochemical measurements, including transient photocurrent responses and electrochemical impedance spectroscopy (EIS) of the obtained g-C3N4, Co-g-C3N4, and Co-g-C3N4/MoS2 samples, were measured. The saturation photocurrent densities remain constant with light on, and immediately drop to nearly zero once the light is switched off (Fig. 5a). Both the photocurrent densities of Co-g-C3N4 and Co-g-C3N4/MoS2 are much higher than that of pure g-C3N4. The increased photocurrent can be ascribed to the Co-doping and 2D heterojunction formation, which facilitate the separation and transfer of electron–hole pairs of g-C3N4, prolonging the lifetime of the photoinduced charge carriers. The Co-g-C3N4/MoS2 photocatalyst exhibits the highest photocurrent response intensity, which is about 3.8- and 14.9-fold higher than that of Co-g-C3N4 and bare g-C3N4, respectively, indicating the lowest recombination rate of charge carriers and the fastest photogenerated electron migration. The almost unchanged photocurrent response during repeated light on–off cycles implies the excellent stability of the as-prepared photocatalysts. Electrochemical impedance spectroscopy (EIS) is another available method to study the charge transfer efficiency and interface reaction ability. Fig. 5b shows the EIS Nyquist plots of the samples, which correspond to their charge transfer resistance. A smaller arc radius of the EIS Nyquist plot implies a lower impedance and faster interface charge transfer.57 The Co-g-C3N4/MoS2 photocatalyst has the smallest arc radius of the EIS Nyquist plot, indicating that it possesses the lowest impedance and the fastest interface charge transfer. The results accord with those obtained by the photocurrent and PL measurements.
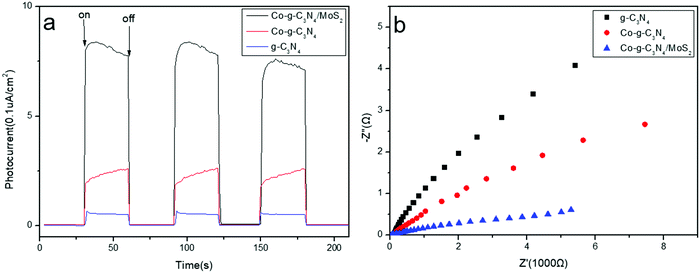 |
| | Fig. 5 (a) Transient photocurrent responses of the sample. (b) Nyquist impedance plots of the samples. | |
3.6 Photocatalytic degradation of RhB
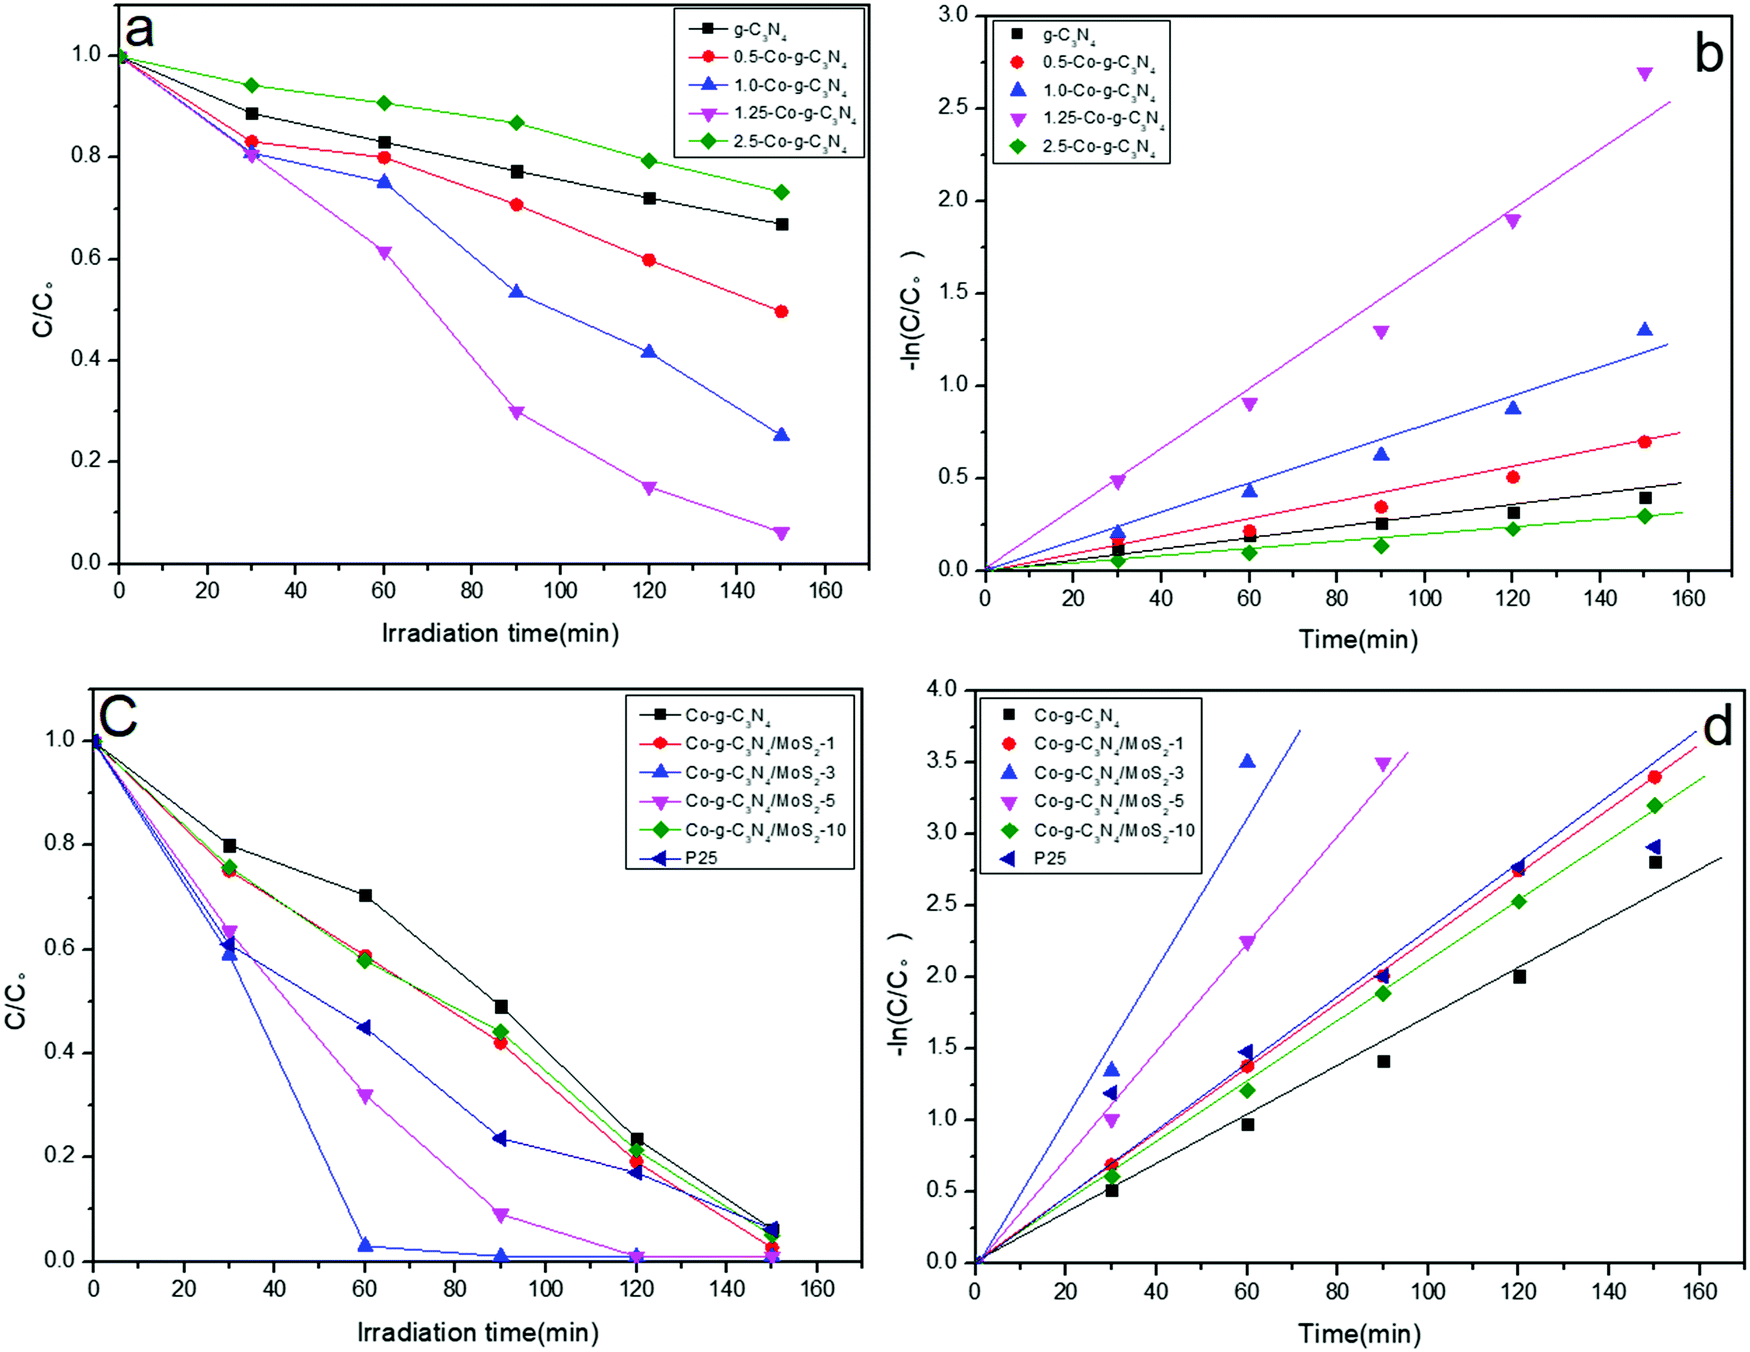
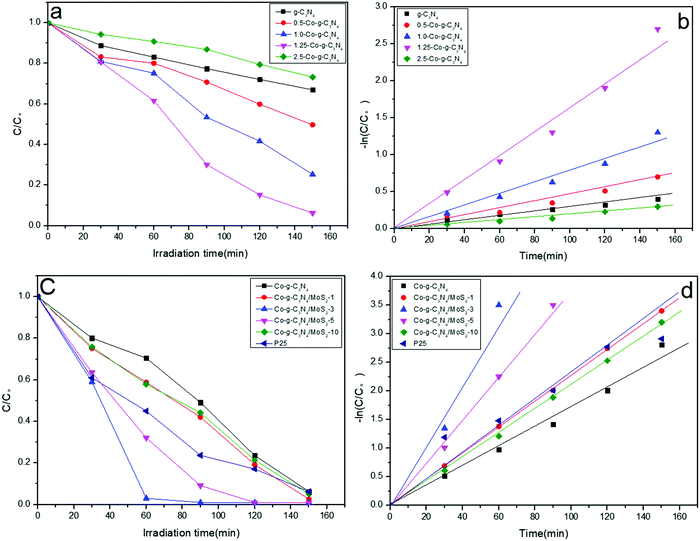
To evaluate the potential application of the as-prepared samples in environmental remediation, their photodegradation performances were investigated by photocatalytic degradation experiments using RhB as a model pollutant under simulated solar light irradiation. As shown in Fig. 6a and b, the doping of Co greatly influenced the photocatalytic performance of g-C3N4. With the increase in Co content, the photocatalytic efficiency of Co-g-C3N4 increases and reaches a maximum value for the 1.25 wt% Co-doping sample of 1.25-Co-g-C3N4. After 150 min irradiation, the degradation efficiency of RhB with 1.25-Co-g-C3N4 and pristine g-C3N4 is 94% and 33%, respectively. The degradation efficiency and the rate constant of 1.25-Co-g-C3N4 are 2.8 and 7.8 times higher than those of pristine g-C3N4. Similarly, compared to g-C3N4/MoS2 without Co-doping, the Co-doped g-C3N4/MoS2 sample shows higher photocatalytic activity. The degradation efficiency of Co-g-C3N4/MoS2 is 2.3 times higher than that of g-C3N4/MoS2. As Co partially replaces the C of g-C3N4 and is doped into the framework of g-C3N4, this C forms carbon cations, which can capture electrons easily and promote the generation of separated electrons and holes.48 As shown in Fig. 6a, excess Co-doping causes a reduction in photocatalytic efficiency. This is probably due to the introduced defects by excess Co at the interface, which can act as a recombination center for charge carriers.58 As shown in Fig. 6c, when the MoS2 was coupled with Co-g-C3N4 to form a 2D heterojunction composite, the photocatalytic activity of Co-g-C3N4 was enhanced significantly. At the optimized MoS2 content of 3 wt%, the degradation efficiency of Co-g-C3N4/MoS2 is 2.8 and 6.4 times higher than those of Co-g-C3N4 and g-C3N4, respectively. The formed 2D heterojunction can provide a high charge mobility and efficiently restrain the recombination of the photogenerated electrons and holes.59 Significant electron transfer from the g-C3N4 layer to the surface MoS2 layer can provide great help to separate the photo-generated electrons and holes. The efficiently separated photo-generated electrons and holes will greatly contribute to the photocatalytic reaction. However, too much MoS2, such as the sample with 10 wt% MoS2, resulted in a lower photocatalytic efficiency. This may be ascribed to the shielding effect of the higher amount of MoS2 on the g-C3N4 layers at low wavelengths to inhibit the generation of photo-carriers.60,61 The higher amount of MoS2 on the surface of g-C3N4 can absorb too much light, which suppresses the light absorption of g-C3N4. The photocatalytic activity of the as-prepared product Co-g-C3N4/MoS2 was also compared with the benchmark reagent P25. As shown in Fig. 6c and d, at the optimized MoS2 content, the photocatalytic activity of Co-g-C3N4/MoS2 was much higher than that of P25.
 |
| | Fig. 6 (a and c) Photocatalytic degradation of RhB and (b and d) the kinetic study over different photocatalysts under simulated solar light irradiation. | |
3.7 Detection of active species in the photocatalysis
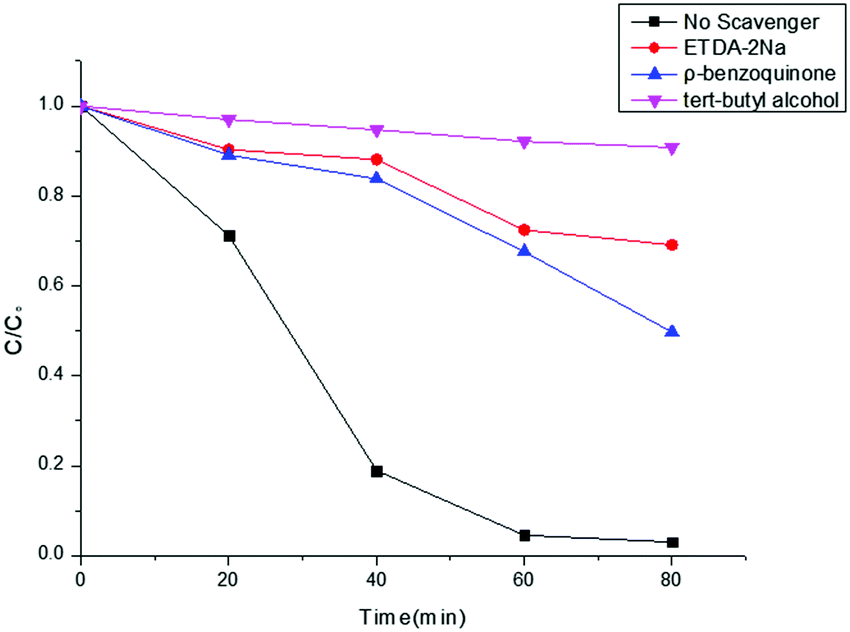
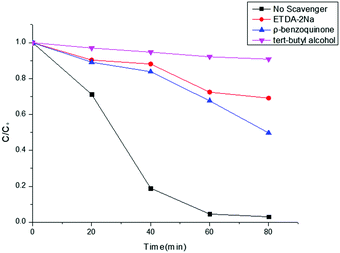
For the purpose of an in-depth investigation of the photodegradation mechanism of RhB, radical capture experiments were performed. Generally, superoxide radicals (˙O2−), hydroxyl radicals (˙OH), and photogenerated holes (h+) are the acknowledged active species in the photocatalytic degradation of organic molecules.62 Therefore, trapping experiments by using three different types of scavengers, ρ-benzoquinone (a quencher of ˙O2−), tert-butyl alcohol (a quencher of ˙OH), and Na2EDTA (a quencher of h+), with the Co-g-C3N4/MoS2 sample were performed to identify the active species involved in this reaction system. Fig. 7 shows the photodegradation ratios of RhB in the presence of different scavengers under simulated solar light irradiation for 80 min. It was found that ∼100% RhB degradation was achieved without the addition of scavengers. However, the degradation ratio decreases significantly to 9.8% with the addition of tert-butyl alcohol (1 mM), indicating that ˙OH is the major reactive species. Meanwhile, the addition of ρ-benzoquinone (1 mM) and Na2EDTA (1 mM) as scavengers was also found to inhibit the degradation ratio to 50.3 and 30.9%, respectively, which indicates that ˙O2− plays a more important role than h+ in the reaction. Therefore, the influence of the active species in the process of RhB photodegradation follows the sequence: ˙OH > ˙O2− > h+.
 |
| | Fig. 7 Effects of different scavengers on RhB degradation with Co-g-C3N4/MoS2. | |
3.8 Photocatalytic hydrogen evolution
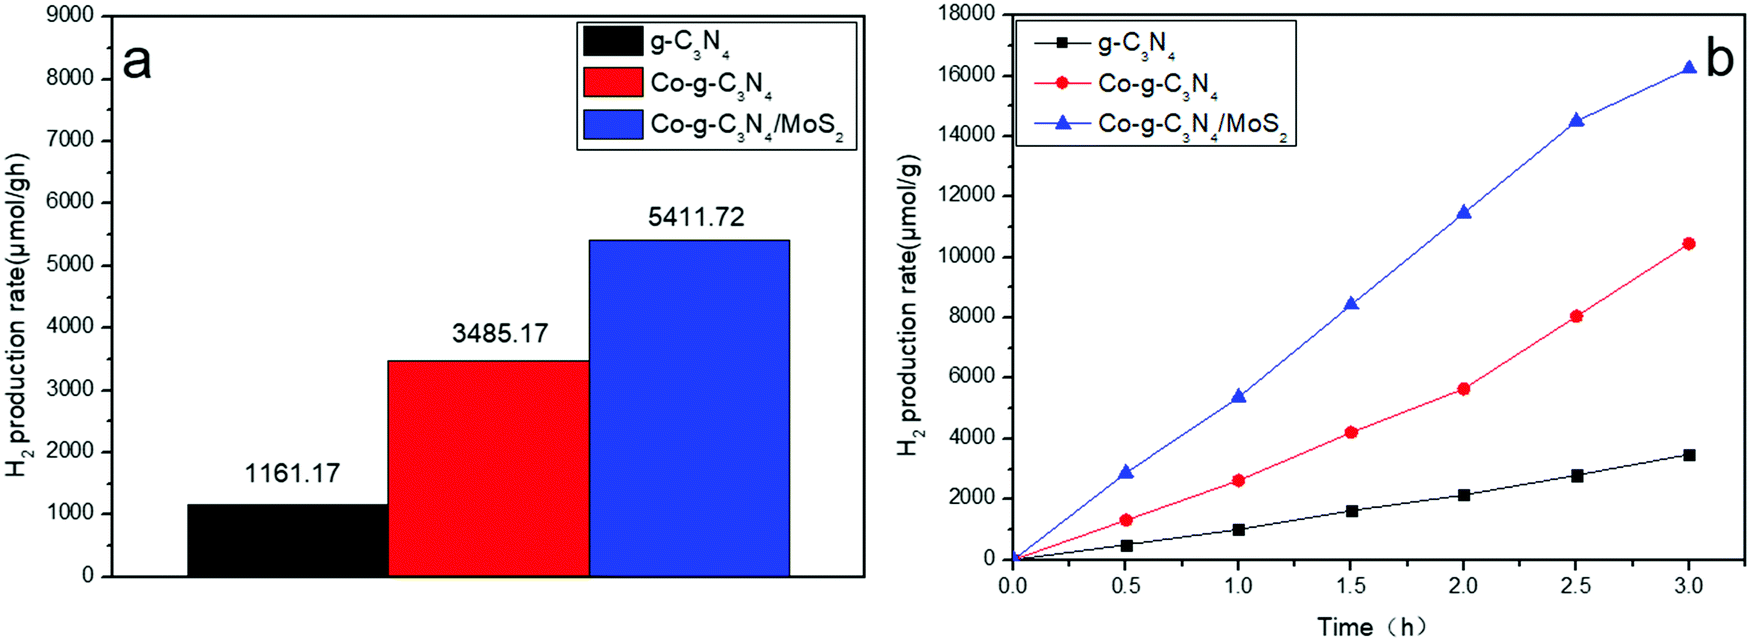
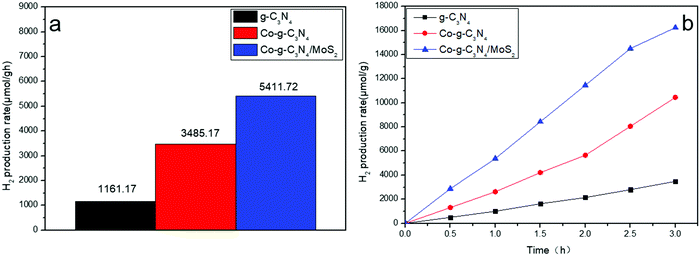
The photocatalytic hydrogen evolution abilities of the samples were evaluated under simulated solar light irradiation, as shown in Fig. 8a. Compared to pure g-C3N4, Co-g-C3N4 and Co-g-C3N4/MoS2 show higher hydrogen evolution rates of 3485.17 and 5411.72 μmol h−1 g−1, respectively. The rate of Co-g-C3N4/MoS2 is 1.6 and 4.7 times higher than that of Co-g-C3N4 and g-C3N4, respectively. The highest hydrogen evolution rate is ascribed to the synergetic effect of Co-doping and formation of a heterojunction between g-C3N4 and MoS2. The high performances of the as-synthesized photocatalysts are beneficial for the large-scale application of photocatalysis in the fields of energy and the environment.
 |
| | Fig. 8 Hydrogen evolution rates of the samples under simulated solar light irradiation. | |
3.9 Stability tests
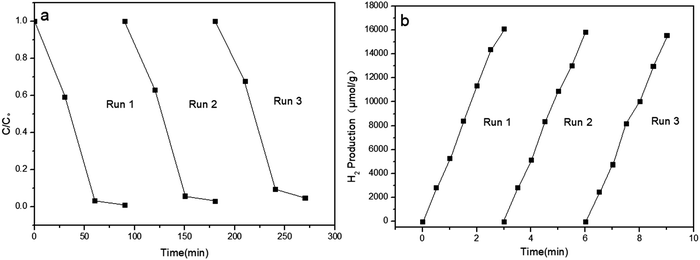
The stability of the as-prepared sample Co-g-C3N4/MoS2 was investigated by recycling experiments. After each cycle, all the used sample was collected together, centrifuged, washed with distilled water, and dried at 60 °C overnight. As shown in Fig. 9, the photocatalytic degradation efficiency of the sample did not decrease after three cycles, and the hydrogen evolution also remained almost constant in each cycle, indicating that the heterojunction photocatalyst is quite stable during the photocatalytic reaction. The high stability of the as-synthesized photocatalyst is beneficial for the large-scale photocatalytic application in the fields of energy and the environment.
 |
| | Fig. 9 Repeated catalytic activity measurement of the Co-g-C3N4/MoS2 catalyst for RhB degradation (a) and hydrogen evolution (b). | |
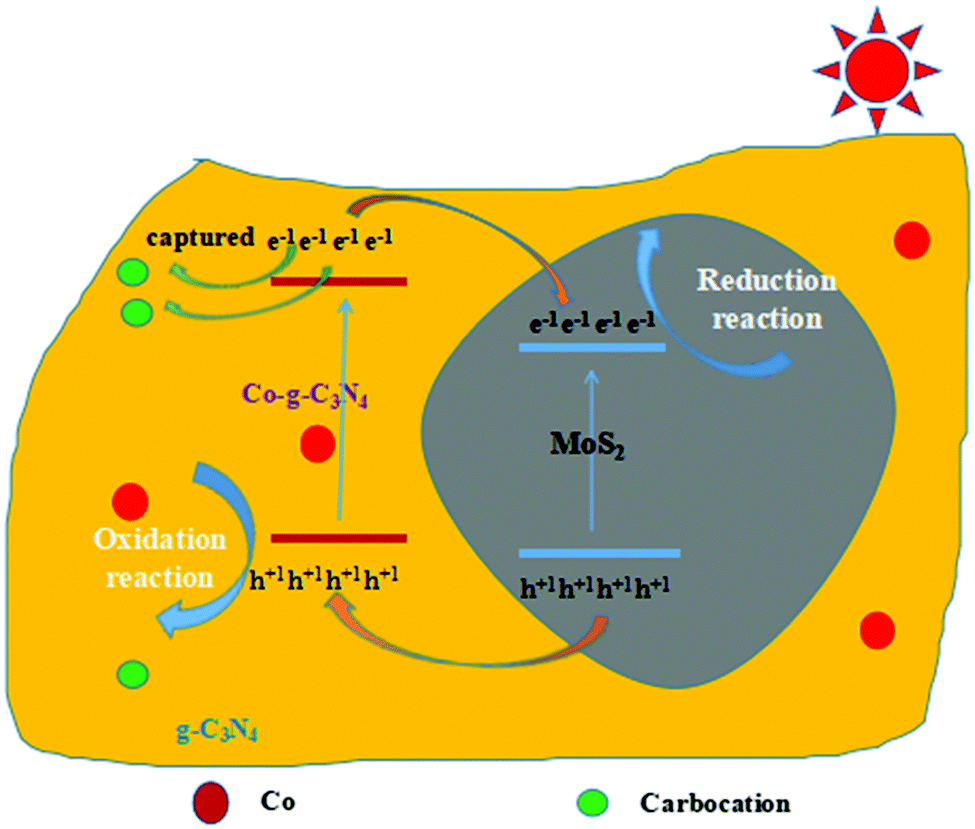
4. Photocatalysis mechanism
The proposed mechanism for the photocatalytic-activity enhancement using the 2D Co-g-C3N4/MoS2 is depicted in Scheme 1. The valence band (VB) and the conduction band (CB) potentials of a semiconductor can be determined according to the following empirical formulas:63,64
where X is the absolute electronegativity of the semiconductor and the X values of g-C3N4 and MoS2 are 4.67 and 5.33 eV, respectively.65Ee is the energy of free electrons on the hydrogen scale (about 4.5 eV) and Eg is the band gap energy of the semiconductor. Based on the results of the UV-vis spectra, the band gap energy of g-C3N4 nanosheets is 2.79 eV. The band gap energy of MoS2 nanosheets is 1.90 eV.65 Thus, the estimated EVB values for g-C3N4 and MoS2 nanosheets are 1.57 and 1.78 eV, respectively. Accordingly, the ECB values of g-C3N4 and MoS2 nanosheets are calculated to be −1.22 and −0.12 eV, respectively. Hence, there is a match of energy bands between g-C3N4 and MoS2. Under visible light irradiation, both g-C3N4 and MoS2 were excited to generate electrons and holes. Since the CB potential of g-C3N4 was more negative than that of MoS2, the photoinduced electrons in the CB of g-C3N4 can easily transfer to that of MoS2 through the interface. At the same time, because the VB position of g-C3N4 is more negative than that of MoS2, the holes in the VB of MoS2 can move to that of g-C3N4 in a similar manner, which causes the photo-generated electrons and holes to separate effectively. As a result, the electrons are collected in the CB of MoS2 and the holes are collected in the VB of g-C3N4. Therefore, the probability of electron–hole recombination is reduced, resulting in enhanced photocatalytic activity. When Co is introduced into the system, it can partially replace C of g-C3N4 and is doped into the framework of g-C3N4,48 and this C formed carbon cations, which can capture electrons easily and further promote the generation of separated electrons and holes.48 The proposed mechanisms above were verified by the measured results of PL, photocurrents and photoelectrochemical measurements.
 |
| | Scheme 1 Schematic diagram of photocatalysis mechanism of 2D Co-g-C3N4/MoS2. | |
The VB potential of g-C3N4 is lower than the standard redox potential of ˙OH, H+/H2O (2.72 V vs. NHE),66,67 indicating that the photogenerated holes in the VB of g-C3N4 cannot oxidize H2O molecules to afford the product ˙OH. However, the results of the active species trapping experiment confirmed that ˙OH was produced in this photocatalytic system. The ˙OH is formed by an indirect way through a reaction between ˙O2− and H2O.68,69
| | | ˙O2− + e− + 2H+ → H2O2 | (2) |
| | | ˙O2− + H2O → ˙OH + OH− + O2 | (3) |
5. Conclusions
In summary, a novel 2D heterojunction of Co-g-C3N4/MoS2 was successfully prepared via a facile impregnation and calcination method. The layered MoS2 is decorated on the surface of g-C3N4 to form a 2D heterojunction with intimate interfaces facilitating charge carrier transfer between the semiconductors, as well as increasing light absorption. Meanwhile, Co-doping further promotes the charge carrier separation and light absorption. Co-g-C3N4/MoS2 shows significantly enhanced photocatalytic activities toward the degradation of RhB and H2 evolution under simulated sunlight irradiation. The effects of the amount of Co-doping and MoS2-loading were investigated and the photocatalysis mechanism was proposed as well. This work provides new insights into the design and fabrication of advanced heterojunction catalysts.
Conflicts of interest
There are no conflicts to declare.
Acknowledgements
The authors acknowledge the National Natural Science Foundation of China (No. 21271126), the Program for Innovative Research Team in University (No. IRT 13078), and the National 973 Program (No. 2010CB933901).
References
- X. Bai, L. Wang, R. Zong and Y. Zhu, J. Phys. Chem. C, 2013, 117, 9952–9961 CrossRef CAS.
- J. Tian, Q. Liu, C. Ge, Z. Xing, A. M. Asiri, A. O. Al-Youbi and X. Sun, Nanoscale, 2013, 5, 8921–8924 RSC.
- X. Chen, Q. Liu, Q. Wu, P. Du, J. Zhu, S. Dai and S. Yang, Adv. Funct. Mater., 2016, 26, 1719–1728 CrossRef CAS.
- X. Wang, K. Maeda, A. Thomas, K. Takanabe, G. Xin, J. M. Carlsson, K. Domen and M. Antonietti, Nat. Mater., 2009, 8, 76–80 CrossRef CAS PubMed.
- J. Zhang, X. Chen, K. Takanabe, K. Maeda, K. Domen, J. D. Epping, X. Fu, M. Antonietti and X. Wang, Angew. Chem., Int. Ed., 2010, 49, 441–444 CrossRef CAS PubMed.
- P. Niu, L. Zhang, G. Liu and H. M. Cheng, Adv. Funct. Mater., 2012, 22, 4763–4770 CrossRef CAS.
- Q. Lin, L. Li, S. Liang, M. Liu, J. Bi and L. Wu, Appl. Catal., B, 2015, 163, 135–142 CrossRef CAS.
- J. Zhang, M. Zhang, L. Lin and X. Wang, Angew. Chem., Int. Ed., 2015, 54, 6297–6301 CrossRef CAS.
- A. Mezni, N. B. Saber, A. S. A. Almalki, A. Gobouri, E. V. Basiuk, J. Rizo, V. A. Basiuk, T. Kumeria, A. Santos, D. Losic and T. Altalhi, Nanosci. Nanotechnol. Lett., 2017, 9, 712–718 CrossRef.
- B. S. Kwak and M. Kang, J. Nanosci. Nanotechnol., 2017, 17, 8038–8044 CrossRef CAS.
- Y. Jiang, G. Sai-Anand, B. Xu, J. Lee, S. W. Kim, S. H. Yeom, J. H. Bae and S. W. Kang, J. Nanosci. Nanotechnol., 2017, 17, 8024–8030 CrossRef CAS.
- R. Tamura, T. Ochiai, D. Aoki, H. Saito and M. Nagata, Nanosci. Nanotechnol. Lett., 2017, 9, 1696–1699 CrossRef.
- F. Q. Zhang, X. L. Li, N. Y. He and Q. L. Lin, J. Nanosci. Nanotechnol., 2015, 15, 3839–3845 CrossRef CAS.
- X. L. Li, N. Y. He, T. T. Li, C. Ma, S. Elingarami and F. Q. Zhang, Sci. Adv. Mater., 2014, 6, 822–827 CrossRef CAS.
- L. Zhou, L. Z. Wang and J. Y. Lei, Catal. Commun., 2017, 89, 125–128 CrossRef CAS.
- C. Miranda and H. Mansilla, Photochem. Photobiol., 2013, 253, 16–21 CrossRef CAS.
- D. I. Sung, H. G. Kim, S. K. Cha, D. H. Kim, H. B. R. Lee and S. O. Kim, Nanosci. Nanotechnol. Lett., 2017, 9, 50–55 CrossRef.
- J. H. Ma, J. H. Kim and H. W. Choi, J. Nanosci. Nanotechnol., 2017, 17, 8153–8157 CrossRef CAS.
- P. W. Huo, J. Z. Li, Z. F. Ye, H. Q. Wang and Y. S. Yan, Chin. Chem. Lett., 2017, 28, 2259–2262 CrossRef CAS.
- Y. Guo, M. W. Huang, X. L. Fu, C. Liu and J. Chen, Chin. Chem. Lett., 2017, 28, 719–728 CrossRef CAS.
- J. Y. Yang, J. Teng, X. H. Zhao, X. Y. Jiang, F. P. Jiao and J. G. Yu, Nanosci. Nanotechnol. Lett., 2017, 9, 1622–1631 CrossRef.
- M. H. Kim, D. W. Shin, S. W. Lee, G. Kwak, S. J. Lee, D. H. Kim, S. J. Sung and Y. S. Han, J. Nanosci. Nanotechnol., 2017, 17, 8144–8148 CrossRef CAS.
- F. Chen, H. W. Huang, Y. H. Zhang and T. R. Zhang, Chin. Chem. Lett., 2017, 28, 2244–2250 CrossRef CAS.
- D. W. Kim, J. S. Son and J. Y. Leem, J. Nanosci. Nanotechnol., 2017, 17, 8112–8116 CrossRef CAS.
- W. W. Xia, F. Huang, J. W. Wei, L. Y. Zhou and Q. Pang, Nanosci. Nanotechnol. Lett., 2017, 9, 1665–1672 CrossRef.
- H. Zhao, Y. Dong, P. Jiang, H. Miao, G. Wang and J. Zhang, J. Mater. Chem. A, 2015, 3, 7375–7381 RSC.
- Y. Tian, L. Ge, K. Wang and Y. Chai, Mater. Charact., 2014, 87, 70–73 CrossRef CAS.
- Q. Li, N. Zhang, Y. Yang, G. Z. Wang and D. H. L. Ng, Langmuir, 2014, 30, 8965–8972 CrossRef CAS.
- H. Zhao, Y. Dong, P. Jiang, H. Miao, G. Wang and J. Zhang, J. Mater. Chem. A, 2015, 3, 7375–7381 RSC.
- Y. Tian, L. Ge, K. Wang and Y. Chai, Mater. Charact., 2014, 87, 70–73 CrossRef CAS.
- H. Zhao, Y. Dong, P. Jiang, H. Miao, G. Wang and J. Zhang, J. Mater. Chem. A, 2015, 3, 7375–7381 RSC.
- Y. Cao, Q. Li and W. Wang, RSC Adv., 2017, 7, 6131–6139 RSC.
- X. Lin, X. Guo, W. Shi, F. Guo, G. Che, H. Zhai, Y. Yan and Q. Wang, Catal. Commun., 2015, 71, 21–27 CrossRef CAS.
- G. Liu, P. Niu, C. Sun, S. C. Smith, Z. Chen, G. Q. Lu and H. M. Cheng, J. Am. Chem. Soc., 2010, 132, 11642–11648 CrossRef CAS.
- F. Qian, J. Wang, S. Ai and L. Li, Sens. Actuators, B, 2015, 216, 418–427 CrossRef.
- X. Wang, X. Chen, A. Thomas, X. Fu and M. Antonietti, Adv. Mater., 2009, 21, 1609–1612 CrossRef CAS.
- Y. Di, X. Wang, A. Thomas and M. Antonietti, ChemCatChem, 2010, 2, 834–838 CrossRef CAS.
- X. Chen, J. Zhang, X. Fu, M. Antonietti and X. Wang, J. Am. Chem. Soc., 2009, 131, 11658–11659 CrossRef CAS.
- P. Niu, L. L. Zhang, G. Liu and H. M. Cheng, Adv. Funct. Mater., 2012, 22, 4763–4770 CrossRef CAS.
- Y. Tian, B. Chang, J. Lu, J. Fu, F. Xi and X. Dong, ACS Appl. Mater. Interfaces, 2013, 5, 7079–7085 CrossRef CAS.
- Q. Liu and J. Y. Zhang, Langmuir, 2013, 11, 3821–3828 CrossRef PubMed.
- Z. Wu, C. Tang, P. Zhou, Z. Liu, Y. Xu, D. Wang and B. Fang, J. Mater. Chem. A, 2015, 3, 13050–13056 RSC.
- Y. Hou, A. B. Laursen, J. Zhang, G. Zhang, Y. Zhu, X. Wang, S. Dahl and I. Chorkendorff, Angew. Chem., Int. Ed., 2013, 52, 3621–3625 CrossRef CAS PubMed.
- X. W. Shi, M. Fujitsuka, S. Kim and T. Majima, Small, 2018, 14, 1703277 CrossRef.
- D. Wang, P. Zhou, Z. Wu, Z. Wang and Z. Liu, J. Power Sources, 2014, 264, 229 CrossRef CAS.
- Q. Liu and J. Zhang, Langmuir, 2013, 29, 3821–3828 CrossRef CAS.
- D. P. Hari and B. König, Angew. Chem., Int. Ed., 2013, 52, 4734–4743 CrossRef CAS.
- J. D. Benck, T. R. Hellstern, J. Kibsgaard, P. Chakthranont and T. F. Jaramillo, ACS Catal., 2014, 4, 3957–3971 CrossRef CAS.
- D. Wang, X. Zhang, Y. Shen and Z. Wu, RSC Adv., 2016, 6, 16656–16661 RSC.
- X. Zheng, J. Xu, K. Yan, H. Wang, Z. Wang and S. Yang, Chem. Mater., 2014, 26, 2344–2353 CrossRef CAS.
- G. Eda, H. Yamaguchi, D. Voiry, T. Fujita, M. Chen and M. Chhowalla, Nano Lett., 2011, 11, 5111–5116 CrossRef CAS.
- L. Jiang, S. Zhang, S. A. Kulinich, X. Song and H. Zeng, Mater. Res. Lett., 2015, 3, 177–183 CrossRef CAS.
- X. Zheng, J. Xu, K. Yan, H. Wang, Z. Wang and S. Yang, Chem. Mater., 2014, 26, 2344 CrossRef CAS.
- P. Niu, L. Zhang, G. Liu and H. M. Cheng, Adv. Funct. Mater., 2012, 22, 4763–4770 CrossRef CAS.
- H. Li, Y. Zhou, W. Tu, J. Ye and Z. Zou, Adv. Funct. Mater., 2015, 25, 998–1013 CrossRef CAS.
- G. Eda, H. Yamaguchi, D. Voiry, T. Fujita, M. Chen and M. Chhowalla, Nano Lett., 2011, 11, 5111 CrossRef CAS.
- D. P. Hari and B. König, Angew. Chem., Int. Ed., 2013, 52, 4734–4743 CrossRef CAS PubMed.
- H. Li, L. Zhou, L. Wang, Y. Liu, J. Lei and J. Zhang, Phys. Chem. Chem. Phys., 2015, 17, 17406–17412 RSC.
- Y. Hou, A. B. Laursen, J. Zhang, G. Zhang, Y. Zhu, X. Wang, S. Dahl and I. Chorkendorff, Angew. Chem., Int. Ed., 2013, 52, 3621–3625 CrossRef CAS PubMed.
- Y. J. Yuan, Z. T. Yu, Y. H. Li, H. W. Lu, X. Chen, W. G. Tu, Z. G. Ji and Z. G. Zou, Appl. Catal., B, 2016, 181, 16–23 CrossRef CAS.
- J. Di, J. Xia, Y. Ge, L. Xu, H. Xu, J. Chen, M. He and H. Li, Dalton Trans., 2014, 43, 15429–15438 RSC.
- S. Chen, Y. Hu, S. Meng and X. Fu, Appl. Catal., B, 2014, 150-151, 564–573 CrossRef CAS.
- Y. Li, S. Wu, L. Huang, H. Xu, R. Zhang, M. Qu, Q. Gao and H. Li, J. Phys. Chem. Solids, 2015, 76, 112–119 CrossRef CAS.
- Y. Hong, Y. Jiang, C. Li, W. Fan, X. Yan, M. Yan and W. Shi, Appl. Catal., B, 2016, 180, 663–673 CrossRef CAS.
- J. K. Ellis, M. J. Lucero and G. E. Scuseria, Appl. Phys. Lett., 2011, 99, 261908 CrossRef.
- J. Kim, C. W. Lee and W. Choi, Environ. Sci. Technol., 2010, 44, 6849–6854 CrossRef CAS PubMed.
- G. T. Li, K. H. Wong, X. W. Zhang, C. Hu, J. C. Yu and R. C. Chan, Chemosphere, 2009, 76, 1185–1191 CrossRef CAS PubMed.
- S. Z. Wu, K. Li and W. D. Zhang, Appl. Catal., B, 2015, 324, 324–331 CAS.
- J. F. Zhang, Y. F. Hu, X. L. Jiang, S. F. Chen and S. G. Meng, J. Hazard. Mater., 2014, 280, 713–722 CrossRef CAS PubMed.
|
| This journal is © The Royal Society of Chemistry and the Centre National de la Recherche Scientifique 2019 |

 *,
Feifei
Zhao
,
Kyu Khaing
Kyu
,
Bingqi
Liu
,
Dongwei
Chen
,
Kexian
Huang
,
LinLin
Deng
and
Luqiu
Li
*,
Feifei
Zhao
,
Kyu Khaing
Kyu
,
Bingqi
Liu
,
Dongwei
Chen
,
Kexian
Huang
,
LinLin
Deng
and
Luqiu
Li