 Open Access Article
Creative Commons Attribution 3.0 Unported Licence
Carbazole-based compounds containing aldehyde and cyanoacetic acid: optical properties and applications in photopolymerization†
Hussain Ahmed Abro ab,
Tengfei Zhoub,
Weixiang Hanb,
Tanlong Xueb and
Tao Wang
 *ab
*ab
aState Key Laboratory of Chemical Resource Engineering, College of Science, Beijing University of Chemical Technology, Beijing 10029, China. E-mail: wangtwj2000@163.com; Tel: +86-010-64445350
bDepartment of Organic Chemistry, College of Science, Beijing University of Chemical Technology, Beijing 10029, PR China
First published on 5th December 2017
Abstract
Carbazole-based dyes containing aldehyde and cyanoacetic acid groups were synthesized through Sonogashira coupling and Knoevenagel reactions. These compounds included 6-((4-(diphenylamino)phenyl)ethynyl)-9-ethyl-9H-carbazole-3-carbaldehyde (CCC), 9-ethyl-6-((9-ethyl-9H-carbazol-3-yl)ethynyl)-9H-carbazole-3-carbaldehyde (TCC), (E)-2-cyano-3-(9-ethyl-6-((9-ethyl-9H-carbazol-3-yl)ethynyl)-9H-carbazol-3-yl)acrylic acid (CCN) and (E)-2-cyano-3-(6-((4-(diphenylamino)phenyl)ethynyl)-9-ethyl-9H-carbazol-3-yl)acrylic acid (TCN). Density functional theory (DFT) calculations revealed these structures to be coplanar-conjugated molecular and uniform in shape. The UV spectra showed three main absorption peaks from 240 nm to 400 nm, indicating π–π* and n–π* electron transitions. The calculated vertical singlet excitation energy was within the range of n–π*. This finding was confirmed based on the acceptor results in reduced highest occupied molecular orbital-lowest unoccupied molecular orbital gap by launching cyanoacetic acid. These functional compounds could be used as dyes/photosensitizers.
Introduction
Dye photosensitized photopolymerization reactions have been largely known for many years and especially encountered in photopolymerization enabled by soft-light emitting LEDs.1–3 Dye molecules that are ideal for this purpose should show efficient photoinduced electron-transfer properties, so extended-conjugated chromophores decorated with electron donating and accepting groups are frequently employed as the design motifs for dyes. Aryl amine derivatives are well known electron-rich compounds that are widely used in hole transporting materials and light-emitting diodes, organic field-effect transistors, non-linear materials and organic solar cells.4,5 Typically, aryl amine donors include triphenylamine, carbazole, phenothiazine and N,N-dialkylaniline. Of particular note is that the amino groups in these molecules can be readily oxidized to form stable cations, which in turn enhances the ability to transport positive charges.6–8 Cyanoacrylic acid is most widely employed as an electron accepting group, especially for its use in dye-sensitized solar cells to attach the organic dye to the surface of titania nanocrystals.9–15Dye molecules containing carbazole and phenothiazine moieties have been known for a good photosensitizing performance in photopolymerization.16–18 It was believed that these dyes carried out electron-transfer photosensitization to onium salts. Research has been reported by several groups including Crivello and co-workers, Yagci and co-workers, and Jacques Lalevée and co-workers.19–27 Photolysis of onium salts is photosensitized by various monomeric and polymeric compounds containing the carbazole, triphenylamine and phenothiazine.
Density functional theory (DFT) is a very convenient and known technique used to predict experimental data. DFT involves a wide range of methods to determine the geometries of synthesized structures, their vertical excitation energies, and the highest occupied molecular orbital (HOMO) and lowest unoccupied molecular orbital (LUMO) energies.28–31 Furthermore, quantum chemical calculations have been increasingly used in the design and preselection of candidate molecules to minimize experimental efforts.32–35 Theoretical works have been conducted to elucidate the role of these properties in certain chemical and physical phenomena, such as laser technology, which require materials with specific optical properties.36–39
In this study, we prepared four carbazole-based compounds containing aldehyde and cyanoacetic acid as their side chains to bridge ethynyl to triphenylamine and ethylcarbazole. The synthesized compounds exhibit distinct structure and physical properties and have great potential in applications like photopolymerization as photosensitizers for the free radical polymerization of acrylates and ring-opening cationic polymerization of epoxides upon exposure to the very soft irradiation of laser diodes. Moreover, we compared the UV absorption spectra with vertical excitation energies based on their geometrical structures with the WB97×D/, functional, and the triple-ζ basis set 6-311G (d,p) to determine the interrelation of absorption and excitation energy.
Experimental
Materials and methods
Epichlorohydrin (ECH), N-methylpyrrolidone (NMP), and triethylamine (TEA) were purchased from Beijing Chemical Works (Beijing, China) and deprived of additional purification and were used directly. 6-Bromo-9-ethyl-9H-carbazole-3-carbaldehyde (BCC), monocarbon ethylcarbazole (MCE), and triphenylamine acetylene (TC) were prepared as suggested in the literature.40–42 Tripropylene glycol diacrylate (TPGDA, from Eternal Chemical Co. Ltd, Zhuhai, China) and the Epoxy resin E51 (from Jiangsu Sanmu Company China) were chosen as the monomer and oligomer for this study. All other reagents and chemicals were used as purchased without any additional purification. Fig. S1† illustrates the structures of BCC, MCE, TC, TEA, NMP, ECH, CQ, photoinitiator bis(4-methylphenyl)iodonium hexafluorophosphate (ONI), monomer TPGDA, and E51.Characterization
A UV-5200 (UNICO) UV-vis spectrophotometer was set for UV-vis absorption bands. IR spectroscopy was arranged by a Nicolet Avatar 370 MCT with the use of KBr pellets. 1HNMR and 13CNMR spectra were chronicled by a Bruker AV400 (400 MHz) NMR spectrometer. Fluorescence excited spectra were found by an F-4500 (Hitachi High-Technologies Corporation). HRMS extents were carried out on an LC/MSD TOF mass spectrometer. By an XT-4 microscopic melting point tool, the melting points (MP) of the composites were found. Chromatographic decontamination of the materials was achieved with 200–400 mesh chromatography silica. Thin-layer chromatography (TLC) was fixed on 0.20 mm silica gel plates.Computational details
Quantum chemical calculations were carried out by means of the Gaussian-09 software package. The ground state geometries of different conformations of these dyes were optimized in the gas phase with the B3LYP/6-31G (d,p) method. Density functional theory (DFT) at the Becke 3-Lee–Yang–Parr (B3LYP/6-31G (d,p)) level and visual inspection using the Gaussview program (version 5.0) were used for the ground state optimizations of the molecular structures for all the dyes. Vertical excitations were calculated with the WB97×D/functional and the triple-ζ basis set 6-311G (d,p). The solvent tetrahydrofuran (THF) was included via the polarizable continuum model in its integral evaluation formalism (IEF-PCM).Synthetic procedures
![[thin space (1/6-em)]](https://www.rsc.org/images/entities/char_2009.gif) :
:![[thin space (1/6-em)]](https://www.rsc.org/images/entities/char_2009.gif) DCM = 4
DCM = 4![[thin space (1/6-em)]](https://www.rsc.org/images/entities/char_2009.gif) :
:![[thin space (1/6-em)]](https://www.rsc.org/images/entities/char_2009.gif) 1) to give a pale yellow solid of CCC. Yield is 85%. Mp = 170–171 °C. 1H NMR (400 MHz, chloroform-d) δ 10.13 (s, 1H), 8.61 (d, J = 1.6 Hz, 1H), 8.39 (dd, J = 8.3, 1.5 Hz, 2H), 8.15 (d, J = 7.7 Hz, 1H), 8.05 (dd, J = 8.5, 1.6 Hz, 1H), 7.75 (ddd, J = 18.0, 8.4, 1.6 Hz, 2H), 7.53 (ddd, J = 8.2, 7.0, 1.2 Hz, 1H), 7.50–7.38 (m, 4H), 7.31 (d, J = 7.9 Hz, 1H), 4.40 (q, J = 7.2 Hz, 4H), 1.49 (q, J = 7.1 Hz, 6H). 13C NMR (101 MHz, CDCl3) δ 191.65, 143.88, 140.34, 139.99, 139.49, 130.22, 129.25, 128.90, 127.25, 126.10, 124.36, 124.07, 123.95, 123.13, 123.01, 122.81, 122.60, 120.60, 119.34, 115.76, 113.58, 109.19, 108.96, 108.70, 108.53, 89.68, 88.19, 38.09, 37.69, 13.89, 13.86. IR (KBr; ν (cm−1)): 3049 (Ar-H), 2205 (–C
1) to give a pale yellow solid of CCC. Yield is 85%. Mp = 170–171 °C. 1H NMR (400 MHz, chloroform-d) δ 10.13 (s, 1H), 8.61 (d, J = 1.6 Hz, 1H), 8.39 (dd, J = 8.3, 1.5 Hz, 2H), 8.15 (d, J = 7.7 Hz, 1H), 8.05 (dd, J = 8.5, 1.6 Hz, 1H), 7.75 (ddd, J = 18.0, 8.4, 1.6 Hz, 2H), 7.53 (ddd, J = 8.2, 7.0, 1.2 Hz, 1H), 7.50–7.38 (m, 4H), 7.31 (d, J = 7.9 Hz, 1H), 4.40 (q, J = 7.2 Hz, 4H), 1.49 (q, J = 7.1 Hz, 6H). 13C NMR (101 MHz, CDCl3) δ 191.65, 143.88, 140.34, 139.99, 139.49, 130.22, 129.25, 128.90, 127.25, 126.10, 124.36, 124.07, 123.95, 123.13, 123.01, 122.81, 122.60, 120.60, 119.34, 115.76, 113.58, 109.19, 108.96, 108.70, 108.53, 89.68, 88.19, 38.09, 37.69, 13.89, 13.86. IR (KBr; ν (cm−1)): 3049 (Ar-H), 2205 (–C![[triple bond, length as m-dash]](https://www.rsc.org/images/entities/char_e002.gif) C–), 1681 (O
C–), 1681 (O![[double bond, length as m-dash]](https://www.rsc.org/images/entities/char_e001.gif) CH), 2814, 2731 (OC–H). HRMS (MALDI-TOF, m/z): [M + H+] calcd for (C31H25N2O+): 441.1961; found: 441.1954.
CH), 2814, 2731 (OC–H). HRMS (MALDI-TOF, m/z): [M + H+] calcd for (C31H25N2O+): 441.1961; found: 441.1954.![[thin space (1/6-em)]](https://www.rsc.org/images/entities/char_2009.gif) :
:![[thin space (1/6-em)]](https://www.rsc.org/images/entities/char_2009.gif) MeOH = 5
MeOH = 5![[thin space (1/6-em)]](https://www.rsc.org/images/entities/char_2009.gif) :
:![[thin space (1/6-em)]](https://www.rsc.org/images/entities/char_2009.gif) 1), to get CCN as a reddish yellow solid, yield 65%. Mp = 236–238 °C. 1H NMR (400 MHz, DMSO-d6) δ 8.79 (d, J = 1.7 Hz, 1H), 8.47 (d, J = 1.4 Hz, 1H), 8.40 (s, 1H), 8.35 (s, 1H), 8.26 (d, J = 7.9 Hz, 2H), 7.85–7.71 (m, 3H), 7.71–7.62 (m, 3H), 7.51 (ddd, J = 8.3, 7.1, 1.2 Hz, 1H), 7.25 (t, J = 7.4 Hz, 1H), 4.50 (dq, J = 14.4, 7.0 Hz, 4H), 1.35 (q, J = 7.0 Hz, 6H). 13C NMR (101 MHz, DMSO-d6) δ 141.79, 139.93, 139.59, 139.05, 129.69, 128.87, 127.51, 126.25, 124.44, 123.80, 123.61, 123.42, 122.35, 122.28, 122.03, 121.73, 120.76, 119.24, 118.83, 114.29, 112.68, 110.31, 110.13, 109.47, 109.32, 89.49, 88.37, 37.49, 37.08, 13.77, 13.69. IR (KBr; ν (cm−1)): 3029, 2913 (Ar-H), 2222 (–C
1), to get CCN as a reddish yellow solid, yield 65%. Mp = 236–238 °C. 1H NMR (400 MHz, DMSO-d6) δ 8.79 (d, J = 1.7 Hz, 1H), 8.47 (d, J = 1.4 Hz, 1H), 8.40 (s, 1H), 8.35 (s, 1H), 8.26 (d, J = 7.9 Hz, 2H), 7.85–7.71 (m, 3H), 7.71–7.62 (m, 3H), 7.51 (ddd, J = 8.3, 7.1, 1.2 Hz, 1H), 7.25 (t, J = 7.4 Hz, 1H), 4.50 (dq, J = 14.4, 7.0 Hz, 4H), 1.35 (q, J = 7.0 Hz, 6H). 13C NMR (101 MHz, DMSO-d6) δ 141.79, 139.93, 139.59, 139.05, 129.69, 128.87, 127.51, 126.25, 124.44, 123.80, 123.61, 123.42, 122.35, 122.28, 122.03, 121.73, 120.76, 119.24, 118.83, 114.29, 112.68, 110.31, 110.13, 109.47, 109.32, 89.49, 88.37, 37.49, 37.08, 13.77, 13.69. IR (KBr; ν (cm−1)): 3029, 2913 (Ar-H), 2222 (–C![[triple bond, length as m-dash]](https://www.rsc.org/images/entities/char_e002.gif) N–), 1730 (O
N–), 1730 (O![[double bond, length as m-dash]](https://www.rsc.org/images/entities/char_e001.gif) C). HRMS (MALDI-TOF, m/z): [M + H+] calcd for (C34H26N3O2+): 508.2020; found: 508.2012.
C). HRMS (MALDI-TOF, m/z): [M + H+] calcd for (C34H26N3O2+): 508.2020; found: 508.2012.![[triple bond, length as m-dash]](https://www.rsc.org/images/entities/char_e002.gif) C–), 1682 (O
C–), 1682 (O![[double bond, length as m-dash]](https://www.rsc.org/images/entities/char_e001.gif) CH), 2804, 2736 (OC–H). HRMS (MALDI-TOF, m/z): [M + H+] calcd for (C35H27N2O+): 491.2118; found: 491.2125.
CH), 2804, 2736 (OC–H). HRMS (MALDI-TOF, m/z): [M + H+] calcd for (C35H27N2O+): 491.2118; found: 491.2125.![[triple bond, length as m-dash]](https://www.rsc.org/images/entities/char_e002.gif) N–), 1744 (O
N–), 1744 (O![[double bond, length as m-dash]](https://www.rsc.org/images/entities/char_e001.gif) C). HRMS (MALDI-TOF, m/z): [M + H+] calcd for (C38H28N3O2+): 558.2176; found: 558.2185.
C). HRMS (MALDI-TOF, m/z): [M + H+] calcd for (C38H28N3O2+): 558.2176; found: 558.2185.Results and discussion
Synthesis
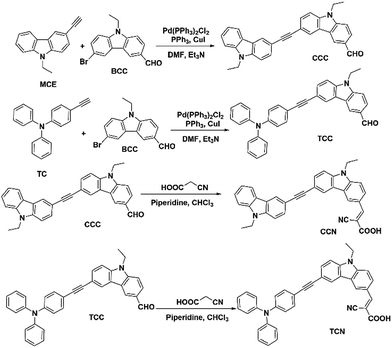
The Sonogashira coupling reaction was used to synthesize aldehyde-containing carbazole in the presence of ethynylated carbazole or ethynylated triphenylamine with 9-ethyl-6-iodo-9H-carbazole-3-carbaldehyde to obtain CCC and TCC. Knoevenagel reactions using piperidine as a base were carried out to synthesize CCN and TCN by further processing CCC and TCC. Scheme 1 shows the synthetic routes for all the reactions. All these compounds possess large conjugated π bonds, and CCC was found the best coplanar compound. Table 1 shows two benzene rings in the structure in all the compounds connected by acetylene groups. Upon achieving a coplanar-conjugated molecular structure, these conjugated compounds promote intramolecular charge transfer. During optimization, these structures were found to be very undeviating and uniform in shape. Table 1 shows the structural parameters of all the dye compounds.| Product | Bond length | Bond angle | Dihedral angle | |||
|---|---|---|---|---|---|---|
| CCC | R(1,38) | 1.424 | A(2,1,38) | 119.993 | D(3,2,38,39) | 179.922 |
| R(32,39) | 1.424 | A(33,32,39) | 120.628 | D(34,33,39,38) | −179.943 | |
| R(49,51) | 1.219 | A(20,49,51) | 120.051 | D(22,21,49,51) | 179.988 | |
| CCN | R(11,16) | 1.424 | A(10,11,16) | 120.595 | D(7,10,16,17) | −179.542 |
| R(18,17) | 1.424 | A(17,18,19) | 120.659 | D(16,17,19,20) | 179.704 | |
| R(32,34) | 1.368 | A(35,34,38) | 114.039 | D(27,28,32,34) | −179.845 | |
| TCC | R(31,34) | 1.422 | A(27,31,34) | 121.044 | D(41,47,35,34) | −179.725 |
| R(51,35) | 1.424 | A(47,51,35) | 120.589 | D(35,35,27,25) | −179.499 | |
| R(62,63) | 1.219 | A(48,62,63) | 125.015 | D(42,48,62,63) | −179.963 | |
| TCN | R(17,20) | 1.422 | A(16,17,20) | 121.094 | D(15,16,20,21) | 179.394 |
| R(2,22) | 1.423 | A(21,22,23) | 120.630 | D(20,21,23,24) | 179.683 | |
| R(37,38) | 1.368 | A(42,38,39) | 114.050 | D(28,31,32,37) | 179.999 | |
The Knoevenagel reaction is a very useful nucleophilic technique in organic synthesis to produce alkenes from molecules containing carbonyl groups.10,12,43,44 It was found that the reactions from CCC to CCN and from TCC to TCN are easy to carry out and the substituent has little effect on the yield. The low yield of CCN and TCN obtained was mainly from the loss during purification because of their low solubility in many solvents.
To optimize the conditions and the best yield of the synthetic compound, TCC was taken as an example. The optimized conditions for reaction parameters like material ratio, catalyst concentration, temperature, reaction time, and yield percent are shown in Table S1.† It can be seen that the optimum conditions were with a material ratio of 1.1, and the catalyst Pd (PPh3)2Cl2 with a molar ratio of 0.015 was found as an excellent choice to get the best yield percent for TCC for a coupling reaction.
The required compounds were successfully synthesized and characterized. The 1H NMR and 13C NMR signals (Fig. S2–S9†) show diverse types of protons at particular positions. Due to differences in solubility, two types of solvents were used to dissolve the sample for NMR.
Among these dyes, the active hydrogen with a chemical shift of δ = 1–2 ppm is assigned to CH3, δ = 3–5 ppm belongs to the N–H (aliphatic) proton, and the chemical shifts of the aldehydes (CHO) are approximately 9.80–10.3 ppm. The chemical shifts δ from 6 to 9 ppm show the presence of conjugated protons. For cyanoacetic acid containing dyes, the chemical shift δ of the hydrogen on the HC = C group ranged between 8.2 and 8.9 ppm The IR spectra (ESI Fig. S10–S13†) of the dyes indicated a feeble peak at 2200–2225 cm−1, which was attributed to a C![[triple bond, length as m-dash]](https://www.rsc.org/images/entities/char_e002.gif) C/N stretching mode, and an effective peak at approximately 1750–1680 cm−1, which was due to O
C/N stretching mode, and an effective peak at approximately 1750–1680 cm−1, which was due to O![[double bond, length as m-dash]](https://www.rsc.org/images/entities/char_e001.gif) C vibration.
C vibration.
UV-vis spectra
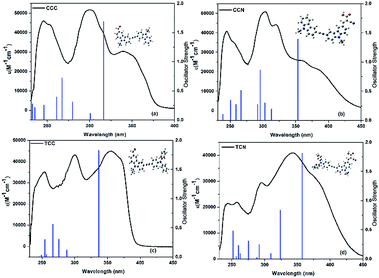
In order to investigate the optical properties, UV-vis spectra of these functional compounds were tested, and are shown in Fig. 1(a). Tetrahydrofuran (THF) at a concentration of 1 × 10⁻⁵ mol L−1 was used as the solvent. The details of the UV-vis absorption spectra of existing carbazole-based compounds are presented in Table 2. The maximum absorption of CCN was 362 nm, which was greater than 356 nm, 342 nm, and 340 nm of TCC, TCN, CCC, respectively. Three main absorption peaks were observed in the range between 240 and 365 nm for all compounds, at 240–260 nm, 290–310 nm, and 340–365 nm respectively.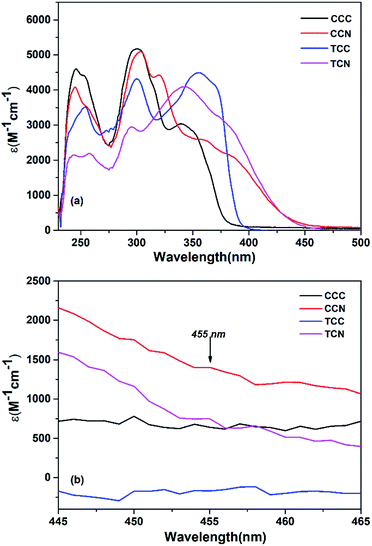 | ||
| Fig. 1 (a) The UV spectra of carbazole-based compounds at a concentration of 1 × 10⁻⁵ mol L−1 in THF. (b) The visible range of dyes at the wavelength of 455 nm. | ||
| Synthesized compounds | λmax,1 (nm) | ε × 104 (L mol−1 cm−1) | λmax,2 (nm) | ε × 104 (L mol−1 cm−1) | λmax,3 (nm) | ε × 104 (L mol−1 cm−1) |
|---|---|---|---|---|---|---|
| CCC | 246 | 4.60 | 302 | 5.17 | 340 | 3.04 |
| TCC | 254 | 3.51 | 300 | 4.30 | 356 | 4.50 |
| CCN | 245 | 4.08 | 304 | 5.12 | 362 | 2.58 |
| TCN | 258 | 2.20 | 294 | 2.94 | 342 | 4.09 |
The absorption peak at 290–305 nm is mainly denoted to the π–π* electron transition in the whole conjugated molecule. Because of its large conjugated structure, the absorption of these dye compounds in the 340–365 nm range is mainly due to the transition of the n–π* electrons in the whole conjugated molecule. Fig. 1(a) also reveals that cyanoacetic acid containing compounds were slightly redshifted than compounds containing aldehyde functionalized groups.
Additionally, in Fig. 1(b) cyanoacetic acid functionalized compounds show a slightly higher efficiency than aldehyde functionalized compounds, specifically in the range of visible light used in the present work. This may be regarded as that these compounds are useful in the field of photopolymerization.
Fluorescence spectroscopic study
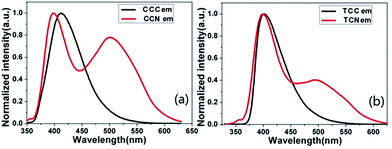
Fluorescence activity of the synthesized carbazole molecules was studied using a single-photon fluorescence test in a 1.0 × 10⁻⁶ mol L−1 THF solution. Fig. 2 reveals the comparison of compounds containing aldehyde and cyanoacetic acid. Table 3 represents the quantum yields of carbazole-based compounds. The CCN was found to possess the strongest fluorescence emission peak at 501 nm, followed by TCN, CCC, and TCC, and which were detected at 499, 413, and 402 nm, respectively, showing the main emission peaks red-shifted from CCC to CCN and from TCC to TCN. This redshift phenomenon may be due to the formation of a stronger cyanoacetic acid group than the aldehyde group and the growth of intramolecular conjugated chains. These were in agreement with the results of UV spectra (Fig. 1). The synthesized compounds exhibit a larger Stokes shift, indicating that the excited state of the dye molecules has greater polarity and redistribution in the excited state of the intra-molecular charge, thereby confirming the stronger molecular charge transfer ability. Moreover, the quantum yield of cyanoacetic acid functionalized compounds was lower than that of the aldehyde functionalized compounds, possibly because of their different molecular structure (Table 4).| Compounds | Excitation wavelength (λex) nm | Emission wavelength (λem) nm | Stokes shift (cm−1) | Quantum yield (Φ) |
|---|---|---|---|---|
| CCC | 302 | 413 | 8899 | 0.68 |
| TCC | 300 | 402 | 8458 | 0.89 |
| CCN | 304 | 501 | 12![[thin space (1/6-em)]](https://www.rsc.org/images/entities/char_2009.gif) 935 935 |
0.61 |
| TCN | 294 | 499 | 13![[thin space (1/6-em)]](https://www.rsc.org/images/entities/char_2009.gif) 975 975 |
0.65 |
| Product | HOMO (eV) | LUMO (eV) | Energy gap (eV) |
|---|---|---|---|
| CCC | −4.969 | −1.339 | 3.63 |
| CCN | −4.956 | −2.238 | 2.718 |
| TCC | −4.828 | −1.398 | 3.430 |
| TCN | −4.952 | −2.246 | 2.706 |
DFT calculations
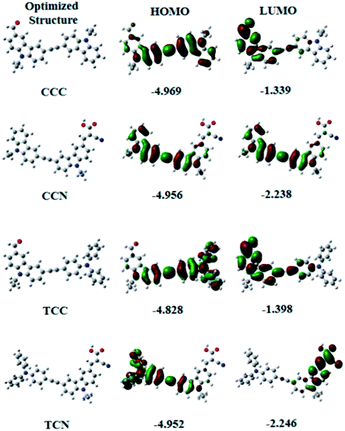
Fig. 3 shows a comparison of experimental UV-vis spectra with theoretical vertical singlet excitation energies of the carbazole-based compounds. The predicted values for theoretical vertical singlet excitation energies were found at an overestimated range within n–π* for all the compounds, except TCN. Moreover, the predicted excitation energy values were higher for cyanoacetic acid functionalized compounds than for the aldehyde functionalized compounds. The experimental values of UV spectra were in agreement with the predicted values. However, the UV spectra showed a significant increase than the predicted vertical-excitation energies.Similarly, the ground state structure and charge distributions of these compounds in both the ground and excited states, along with their corresponding molecular structures, were analyzed and optimized through DFT calculations in the gas phase, by using the B3LYP/6-31G (d,p) method. Fig. 4 shows the HOMO and LUMO orbitals and orbital energies of the carbazole-based compounds containing aldehyde and cyanoacetic acid. All the compounds were below the apparent intramolecular charge-transfer (ICT) phenomenon. Moreover, the charge transfer of aldehyde based compounds was found stronger than that of cyanoacetic acid functionalized compounds. The LUMO level of compounds containing the cyanoacetic structure was lower, and their energy level was smaller than the aldehyde functionalized compounds. These results show the electron-withdrawing ability of cyanoacetic acid during the reaction. Hence, introducing cyanoacetic acid as an acceptor may have reduced the HOMO–LUMO gap. The energy gap values were sequenced as CCC > TCC > CCN > TCN.
In contrast to the theoretical data, fluorescence spectroscopy data revealed an increased excitation and enhanced emission of the synthesized compounds. CCN and TCN showed a higher emission than CCC and TCC, validating our theoretical results.
Photopolymerization
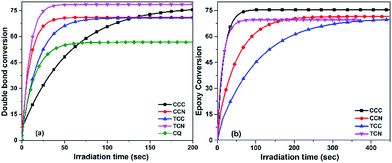
To verify the use of synthesized compounds as dyes in photopolymerization, we employed the dye/iodonium bis(4-methyl-phenyl) hexafluorophosphate (ONI) photoinitiation system under irradiation at 455 nm with a light-emitting diode (LED) as the light source. The double bond conversion curves of the TPGDA monomer for free radical photopolymerization and the epoxy conversion curves of the E51 monomer for the cationic photopolymerization were studied. A commercial camphorquinone/triethanolamine (CQ/TEA) photoinitiation system was also used for comparison with changes in the illumination time.As shown in Fig. 5(a), both dye/ONI and CQ/TEA systems could initiate TPGDA photopolymerization under the irradiation of a 455 nm LED light source. The conversion rates of TCN/ONI, CCC/ONI, CCN/ONI, and TCC/ONI in TPGDA were 78.5%, 75.5%, 71%, and 70%, respectively, whereas that of TPGDA in the system initiated by CQ/TEA could reach only 17.9%. The TGPDA photopolymerization of CCN/ONI, TCN/ONI, CCC/ONI, and TCN/ONI successfully reached the curing end point, indicating the high activity of the photoinitiating systems under the irradiation of a 455 nm LED light source. In general, the dyes with a greater light absorption capacity at 455 nm could be considered effective for photopolymerization.
The epoxy conversion rate curve of the E51 photopolymerization induced by the dye/ONI systems under a 455 nm LED light-source irradiation, shown in Fig. 5(b), indicates that the photoinitiation system composed of these dye molecules and ONI had great potential to initiate cationic photopolymerization. The final epoxy conversion rates of E51 were 75.5%, 71%, 69.8%, and 69.6% for CCC/ONI, CCN/ONI, TCC/ONI, and TCN/ONI, respectively, and the durations required to achieve the final conversion rate were 50, 50, 200, and 240 s, respectively. Based on the experimental results, these photoinitiation systems were characterized with a high cationic photoinitiation activity under the irradiation of a 455 nm excitation light source. The results revealed that TCN, CCN, TCC, and CCC show a weak UV absorbance at 455 nm. Moreover, the sequence of the free radical initiating activity was not consistent with that of the cationic initiating activity, which may be due to the fact that the sensitizer and ONI formed different active species, such as a free radical and cationic pathway after the interaction of the free radical system and cationic system, and their photoinduced activity differences.
Table 5 shows the overall yield for all the dyes applied in photopolymerization. It can be observed that all the dyes showed efficient and similar values in both types of conversions, except TCN, which showed a significant difference between free radical photopolymerization and cationic photopolymerization.
| Products | Double bond conversion (%) | Epoxy conversion (%) |
|---|---|---|
| CCC | 75.5 | 75.5 |
| CCN | 71.0 | 71.0 |
| TCC | 70.0 | 69.8 |
| TCN | 78.5 | 69.6 |
Conclusions
Four carbazole-based compounds (CCC, CCN, TCC, and TCN) containing aldehyde and cyanoacetic acid groups were synthesized. Analysis of the structural properties using DFT calculation, UV spectroscopy, and fluorescence spectroscopy indicated that these carbazole-based compounds displayed a highly linear and coplanar-conjugated-molecular structure. Comparison of compounds containing cyanoacetic acid and aldehyde showed a positive red shifted for the former based on emission peaks. When evaluated using an LED light source at 455 nm, the sequence of the free radical initiating activity was inconsistent with that of the cationic initiating activity. The discrepant results could be due to photoinduced activity differences and the fact that the sensitizer and ONI formed different unidentified active species, such as free radicals, and cationic pathways after the interaction between the free radical and the cationic systems.Conflicts of interest
There are no conflicts to declare.Acknowledgements
The authors thank the National Key Program of China (project number 2017YFB0307800) and National Natural Science Foundation of China (project grant no. 21176016) for financial support. We also thank the Beijing University of Chemical Technology CHEMCLOUDCOMPUTING Platform for support with the calculations.Notes and references
- P. Kotchapradist, N. Prachumrak, R. Tarsang, S. Jungsuttiwong, T. Keawin, T. Sudyoadsuk and V. Promarak, J. Mater. Chem. C, 2013, 1, 4916–4924 RSC.
- L. Cui, S. Dong, Y. Liu, Q. Li, Z. Jiang and L. Liao, J. Mater. Chem. C, 2013, 1, 3967–3975 RSC.
- K. R. Justin Thomas, J. T. Lin, Y. Tao and C. Ko, J. Am. Chem. Soc., 2001, 123, 9404–9411 CrossRef.
- Y. Ooyama, S. Inoue, T. Nagano, K. Kushimoto, J. Ohshita, I. Imae, K. Komaguchi and Y. Harima, Angew. Chem., Int. Ed., 2011, 50, 7429–7433 CrossRef CAS PubMed.
- Y. Ooyama, T. Nagano, S. Inoue, I. Imae, K. Komaguchi, J. Ohshita and Y. Harima, Chem.–Eur. J., 2011, 17, 14837–14843 CrossRef CAS PubMed.
- A. Venkateswararao, K. R. Justin Thomas, C. Lee, C. Li and K. Ho, ACS Appl. Mater. Interfaces, 2014, 6, 2528–2539 CAS.
- F. Wu, S. Zhao, L. Tien Lin Lee, M. Wang, T. Chen and L. Zhu, Tetrahedron Lett., 2015, 56, 1233–1238 CrossRef CAS.
- E. K. Praseetha, R. Behera, S. Mori and I. Gupta, J. Fluoresc., 2017, 27, 1–14 CrossRef PubMed.
- S. Telitel, J. Lalevée, N. Blanchard, T. Kavalli, M.-A. Tehfe, S. Schweizer, F. Morlet-Savary, B. Graff and J.-P. Fouassier, Macromolecules, 2012, 45, 6864–6868 CrossRef CAS.
- T. F. Zhou, X. Y. Ma, W. X. Han, X. P. Guo, R. Q. Gu, L. J. Yu, J. Li, Y. M. Zhao and T. Wang, Polym. Chem., 2016, 7, 5039–5049 RSC.
- C. Yang, S. Liao, Y. Sun, Y. Chuang, T. Wang, Y. Shieh and W. Lin, J. Phys. Chem. C, 2010, 114, 21786–21794 CAS.
- T. Wu, M. Tsao, F. Chen, S. Su, C. Chang, H. Wang, Y. Lin, W. OuYang and I. W. Sun, Int. J. Mol. Sci., 2010, 11, 329–353 CrossRef CAS PubMed.
- I. E. dell'Erba, S. V. Asmussen, W. F. Schroeder and C. I. Vallo, J. Mater. Sci., 2012, 47, 6665–6672 CrossRef.
- M. Adachi, Y. Murata, J. Takao, J. Jiu, M. Sakamoto and F. Wang, J. Am. Chem. Soc., 2004, 126, 14943–14949 CrossRef CAS PubMed.
- M. Adachi, J. Jiu and S. Isoda, Curr. Nanosci., 2015, 21, 17485–17490 Search PubMed.
- J. V. Crivello, Des. Monomers Polym., 2002, 5, 141–154 CrossRef CAS.
- Y. J. Hua and J. V. Crivello, Macromolecules, 2001, 34, 2488–2494 CrossRef CAS.
- M. Wang, X. Ma, J. Yu, X. Jia, D. Han, T. Zhou, J. Yang, J. Nie and T. Wang, Polym. Chem., 2015, 6, 4424–4435 RSC.
- J. V. Crivello and F. Jiang, Chem. Mater., 2002, 14, 4858–4866 CrossRef CAS.
- Z. Gomurashvili and J. V. Crivello, Macromolecules, 2002, 35, 2962–2969 CrossRef CAS.
- J. V. Crivello and M. Jang, J. Macromol. Sci., Part A: Pure Appl. Chem., 2005, 42, 1–19 CrossRef.
- J. V. Crivello, J. Polym. Sci., Part A: Polym. Chem., 2008, 46, 3820–3829 CrossRef CAS.
- D. Tunc and Y. Yagci, Polym. Chem., 2011, 2, 2557–2563 RSC.
- F. Kasapoglu and Y. Yagci, Macromol. Rapid Commun., 2002, 23, 567–570 CrossRef CAS.
- M. Kara, S. Dadashi-Silab and Y. Yagci, Macromol. Rapid Commun., 2015, 36, 2070–2075 CrossRef CAS PubMed.
- P. Xiao, J. Lalevee, J. Zhao and M. H. Stenzel, Macromol. Rapid Commun., 2015, 36, 1675–1680 CrossRef CAS PubMed.
- J. Zhang, D. Campolo, F. Dumur, P. Xiao, D. Gigmes, J. P. Fouassier and J. Lalevee, Polym. Bull., 2016, 73, 493–507 CrossRef CAS.
- J. Wu, AIChE J., 2006, 52, 1169–1193 CrossRef CAS.
- T. Liu, W. Han, F. Himo, G. M. Ullmann, D. Bashford, A. Toutchkine, K. M. Hahn and L. Noodleman, J. Phys. Chem. A, 2004, 108, 3545–3555 CrossRef CAS.
- N. Agarwal, P. K. Nayak, F. Ali, M. P. Patankar, K. L. Narasimhan and N. Periasamy, Synth. Met., 2011, 161, 466–473 CrossRef CAS.
- A. Jain, Y. Shin and K. A. Persson, Nat. Rev. Mater., 2016, 1, 15004 CrossRef CAS.
- L. H. Madkour, S. Kaya, C. Kaya and L. Guo, J. Taiwan Inst. Chem. Eng., 2016, 68, 461–480 CrossRef CAS.
- N. Minezawa, Chem. Phys. Lett., 2015, 622, 115–119 CrossRef CAS.
- A. Georgiev, E. Bubev, D. Dimov, D. Yancheva, I. Zhivkov, J. Krajcovic, M. Vala, M. Weiter and M. Machkova, Spectrochim. Acta, Part A, 2017, 175, 76–91 CrossRef CAS PubMed.
- L. Sacarescu, M. Fortuna, M. Soroceanu, C. Cojocaru, G. Sacarescu, M. Simionescu and V. Harabagiu, Silicon, 2015, 7, 343–349 CrossRef CAS.
- G. Krucaite, R. Griniene, A. Tomkeviciene, J. V. Grazulevicius, L. Liu, B. Zhang, Z. Xie and S. Grigalevicius, Opt. Mater., 2013, 36, 444–448 CrossRef CAS.
- K. D. Jandt and R. W. Mills, Dent. Mater., 2013, 29, 605–617 CrossRef CAS PubMed.
- D. E. Fast, A. Lauer, J. P. Menzel, A.-M. Kelterer, G. Gescheidt and C. Barner-Kowollik, Macromolecules, 2017, 50, 1815–1823 CrossRef CAS.
- T. Kumchoo, V. Promarak, T. Sudyoadsuk, M. Sukwattanasinitt and P. Rashatasakhon, Chem.–Asian J, 2010, 5, 2162–2167 CrossRef CAS PubMed.
- H. Shi, J. Dai, L. Shi, L. Xu, Z. Zhou, Y. Zhang, W. Zhou and C. Dong, Spectrochim. Acta, Part A, 2012, 93, 19–25 CrossRef CAS PubMed.
- S. Kato, H. Noguchi, A. Kobayashi, T. Yoshihara, S. Tobita and Y. Nakamura, J. Org. Chem., 2012, 77, 9120–9133 CrossRef CAS PubMed.
- H. Gilman and J. Eisch, J. Am. Chem. Soc., 1955, 77, 3862–3865 CrossRef CAS.
- M. J. Climent, A. Corma, V. Fornés, A. Frau, R. Guil López, S. Iborra and J. Primo, J. Catal., 1996, 163, 392–398 CrossRef CAS.
- C. F. Linares, M. R. Goldwasser, F. J. Machado, A. Rivera, G. Rodrígue Fuentes and J. Barrault, Microporous Mesoporous Mater., 2000, 41, 69–77 CrossRef CAS.
Footnote |
| † Electronic supplementary information (ESI) available: ESI contains information about compounds used in particular work, 1H NMR, 13C NMR and IR spectrum for synthesized compounds, and Table S1 contains data about synthetic conditions. See DOI: 10.1039/c7ra11887b |
| This journal is © The Royal Society of Chemistry 2017 |

