 Open Access Article
Creative Commons Attribution 3.0 Unported Licence
A hybrid magnetic core–shell fibrous silica nanocomposite for a chemosensor-based highly effective fluorescent detection of Cu(II)
K. Radhakrishnan,
P. Panneerselvam * and
A. Ravikumar
Department of Chemistry, SRM University, Kattankulathur-603 203, Chennai, India. E-mail: panneerselvam.pe@ktr.srmuniv.ac.in; panneerchem82@gmail.com; Tel: +91 96 88 53 88 42
First published on 27th September 2017
Abstract
Herein, a novel hybrid magnetic core–shell fibrous silica nanocomposite (RhB–Fe3O4/MnO2/SiO2/KCC-1) probe-based chemosensor was designed and its behaviour towards Cu(II) metal ion was investigated using a fluorescence spectrometer. The organic receptor rhodamine B (RhB) fluorophore derivative was covalently grafted onto the surface of the magnetic core–shell fibrous silica nanocomposite. This sensing probe achieved the selectivity towards Cu(II) in an aqueous solution, and other competing metal ions basically induced no spectral change. Thus, this sensing probe can work as a Cu(II) selective fluorescent sensor. The synthesized material was characterized using transmission electron microscopy (TEM), scanning electron microscopy-energy dispersive spectroscopy (SEM-EDS), surface analysis (with BET), Fourier transform infrared spectroscopy (FT-IR), X-ray diffractometry, and thermogravimetric analysis (TGA). The rhodamine B derivative has a unique signalling probe that exhibits a turn-on fluorescence enhancement upon the recognition of Cu(II) ion with an excitation at 569 nm. The linearity of the Stern–Volmer plot (R2 = 0.9882) and the detection limit of 12.3 × 10⁻⁸ M were achieved. Finally, the sensor was tested to detect Cu(II) ion in different real water samples.
1. Introduction
Cu(II) is one of the most toxic heavy metals. Even at low concentrations, it is a threat to human health and environment due to its high toxicity, mobility, and ability to accumulate through food chains or atmosphere in the ecological system.1 Copper(II), as the third most abundant essential trace metal ion in the human body, also plays an important role in various environmental, chemical, and physiological systems. There are many reactions in the biological process that involve the electron transfer that is catalyzed by copper-containing enzymes.2 Copper poisoning induces a wide variety of serious complications, such as vomiting, lethargy, increased blood pressure, acute haemolytic anaemia, Meknes and Wilson diseases, neurotoxicity, neurodegenerative, and Alzheimer's and prion diseases, in humans.3–5 Additionally, recently, copper has been suspected to cause infant liver damage. Both Indian childhood cirrhosis (ICC) and non-Indian childhood cirrhosis (NICC) have been proven to be associated with an excessive intake of copper ions.6 The permissible limit of copper in drinking water set by the US Environmental Protection Agency (EPA) is 1.3 mg l−1 (20 μM) and that set by the World Health Organization (WHO) is 1.0 mg l−1.7 Thus, detection of copper in water is of great significance due to the wide distribution of copper in the environment and its bioaccumulation through food chain.Therefore, the interest in developing rapid, specific, and cost-effective tools to detect Cu(II) is steadily growing.8 The traditional quantitative methods to develop a Cu(II) sensor include inductively coupled plasma mass spectroscopy (ICPMS), atomic absorption/emission spectroscopy (AAS/AES), electrochemical detection, and non-material-based probes.9–13 However, these methods are time-consuming and require expensive instrumentation, complicated equipment operation etc. Thus, significant efforts have been dedicated towards the development of selective and sensitive detection methods. Among them, fluorescent and colorimetric sensors are the most convenient techniques to monitor the level of copper. The paramagnetic behaviour of Cu(II), with a 3d9 outer shell electron configuration, attributes to the quenching of the emission intensity.14 With regard to the detection of copper via a fluorescent chemosensor, many previous reports have been focused on the fluorescence quenching process through energy or electron transfer processes. In term of the sensitivity, fluorescence enhancement (turn-on) signals are much easier to detect than fluorescence quenching (turn-off) signals. The rhodamine receptor-based fluorescent chemosensor for the detection of metal cations has received significant attention in recent years by virtue of its excellent spectroscopic properties and good water solubility. It is an ideal moiety to construct turn-on fluorescence chemosensor in term of metal ion triggering the spirolactam ring opening mechanism along with change in chromaticity and fluorescence at the same time. Considering the high affinity of Cu(II) to N and O atoms, rhodamine hydrazone is an excellent platform to design a novel fluorescent chemosensor for specially sensing Cu(II) with high sensitivity in an aqueous solvent.15–19
Mesoporous silica materials provide a good support for fluorescence probes due to their unique characteristics such as excellent solvent dispersibility, good optical transparency in the visible region, favourable biocompatibility, large surface area, open pore structure, and abundant functionalization sites in the silica network.20,21 Some silica-based mesoporous materials such as SBA-15, MCM-41, and MCM-48 have been reported as inorganic carriers for chemosensor.22–25 However, most of these optical nanoprobes have some limitations, which include the requirement of organic or aqueous organic solvent mixtures, poor performance in the removal of metal ions, and poor accessibility of analytes to sensing sites inside the probe.26 Therefore, recently, the most promising fibrous silica spheres (KCC-1) have been developed, and they exhibit excellent physical properties such as fibrous surface morphology, thermal and mechanical stability, better sorption capacity, and ease of functionalization of the organic molecule. This valuable material is also used as a catalyst, drug delivery vehicle, chromatography support, and chemosensor.27
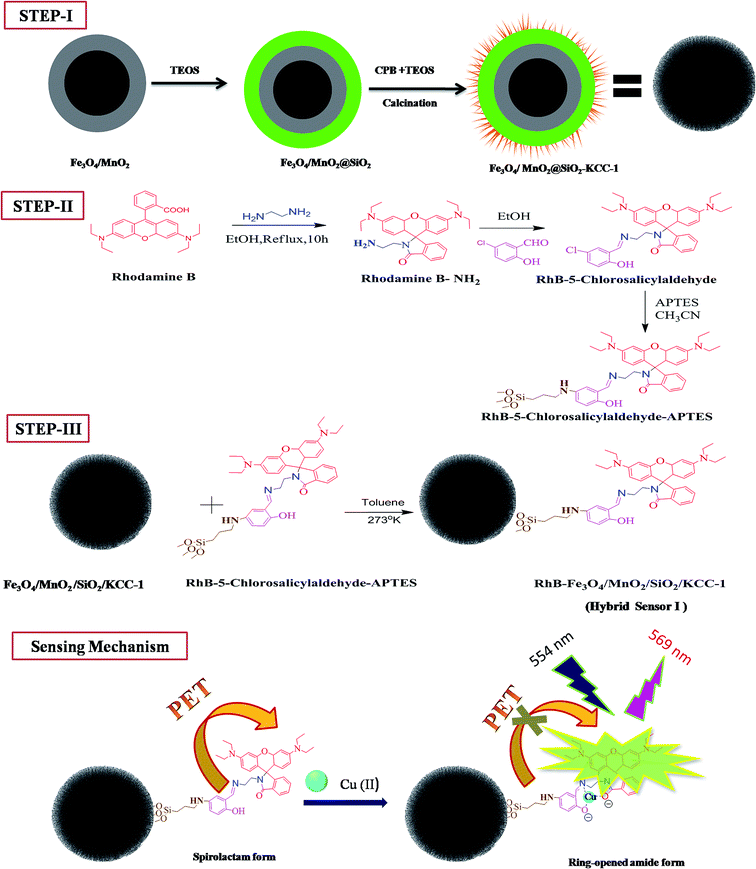
Herein, we explored a new hybrid nonmaterial that was formed by grafting the functionalized rhodamine B-based receptor onto the inner surface of magnetic core–shell fibrous silica KCC-1. The new hybrid sensor displayed an extremely high selectivity and sensitivity towards Cu(II) ion as compared to that towards other metal ions. The prepared iron oxide nanoparticles acted as a centre core, and they were then coated with manganese oxide over the surface of silica shell. The Fe3O4 core was used to saturate the magnetic behaviour, to protect the fluorescence quenching, and to avoid the aggregation of the nanocomposite. This approach has improved the selectivity and enhancement of fluorescence signal, as depicted in Scheme 1. Finally, the developed sensing system was successfully utilized for the detection of Cu(II) ion in environmental water samples. The design strategy of the hybrid sensor I is such that the recovery and reusability of the sensing material can be achieved. To the best of our knowledge, this is the first time that the detection of Cu(II) ion using an Fe3O4/MnO2 magnetic nanocomposite on a fibrous silica core functionalized with a rhodamine-based derivative has been reported.
2. Experimental
2.1. Reagents and instruments
All chemicals were obtained from the commercial source and used without further purification. Unless otherwise stated, all chemicals were of analytical reagent grade. Rhodamine B, 5-chlorosalicylic aldehyde, ethylenediamine, cyclohexane, n-pentanol, tetraethoxysilane (TEOS), cetylpyridinium bromide (CPB), and 3-aminopropyltriethoxysilane (APTES) were purchased from Alfa-Aesar. Salts used in the stock solutions of metal ions were KNO3, AgNO3, Ca(NO3)2·4H2O, Ni(NO3)·6H2O, Hg(NO3)2·H2O, Pb(NO3)2, Zn(NO3)2·6H2O, Co(NO3)2·6H2O, Al(NO3)2·9H2O, and Fe(NO3)3·9H2O. They were purchased from Sigma-Aldrich (India). All other organic solvents such as ethanol, toluene, dichloromethane, and ethyl acetate used in this study were obtained from Siscon research laboratories Pvt. Ltd (India) and purified by a standard procedure.Transmission electron microscopy (TEM) analysis was performed using JEOL/JEM 2100. For the sample preparation, the powders were dispersed in ethanol, and the suspension was dropped onto a 200 mesh carbon-coated TEM grid. The morphologies of the as-prepared samples were investigated using the field emission scanning electron microscope (FE-SEM) FEI Quanta FEG200. X-Ray diffraction (XRD) measurements were carried out via a PAN analytical X'pert powder diffractometer using Cu-Kα radiation (λ = 0.15405 Å). Fourier transform infrared (FT-IR) spectra were obtained using an Agilent Resolution Pro FT-IR spectrometer. The surface area was measured using a smart sorbs 92 surface area analyser, and N2 was used as an adsorbate. Thermogravimetric analysis (TGA, STA 2500 Regulus, NETZSCH) was performed at a heating rate of 10 °C min−1, and the nitrogen flow was 10 ml min−1. The magnetization property of the sample was measured using a vibrating sample magnetometer (Lakeshore VSM 7410). Fluorescence spectra of the sample were obtained using a HORIBA JOBIN YVON Fluoromax-4 spectrofluorometer with a xenon lamp excitation source. The UV-vis absorption spectra were obtained using a Shimadzu UV-2600 spectrophotometer. All pH values were obtained using a PHS-3C digital pH meter.
2.2. Preparation of the Fe3O4/MnO2/SiO2 nanocomposite
The Fe3O4/MnO2 nanocomposite was prepared by a simple hydrothermal process following the procedure reported in the literature.28 In a typical preparation, 0.51 g of KMnO4 was dissolved in 35 ml of deionized water and 0.7 ml of HCl (37 wt%) under stirring for 15 minutes. To this mixture, 0.3 g of Fe3O4 was added, and the mixture was continuously stirred for another 30 min. Then, the mixture was transferred to a 50 ml Teflon-lined autoclave that was kept in an oven at 120 °C for 6 h for hydrothermal treatment under a static condition. The required product was obtained by applying an external magnet, washed several times with ethanol and deionized water, and then dried at 60 °C. The abovementioned prepared Fe3O4/MnO2 nanocomposite was dispersed in 30 ml ethanol and deionized water, and the mixture was stirred with 0.7 ml of concentrated ammonia solution using a magnetic stirrer. After this, 0.2 g of TEOS was added dropwise, and the mixture was continuously stirred at room temperature for 6 h. Finally, the resulting product Fe3O4/MnO2/SiO2 nanocomposite was separated via an external magnetic field and washed several times with deionized water.2.3. Preparation of Fe3O4/MnO2/SiO2/KCC-1
For the facile synthesis of Fe3O4/MnO2/SiO2/KCC-1, 0.3 g of Fe3O4/MnO2/SiO2 was first mixed with distilled water and ultrasonicated for 30 min. Then, 0.3 g of urea dissolved in 20 ml of water was added dropwise to the solution and ultrasonicated for 20 min. Subsequently, 0.5 g of CPB dissolved in 0.7 ml of n-pentanol and 30 ml of cyclohexane was added slowly under stirring at room temperature. TEOS (1.25 g, 6.0 mmol) was added dropwise to the mixture and it was stirred for 1 h. Then, the reaction mixture was kept in an autoclave at 120 °C for 6 h. The obtained nanocomposite was separated by a strong magnet, washed sequentially with water and acetone, and then dried overnight at 60 °C. Finally, the prepared hybrid silica nanocomposite material was calcined at 550 °C for 6 h.2.4. Preparation of RhB–NH2
The preparation of RhB–NH2 was carried out using the previously reported method.29 First, rhodamine B (3.82 g, 8 mmol) and ethane-1,2-diamine (2.6 ml, 40 mmol) were dissolved in 100 ml of ethanol and refluxed for 8 h. After this, the reaction mixture was cooled down to room temperature, and then, the solvent was removed under vacuum. Finally, the resultant product was obtained and washed with CH2Cl. The organic layer was dried over anhydrous magnesium sulphate.2.5. Preparation of RhB-5-chlorosalicylaldehyde–APTES
Typically, 0.46 g of RhB–NH2 was dissolved in 30 ml of ethanol and 4 mmol of 5-chlorosalicyladehyde was added dropwise to the solution. The mixture was refluxed for 8 h and allowed to cool down to room temperature. To the mixture, 10 ml of ethyl acetate was added, and then, the mixture was kept in a refrigerator overnight. The material was washed with distilled water followed by ethanol and dried at 65 °C. After the resulting material RhB-5-chlorosalicylaldehyde (0.270 g, 1.0 mmol) was obtained and reacted with (0.241 g, 0.1 mmol) APTES, K2CO3 (0.138 g, 1.0 mmol) in 30 ml acetonitrile was slowly added to the solution mixture that was then refluxed for 8 h. Finally, the product was purified by column chromatography with ethyl acetate![[thin space (1/6-em)]](https://www.rsc.org/images/entities/char_2009.gif) :
:![[thin space (1/6-em)]](https://www.rsc.org/images/entities/char_2009.gif) hexane solvent.
hexane solvent.
2.6. Synthesis of RhB–Fe3O4/MnO2/SiO2/KCC-1
In a typical synthesis, 200 mg of Fe3O4/MnO2/SiO2/KCC-1 was dissolved in 40 ml of toluene, and 200 mg of RhB–Si was added. The mixture was stirred for 12 h under a nitrogen atmosphere. The resulting product was separated by a strong magnet and washed several times with 30 ml of different solvents, including toluene, dichloromethane, and ethanol, each time. The purified product was dried at 60 °C and then used for further analysis.3. Results and discussion
3.1. Design and analysis of the hybrid sensor
The synthesis of rhodamine-based receptor and functionalized mesoporous magnetic core–shell fibrous silica KCC-1 involves several steps, as outlined in Scheme 1. The main aim of this study was to identify the ability of the hybrid sensor I towards the detection of Cu(II) ion over other metal ions and the recovery of this sensor. To achieve an effective sensing system, the design of multicore–shell is architectured in a way that paramagnetic microspheres of iron oxide core (Fe3O4) are deposited with nanosized manganese oxide (MnO2) to prevent aggregation and dipole interaction between magnetic nanoparticles. It is found that Fe3O4 provides an effortless magnetic separation and increases the durability of the material. The modified deposited MnO2 nanoparticles have a high acid etching resistance, are stable in organic solvents such as methanol, and also closely interact with Fe3O4.30,31 To avoid the solubility of the core–shell Fe3O4/MnO2 in water, a multistep strategy is engaged to deposit dense silica on the surface. SiO2 provides stability to the inner core, and its uniform surface supports the growth of fibrous silica. Very importantly, the thickness of the fabricated silica prevents the fluorescence energy transfer process (FRET) between the magnetic core–shell and the fluorophore.32 Finally, the nanocomposite (Fe3O4/MnO2/SiO2) is modified with fibrous silica on the outer surface. The fibrous mesoporous silica surface could be easily functionalized with a silane reagent (APTES), on the surface moieties, such that sensing molecules of rhodamine B derivatives are uniformly covered on the silica surface. The functionalized modified nanocomposite is a suitable solid base material with a better dispersibility. The importance of this hybrid sensor I is that it has electron rich species, such as carbonyl (O), imino (N), and phenol (O) atoms, which effectively and selectively binding with Cu(II) over other metal ions. The spirolactam ring-opening upon binding with cation to enhance the fluorescence is a special feature of the hybrid sensor I to create a barrier for quenching and improving the sensing performance of Cu(II).3.2. Characterization
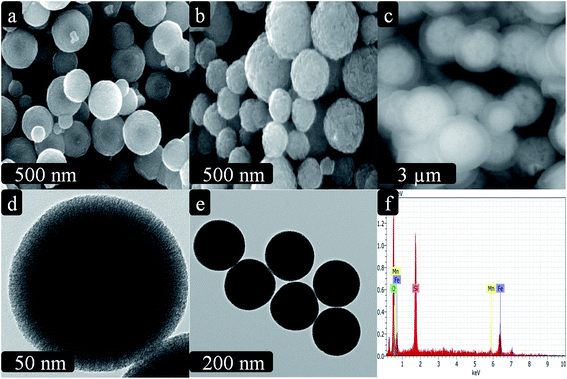
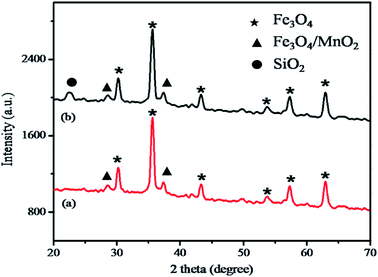
The morphology of the hybrid magnetic core–shell fibrous silica nanocomposite was observed by SEM and TEM, as shown in Fig. 1a–f. The Fe3O4 nanoparticles exhibited a spherical shape with a diameter of about 480 nm (Fig. 1a). After coating by amorphous MnO2, the average diameter of Fe3O4/MnO2 nanocomposite increased to 620 nm. This clearly indicates that uniform and well-dispersed spherical structures were formed without aggregation (Fig. 1b). After this, successful coating of magnetic nanocomposite with fibrous silica was clearly observed in Fig. 1c. Furthermore, in the TEM images (Fig. 1d and e), the fibrous structure of the parent KCC-1 clearly shows the unique fibrous surface with a spherical shape (Fig. 1d). As shown in Fig. 1e, the inner surface clearly shows the core shell modification (Fe3O4/MnO2/SiO2/KCC-1) compared to that of parent KCC-1. In Fig. 1e, the black inner surface in the core–shell is represented by Fe3O4/MnO2 and gray-coloured outer surface is represented by fibrous silica that is covered all over the surface. The EDS elemental analysis of fibrous silica Fe3O4/MnO2/SiO2/KCC-1 exhibited the presence of Fe, Mn, Si, and O (Fig. 1f), further indicating the formation of the hybrid core–shell magnetic fibrous silica nanocomposite.The X-ray diffraction (XRD) pattern was obtained to investigate the formation of Fe3O4/MnO2 and Fe3O4/MnO2/SiO2/KCC-1. As shown in Fig. 2a, the characteristic diffraction peaks of the magnetic nanocomposite located at 30.17°, 35.51°, 43.10°, 53.75°, 57.32°, and 62.89° can be attributed to the (220), (311), (400), (422), (511), and (440) crystal planes, respectively, which represent the inverse spinal structure of Fe3O4 nanoparticles (JCPDS card no. 19-0629).33 Moreover, the well-resolved diffraction peaks at around 28.6° and 37.3° indicated the presence of MnO2.34 As displayed in Fig. 2b, the broad diffraction peak at around 22.48° indicated the growth of fibrous silica on the surface of Fe3O4/MnO2 nanocomposite.35
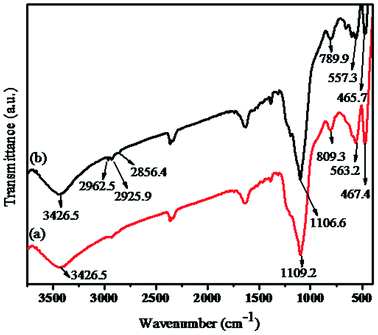
FT-IR analysis has been performed on Fe3O4/MnO2/SiO2/KCC-1 and the hybrid sensor I. As shown in Fig. 3a, the absorption band at 563.2 cm−1 is assigned to the Fe–O–Fe stretching and bending mode, and no characteristic peaks for the amorphous MnO2 are observed. The vibration peaks of fibrous mesoporous silica at 467.4 cm−1, 809.3 cm−1, and 1092.5 cm−1 are assigned to the symmetric and asymmetric stretching of the Si–O–Si bonds. The strong absorption peak at 3426.5 cm−1 is assigned to the hydroxyl groups. As shown in Fig. 3b, new bands at 2856.4 cm−1, 2925.9 cm−1, and 2962.5 cm−1 can be assigned to the stretching vibration of methylene and amide group,36,37 which confirm that rhodamine B derivatives have been functionalized with hybrid core–shell magnetic fibrous silica nanocomposite.
Nitrogen adsorption/desorption isotherm reveals the surface modification for the hybrid sensor I. Upon investigation, it was observed that the magnetic nanocomposite and rhodamine-functionalized nanocomposite showed a modified textural property and surface area, as shown in Fig. 4. For the Fe3O4/MnO2/SiO2/KCC-1 and RhB–Fe3O4/MnO2/SiO2/KCC-1 nanocomposite, the BET surface area was 225.08 and 69.25 m2 g−1, the pore diameter was 7.96 and 6.74 nm, and the pore volume was 0.56 and 0.13 cm g−1, respectively. These results describe the effective functionalization of the organic probe on the surface of the fibrous nanocomposite.
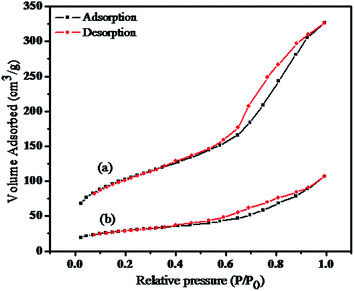 | ||
| Fig. 4 The nitrogen adsorption–desorption isotherms of (a) Fe3O4/MnO2/SiO2/KCC-1 and (b) RhB–Fe3O4/MnO2/SiO2/KCC-1. | ||
As shown in Fig. 5a–d, the magnetic measurements of pristine Fe3O4, Fe3O4/MnO2, Fe3O4/MnO2/SiO2/KCC-1, and the hybrid sensor I were 56.09, 32.6, 13.0, and 6.9 emu g−1, respectively. All samples exhibited super paramagnetic behaviour at room temperature. The magnetic saturation value decreased from Fig. 5a to d due to the increase in the diameter of the outer surface of Fe3O4 nanoparticles and the presence of the organic molecule. As a result, the functionalized core–shell nanocomposite can rapidly redisperse and prevent the aggregation of nanoparticles. It can be observed that the hybrid sensor I can be homogeneously dispersed in different solvents and rapidly separated within 1 min by an external magnet, as illustrated in the inset of Fig. 5. In addition, the saturated magnetic behaviour of the hybrid sensor I acted as an effective barrier to the quenching fluorophore.
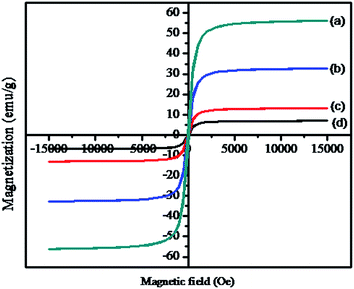 | ||
| Fig. 5 Magnetization curves of (a) Fe3O4, (b) Fe3O4/MnO2, (c) Fe3O4/MnO2/SiO2/KCC-1, and (d) RhB–Fe3O4/MnO2/SiO2/KCC-1. The inset image shows the magnetic separation behaviour of the hybrid sensor I. | ||
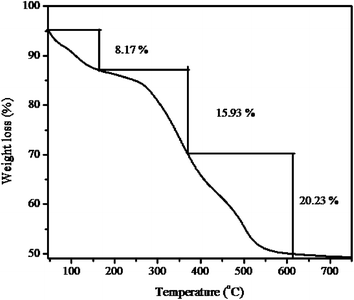
The stability of the hybrid sensor I was determined by TGA measurements in the temperature range from 50 to 615 °C at a heating rate of 10 °C min−1 under a nitrogen atmosphere. As shown in Fig. 6, the curve exhibits three-step weight loss over the temperature ranges of 50–165 °C, 166–367 °C, and 368–615 °C. The first weight loss of 8.17% was predominantly due to the removal of physically absorbed water and organic solvent. The second weight loss of 15.93% was attributed to the thermal decomposition of functionalized organic compounds. The final weight loss of 20.23% was due to the complete decomposition of the whole nanocomposite. Total weight loss was about 44.86% in the temperature range from 50 to 615 °C. The TGA results of the hybrid sensor I demonstrate that it has a superior thermal stability at high temperatures.
3.3. Sensing performance
![[thin space (1/6-em)]](https://www.rsc.org/images/entities/char_2009.gif) :
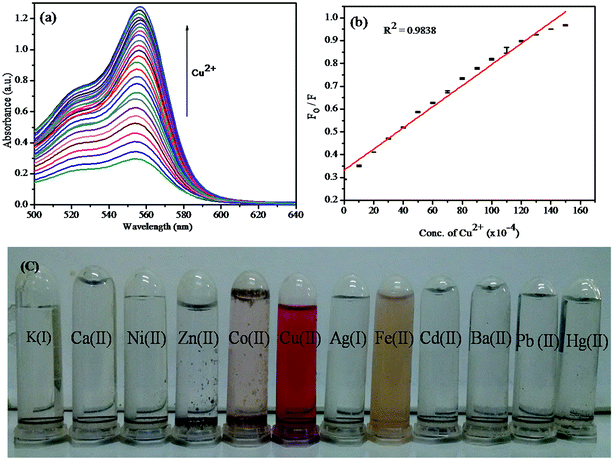
:![[thin space (1/6-em)]](https://www.rsc.org/images/entities/char_2009.gif) 1, v/v) was preferred for UV-vis detection process. After the addition of various metal ions (K(I), Ag(I), Ca(II), Ni(II), Hg(II), Pb(II), Zn(II), Co(II), Ba(II), Fe(II), and Cd(II)) in the form of their nitrates, only copper ion showed a higher response than other metal ions such as Fe(II) and Co(II), as shown in Fig. 7c. Upon increasing the concentration of Cu(II) ion in the solution in the range of 0–5 × 10⁻⁴ M, the hybrid sensor I turned from colourless to pink with a significant enhancement of a new absorbance peak centred at 556 nm, and a smaller peak at 522 nm was obtained. This proves the selectivity of Cu(II) ion towards the binding site. The significant appearance of colour and the enhancement of absorbance peak indicate the ring-opened amide form of the probe.38 These results indicate that the hybrid sensor I can be used for the rapid determination of Cu(II) by the naked eye. The titration for Cu(II) concentration variation showed a better linear relationship (R2 = 0.9838), as shown in Fig. 7b. The detection limit was found to be 26.40 nM. The data obtained from the Stern–Volmer plot suggested that the synthesized material had a good selectivity for Cu(II) ion.
1, v/v) was preferred for UV-vis detection process. After the addition of various metal ions (K(I), Ag(I), Ca(II), Ni(II), Hg(II), Pb(II), Zn(II), Co(II), Ba(II), Fe(II), and Cd(II)) in the form of their nitrates, only copper ion showed a higher response than other metal ions such as Fe(II) and Co(II), as shown in Fig. 7c. Upon increasing the concentration of Cu(II) ion in the solution in the range of 0–5 × 10⁻⁴ M, the hybrid sensor I turned from colourless to pink with a significant enhancement of a new absorbance peak centred at 556 nm, and a smaller peak at 522 nm was obtained. This proves the selectivity of Cu(II) ion towards the binding site. The significant appearance of colour and the enhancement of absorbance peak indicate the ring-opened amide form of the probe.38 These results indicate that the hybrid sensor I can be used for the rapid determination of Cu(II) by the naked eye. The titration for Cu(II) concentration variation showed a better linear relationship (R2 = 0.9838), as shown in Fig. 7b. The detection limit was found to be 26.40 nM. The data obtained from the Stern–Volmer plot suggested that the synthesized material had a good selectivity for Cu(II) ion.
![[thin space (1/6-em)]](https://www.rsc.org/images/entities/char_2009.gif) :
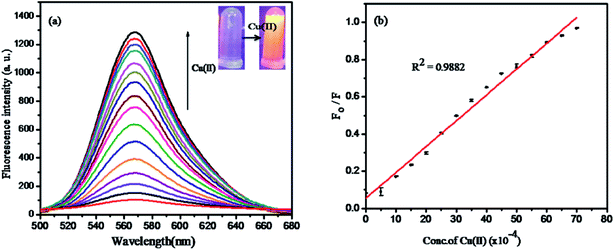
:![[thin space (1/6-em)]](https://www.rsc.org/images/entities/char_2009.gif) 1, v/v) system was carried out with Cu(II) in the concentration range of 0–5 × 10⁻⁴ M. As shown in Fig. 8a, the emission band of the hybrid sensor I (5 μM) exhibited a weak fluorescence at 569 nm (λex 520 nm), which was attributed to the close ring spirolactam form of the probe with a photo induced electron-transfer (PET) process that was induced by nitrogen atoms bonded to a hydrogen atom. The fluorescence emission intensity was enhanced around 569 nm with the increase in Cu(II) ion concentration. The rhodamine derivative coordinated with Cu(II); this led to the spirolactam ring-untie mechanism,39,40 which was associated with a switch on UV-vis spectral response at 556 nm and the emission response at 569 nm.
1, v/v) system was carried out with Cu(II) in the concentration range of 0–5 × 10⁻⁴ M. As shown in Fig. 8a, the emission band of the hybrid sensor I (5 μM) exhibited a weak fluorescence at 569 nm (λex 520 nm), which was attributed to the close ring spirolactam form of the probe with a photo induced electron-transfer (PET) process that was induced by nitrogen atoms bonded to a hydrogen atom. The fluorescence emission intensity was enhanced around 569 nm with the increase in Cu(II) ion concentration. The rhodamine derivative coordinated with Cu(II); this led to the spirolactam ring-untie mechanism,39,40 which was associated with a switch on UV-vis spectral response at 556 nm and the emission response at 569 nm.
The Stern–Volmer plot, which expresses the linear relationship between F0/F values (where F0 and F indicate the presence and absence of Cu(II) ion at 569 nm) and the Cu(II) concentration in the range of 0–5 × 10⁻⁴ M with the correlation coefficient R2 = 0.9882 is shown in Fig. 8b. The detection limit was calculated by the 3σ/k method (where σ is the standard deviation of the blank measurement and k is the slope) to be about 12.3 × 10⁻⁸ M, which was comparable to that of other methods (Table 1). Moreover, the linear relationship data fitting with Stern–Volmer plot expressed the 1![[thin space (1/6-em)]](https://www.rsc.org/images/entities/char_2009.gif) :
:![[thin space (1/6-em)]](https://www.rsc.org/images/entities/char_2009.gif) 1 complex formation.
1 complex formation.
| Materials | Detection methods | Working range (M) | LOD | Ref. no. |
|---|---|---|---|---|
| SBA-15 | Colorimetric sensor | 0.01–1.0 × 10⁻⁶ | 0.015 × 10⁻⁶ | 43 |
| SBA-15 | Electrochemical sensor | 8.0–100.0 × 10⁻⁷ | 2.0 × 10⁻⁷ | 44 |
| SBA-15 | Fluorescence chemosensor | 0–50 × 10−6 | 0.1 × 10⁻⁶ | 45 |
| HOM-11 | Colorimetric sensor | 1.57 × 10⁻⁸ to 7.86 × 10⁻⁶ | 3.1 × 10⁻⁸ | 46 |
| Silica nanoparticles | Colorimetric sensor | 0–6.0 × 10⁻⁴ | 2.13 × 10⁻⁶ | 47 |
| SBA-15 | Optical sensor | — | 3.2 × 10⁻⁶ | 48 |
| KCC-1 | Fluorescence chemosensor | 0–5 × 10⁻⁴ | 12.3 × 10⁻⁸ | Present wok |
![[thin space (1/6-em)]](https://www.rsc.org/images/entities/char_2009.gif) :
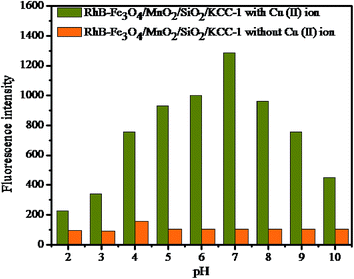
:![[thin space (1/6-em)]](https://www.rsc.org/images/entities/char_2009.gif) 1, v/v) with a buffer solution is highly accurate and reliable.
1, v/v) with a buffer solution is highly accurate and reliable.
| Samples | Spiked [Cu(II)]/(μM) | Found Cu(II)/(μM) | Recovery (%) | RSD (%) |
|---|---|---|---|---|
| Tap water | 2 | 1.99 | 99.5 | 1.24 |
| River water | 4 | 3.98 | 99.5 | 2.23 |
| Pond water | 6 | 6.05 | 101 | 1.03 |
| Industrial waste water | 8 | 3.99 | 99.8 | 1.99 |
4. Conclusion
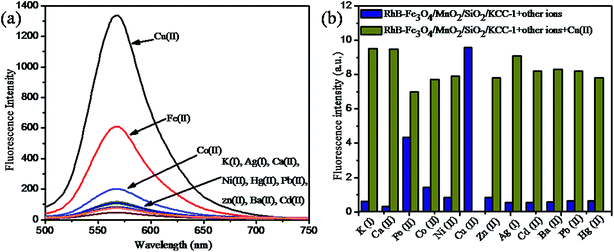
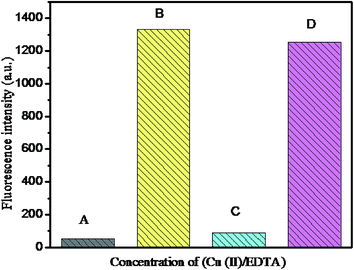
We have successfully prepared a hybrid magnetic core–shell fibrous silica nanocomposite and covalently functionalized it with a rhodamine-based derivative. The rhodamine-based derivative was modified with nitrogen and oxygen atoms, which strongly bonded to Cu(II) ion, playing a critical role in the selective detection of Cu(II) ion. This hybrid sensor exhibited significantly improved sensing ability towards Cu(II) ion with high sensitivity and selective fluorescence responses in an aqueous solution. The detection limit was found to be 12.3 × 10⁻⁸ M, which was superior to that of the previously reported Cu(II) detection methods. In addition, this hybrid sensing system recovered 95% original fluorescence sensing signal for the detection of Cu(II) ion. The abovementioned results demonstrated the successful use of this nanocomposite for the detection of Cu(II) in the environmental real samples. Thus, this simple and reliable hybrid sensor can be used for Cu(II) ion detection in aqueous solutions.Conflicts of interest
There are no conflicts to declare.Acknowledgements
This work was financially supported by the SRM University, Department of Chemistry, Tamil Nadu, India.References
- E. Gaggelli, H. Kozlowski, D. Valensin and G. Valensin, Chem. Rev., 2006, 106, 1995 CrossRef CAS PubMed
.
- K. J. Barnham, C. L. Masters and A. I. Bush, Nat. Rev. Drug Discovery, 2004, 3, 205 CrossRef CAS PubMed
.
- M. Wang, K. H. Leung, S. Lin, D. S. Chan, D. W. J. Kwong, C. H. Leung and D. L. Ma, Sci. Rep., 2014, 4, 6794 CrossRef CAS PubMed
.
- S. V. Wegner, H. Arslan, M. Sunbul, J. Yin and C. He, J. Am. Chem. Soc., 2010, 132, 2567 CrossRef CAS PubMed
.
- W. Cho, H. J. Lee, S. Choi, Y. Kim and M. Oh, Sci. Rep., 2014, 4, 1 Search PubMed
.
- Y. Zhao, X. Zhang, Z. Han, L. Qiao, C. Li, L. Jian, G. Shen and R. Yu, Anal. Chem., 2009, 81, 7022 CrossRef CAS PubMed
.
- M. A. Shenashen, S. A. EI-Safty and E. A. Elshehy, J. Hazard. Mater., 2013, 260, 833 CrossRef CAS PubMed
.
- Z. Sun, D. Guo, L. Z. Haizhen Li, B. Yang and S. Yan, J. Mater. Chem. B, 2015, 3, 3201 RSC
.
- J. Yeh, W. Chen, S. Liu and S. Wu, New J. Chem., 2014, 38, 4434 RSC
.
- S. Li, X. Chen, W. Ma, Z. Ding, C. Zhang, Z. Chen, X. He, Y. Shang and Y. Zou, Sci. Rep., 2016, 6, 36654 CrossRef CAS PubMed
.
- D. Bagal-Kestwal, M. S. Karve, B. Kakade and V. K. Pillai, Biosens. Bioelectron., 2008, 24, 657 CrossRef CAS PubMed
.
- T. Radu and D. Diamond, J. Hazard. Mater., 2009, 171, 1168 CrossRef CAS PubMed
.
- A. R. Thiruppathi, B. Sidhueddy, W. Keeler and A. Chen, Electrochem. Commun., 2017, 76, 42 CrossRef CAS
.
- Y. Fang, Y. Zhou, Q. Rui and C. Yao, Organometallics, 2015, 34, 2962 CrossRef CAS
.
- A. K. Mahapata, S. K. Manna, D. Mandal and C. D. Mukhopadhyay, Inorg. Chem., 2013, 52, 10825 CrossRef PubMed
.
- X. Meng, Y. Xu, J. Liu, L. Sun and L. Shi, Anal. Methods, 2015, 8, 1044 RSC
.
- F. Huo, C. Yin, Y. Yang, J. Su, J. Chao and D. Liu, Anal. Chem., 2012, 84, 2219 CrossRef CAS PubMed
.
- L. Huang, X. Wang, G. Xie, P. Xi, Z. Li, M. Xu, Y. Wu, D. Bai and Z. Zeng, Dalton Trans., 2010, 39, 7894 RSC
.
- M. Zhao, X. Yang, S. He and L. Wang, Sens. Actuators, B, 2009, 135, 625 CrossRef CAS
.
- S. M. Sadeghzadeh, RSC Adv., 2016, 6, 75973 RSC
.
- Y. Wang, B. Li, L. Zhang, L. Liu, Q. Zuo and P. Li, New J. Chem., 2010, 34, 1946 RSC
.
- Y. Wang, B. Li, L. Zhang, P. Li, L. Wang and J. Zhang, Langmuir, 2012, 28, 1657 CrossRef CAS PubMed
.
- L. Zhao, D. Sui and Y. Wang, RSC Adv., 2015, 21, 16611 RSC
.
- P. Pal, S. K. Rastogi, C. M. Gibson, D. E. Aston, A. L. Branen and M. E. Bitterwolf, ACS Appl. Mater. Interfaces, 2011, 3, 279 CAS
.
- H. Zhang, P. Zhang, K. Ye, Y. Sun, S. Jiang, Y. Wang and W. Pang, J. Lumin., 2006, 117, 68 CrossRef CAS
.
- Z. Sun, H. Li, D. Guo, J. Sun, G. Cui, Y. Liu, Y. Tian and S. Yan, J. Mater. Chem. C, 2015, 3, 4713 RSC
.
- N. Bayal, B. Singh, R. Singh and V. Polshettiwar, Sci. Rep., 2016, 6, 1 CrossRef PubMed
.
- S. Wang, K. Wang, C. Dai, H. Shi and J. Li, Chem. Eng. J., 2015, 62, 897 CrossRef
.
- L. Dong, C. Wu, X. Zeng, L. Mu, S. Xue, Z. Tao and J. Zhang, Sens. Actuators, B, 2010, 145, 433 CrossRef CAS
.
- Z. Zhao, J. Liu, F. Cui, H. Feng and L. Zhang, J. Mater. Chem., 2012, 22, 9052 RSC
.
- J. Sun, J. Zhuang, S. Guan and W. Yang, J. Nanopart. Res., 2008, 10, 653 CrossRef CAS
.
- T. Gulin-Sarfraz, J. Zhang, D. Desai, J. Teuho, J. Sarfraz, H. Jiang, C. H. Zhang, C. Sahlgren, M. Linden, H. Coeen Gu and J. M. Rosenholm, Biomater. Sci., 2014, 2, 1750 RSC
.
- S. M. Sadeghzadeh, RSC Adv., 2016, 6, 75973 RSC
.
- L. Zhang, J. Lian, L. Wu, Z. Duan, J. Jian and L. Zhao, Langmuir, 2014, 30, 7006 CrossRef CAS PubMed
.
- Y. Wang, X. Peng, J. Shi, X. Tang, J. Jiang and W. Liu, Nanoscale Res. Lett., 2012, 7, 1 CrossRef PubMed
.
- Y. Wang, X. Peng, J. Shi, X. Tang, J. Jiang and W. Liu, Nanoscale Res. Lett., 2010, 7, 86 CrossRef PubMed
.
- Z. Sun, D. Guo, L. Z. Haizhen Li, B. Yang and S. Yan, J. Mater. Chem. B, 2015, 3, 3201 RSC
.
- X. W. Cheng, Y. Zhou, Y. Fang, Q. Rui and C. Yao, RSC Adv., 2015, 5, 19465 RSC
.
- P. Zhou, Q. Meng, G. He, H. Wu, C. Duan and X. Quan, J. Environ. Monit., 2009, 11, 648 RSC
.
- X. Zeng, Y. Xu, X. Chen, W. Ma and Y. Zhou, Appl. Surf. Sci., 2017, 423, 1103 CrossRef CAS
.
- X. Qiu, S. Han, Y. Hu, M. Gao and H. Wang, J. Mater. Chem. A, 2014, 2, 1493 CAS
.
- X. Tian, Z. Dong, R. Wang and J. Ma, Sens. Actuators, B, 2013, 186, 446 CrossRef
.
- Z. Wang, M. Wang, G. Wu, D. Wu and A. Wu, Dalton Trans., 2014, 43, 8461 RSC
.
- I. Cesarino, G. Marino, J. D. Rosario Matos and E. T. Gomes Cavalheiro, Talanta, 2008, 75, 15 CrossRef CAS PubMed
.
- L. Gao, J. Q. Wang, L. Huang, X. X. Fan, J. H. Zhu, Y. Wang and Z. G. Zou, Inorg. Chem., 2007, 46, 10287 CrossRef CAS PubMed
.
- S. A. El-Safty, A. A. Ismail and A. Shahat, Talanta, 2011, 83, 1341 CrossRef CAS PubMed
.
- L. Li, H. Sun, C. Fang, J. Xu, J. Y. Jin and C. Yan, J. Mater. Chem., 2007, 17, 4492 RSC
.
- D. B. Kim, J. M. Hong and S. Chang, Sens. Actuators, B, 2017, 252, 537 CrossRef CAS
.
| This journal is © The Royal Society of Chemistry 2017 |

