 Open Access Article
Creative Commons Attribution 3.0 Unported Licence
Construction of full-spectrum-driven Ag–g-C3N4/W18O49 heterojunction catalyst with outstanding N2 photofixation ability
Hongyu Liang,
Jianzhong Li * and
Yanwen Tian*
School of Metallurgy, Northeastern University, Shenyang 110819, China. E-mail: lijianzhongnu@163.com
First published on 5th September 2017
Abstract
More than half of the solar spectrum is near infrared (NIR) light, which is seldom utilized in photocatalytic reactions. In this work, an Ag–g-C3N4/W18O49 heterojunction catalyst is prepared and used for full-spectrum-driven N2 photofixation from the UV to the NIR region for the first time. X-ray diffraction, N2 adsorption, UV-Vis-NIR spectroscopy, thermogravimetric analysis, photoluminescence, X-ray photoelectron spectroscopy and electrochemical impedance spectra were used to characterize the prepared catalysts. The result indicates that the as-prepared Ag–g-C3N4/W18O49 heterojunction catalysts display much higher N2 photofixation performance than that of individual W18O49 or Ag–g-C3N4, which should be due to the better separation rate of electron–hole pairs and more efficient light utilization. g-C3N4 is the active component in the catalyst for N2 photofixation. Ag loading promotes the separation rate of electron–hole pairs. W18O49 plays a role as light absorber in the full-spectrum to form more photogenerated electrons for recombining the holes in the g-C3N4 through “Z-scheme” mechanism. A possible electrons transfer route is proposed.
Introduction
Energy issues are one of the problems that need to be solved in today's world. With the increasing demands of environmental regulations, traditional fossil fuels are being gradually replaced by new clean energy sources such as wind, solar, nuclear, etc. By using sunlight to drive a series of important chemical reactions, semiconductor photocatalytic oxidation technology can convert low-density solar energy into high-density chemical energy or mineralize organic pollutants directly. So this technology shows great potential in addressing energy shortages and environmental pollution.1–4 According to the solar spectrum, sunlight is composed of 5% ultraviolet (below 400 nm), 43% visible light (400–750 nm), and 52% near infrared (NIR, above 750 nm).5 Despite that great efforts have been made to broaden the photoresponsive region of photocatalysts to utilize as much solar energy as possible, near infrared light has seldom been utilized in previous work.6–12Nitrogen is a necessary element for the growth of plants and animals. Therefore, nitrogen fixation is the most important chemical reaction in nature after photosynthesis. At present, the use of the Haber method as an industrial nitrogen fixation process has reached an annual level of 100 million tons. This method requires high temperature and pressure as well as the presence of hydrogen. Not only are the raw material costs and energy consumption high for this process, there is a certain risk. In 1977, Schrauzcr et al. for the first time found that Fe-doped TiO2 powder can photocatalytically reduce nitrogen to form ammonia.13 The standard redox potential for N2/NH3 = −0.0922 V against NHE. Since then, many photocatalysts, such as precious metals supported on TiO2, Fe2Ti2O7, graphite-phase carbon nitride, bismuth oxyhalide and polymetallic sulfide, have been reported successively.14–18 However, because the photocatalytic nitrogen fixation is not a thermodynamically spontaneous reaction, the N2 photofixation abilities of these catalysts are not satisfactory.
Recently, graphitic carbon nitride (g-C3N4) has attracted a great deal of interest in photocatalytic applications. The heptazine ring structure and high condensation degree grant it many advantages, such as good chemical stability, an appropriate band gap energy and a unique electronic structure. All of these render g-C3N4 the best candidate for photocatalytic applications such as pollutant degradation,19 water reduction and oxidation20 CO2 capture,21 N2 photofixation22 and organic synthesis.23 However, the shortcomings of g-C3N4 are as obvious as its advantages, including a low visible light utilization efficiency and rapid recombination of the photogenerated electron–hole pairs. Noble metal loading, such as Pt, Pd, Rh, Ru and Ag, is a effective method to promote the electron–hole separation rate. Ag, as a relatively inexpensive noble metal cocatalyst, plays a good role in promoting the photoelectron migration, which has been widely used in photocatalytic H2 production, CO2 and heavy metal reduction.24–26 Not only that, it has been reported that noble metal (Pt, Pd, Rh, Ru) modification could promote the photocatalytic N2 fixation ability of TiO2 catalyst. The results show that the NH4+ yield is related to the strength of the metal–hydrogen bond. However, to the best of our knowledge, no literature concerning Ag loaded photocatalyst for nitrogen fixation is reported. Building heterojunction, as one of the solutions, has also been widely investigated.27–34 The photogenerated electrons of a component across the heterojunction to recombine with the holes generated in another component. The remaining electrons and holes will be located on two different components, thus the separation rate is promoted. However, it is not easy for electrons to across the heterojunction because of the poor interaction between two components, leading to that the separation efficiency is not as good as expected. Thus it is imagined that if the heterojunction catalyst can have higher light absorption ability, more photoelectrons will be excited to across the heterojunction.
Monoclinic W18O49, as the only oxide isolated in a single phase, has been extensively studied as photocatalyst in recent years.6,35–37 W18O49 has a suitable band gap energy, as well as a large number of oxygen vacancies, which can provide active sites for reaction substrate.38,39 Not only that, because of the presence of mixed-valence W ions, W18O49 shows strong absorption in near infrared light.40 Thus, it is imagined that coupling W18O49 with other semiconductor to construct heterojunction catalyst can not only improve the solar utilization, especially in near infrared region, but depress recombination of the photogenerated electron–hole pairs. Guo et al. prepared W18O49 sensitized TiO2 spheres with full-spectrum-driven photocatalytic dye degradation activities from UV to near infrared.6 The as-prepared heterojunction catalyst displayed strong optical absorption in the whole region of 300–2500 nm, thus shows desired photocatalytic properties for the full utilization of all solar energy. W5+ site in W18O49 played important role on photocatalytic performance. Chang et al. prepared Ag/AgCl/W18O49 nanorods heterostructures.12 The promoted photocatalytic antibacterial activity can be attributed to both the surface plasmon resonance of noble metal and the synergistic effect of plasmonic photocatalyst and oxide semiconductor photocatalyst. In this work, Ag–g-C3N4/W18O49 heterojunction catalyst is prepared and used for full-spectrum-driven N2 photofixation from UV to NIR region for the first time. The effect of NIR light on the N2 photofixation ability over as-prepared catalysts is investigated by using combined light source. The as-prepared composite shows much higher NH4+ generation rate than that of single W18O49 or Ag–g-C3N4. The effect of NIR light on the N2 photofixation ability over as-prepared heterojunction catalyst is investigated. The possible reaction mechanism and electrons transfer route are proposed.
Experimental
Preparation and characterization
W18O49 was prepared as follow. A certain amount of WCl6 was dissolved in 50 mL of ethanol to form a 15 mM solution. This solution was transferred into a Teflon-lined autoclave and heated at 200 °C for 24 h. The obtained solid was collected by centrifugation and washed repeatedly with water and ethanol, followed by drying at 80 °C. Neat g-C3N4 was prepared by heating melamine at 550 °C for 4 h at the rate of 5 °C min−1 under Ar atmosphere and denoted as gCN. 1 g of gCN was dispersed into 50 mL of water under stirring and ultrasonicated for 2 h. AgNO3 was added into above suspension. Then, a certain amount of sodium borohydride was added (molar ratio AgNO3/sodium borohydride = 1![[thin space (1/6-em)]](https://www.rsc.org/images/entities/char_2009.gif) :
:![[thin space (1/6-em)]](https://www.rsc.org/images/entities/char_2009.gif) 5) and stirred for 2 h. The product was washed by water and ethanol for several times, dried at 60 °C and denoted as Ag(x%)–gCN, where x% stands for the mass percentage of Ag.
5) and stirred for 2 h. The product was washed by water and ethanol for several times, dried at 60 °C and denoted as Ag(x%)–gCN, where x% stands for the mass percentage of Ag.
For Ag–g-C3N4/W18O49 composite, Ag(1%)–gCN and W18O49 (mass ratio = 4![[thin space (1/6-em)]](https://www.rsc.org/images/entities/char_2009.gif) :
:![[thin space (1/6-em)]](https://www.rsc.org/images/entities/char_2009.gif) 1, 2
1, 2![[thin space (1/6-em)]](https://www.rsc.org/images/entities/char_2009.gif) :
:![[thin space (1/6-em)]](https://www.rsc.org/images/entities/char_2009.gif) 1, 1
1, 1![[thin space (1/6-em)]](https://www.rsc.org/images/entities/char_2009.gif) :
:![[thin space (1/6-em)]](https://www.rsc.org/images/entities/char_2009.gif) 1 and 1
1 and 1![[thin space (1/6-em)]](https://www.rsc.org/images/entities/char_2009.gif) :
:![[thin space (1/6-em)]](https://www.rsc.org/images/entities/char_2009.gif) 2) were dispersed into 50 mL of ethanol under stirring and ultrasonicated for 2 h. After evaporating ethanol under low temperature, the obtained mixture was annealed at 500 °C for 2 h at the rate of 5 °C min−1 under Ar atmosphere. The obtained product was denoted as Ag(1%)–gCN/W18O49(4
2) were dispersed into 50 mL of ethanol under stirring and ultrasonicated for 2 h. After evaporating ethanol under low temperature, the obtained mixture was annealed at 500 °C for 2 h at the rate of 5 °C min−1 under Ar atmosphere. The obtained product was denoted as Ag(1%)–gCN/W18O49(4![[thin space (1/6-em)]](https://www.rsc.org/images/entities/char_2009.gif) :
:![[thin space (1/6-em)]](https://www.rsc.org/images/entities/char_2009.gif) 1), Ag(1%)–gCN/W18O49(2
1), Ag(1%)–gCN/W18O49(2![[thin space (1/6-em)]](https://www.rsc.org/images/entities/char_2009.gif) :
:![[thin space (1/6-em)]](https://www.rsc.org/images/entities/char_2009.gif) 1), Ag(1%)–gCN/W18O49(1
1), Ag(1%)–gCN/W18O49(1![[thin space (1/6-em)]](https://www.rsc.org/images/entities/char_2009.gif) :
:![[thin space (1/6-em)]](https://www.rsc.org/images/entities/char_2009.gif) 1) and Ag(1%)–gCN/W18O49(1
1) and Ag(1%)–gCN/W18O49(1![[thin space (1/6-em)]](https://www.rsc.org/images/entities/char_2009.gif) :
:![[thin space (1/6-em)]](https://www.rsc.org/images/entities/char_2009.gif) 2), respectively. In order to investigate the effect of NIR light on the photocatalytic N2 fixation ability of as-prepared heterojunction catalysts, W18O49 was annealed at 500 °C for 2 h in air to form WO3. Then WO3 was used to prepare the composite following the same procedure. The product was denoted as Ag(1%)–gCN/WO3(1
2), respectively. In order to investigate the effect of NIR light on the photocatalytic N2 fixation ability of as-prepared heterojunction catalysts, W18O49 was annealed at 500 °C for 2 h in air to form WO3. Then WO3 was used to prepare the composite following the same procedure. The product was denoted as Ag(1%)–gCN/WO3(1![[thin space (1/6-em)]](https://www.rsc.org/images/entities/char_2009.gif) :
:![[thin space (1/6-em)]](https://www.rsc.org/images/entities/char_2009.gif) 1).
1).
The XRD patterns were registered on a Rigaku D/max-2400 instrument using Cu-Kα radiation (λ = 1.54 Å). The optical properties were measured using a spectrophotometer (CARY5000), giving an output of transmittance from UV to NIR region. Thermogravimetric analysis (TG) was performed using a TGA-DSC 2 (Mettler-Toledo) instrument. Nitrogen adsorption was measured at −196 °C on a Micromeritics 2010 analyser. The BET surface area (SBET) was calculated based on the adsorption isotherm. The XPS measurements were carried out on a Thermo Escalab 250 XPS system with Al Kα radiation as the excitation source. The photoluminescence (PL) spectra were measured at room temperature with a fluorospectrophotometer (FP-6300) using a Xe lamp as the excitation source. Electrochemical impedance spectra (EIS) was registered via an EIS spectrometer (EC-Lab SP-150, BioLogic Science Instruments) in a three-electrode cell by applying 10 mV alternative signal versus the reference electrode (SCE) over the frequency range of 1 MHz to 100 mHz. The photocurrents were measured using an electrochemical analyzer (CHI 618C Instruments) equipped with a rectangular-shaped quartz reactor (20 × 40 × 50 mm) using a standard three-electrode system. The prepared sample film was used as the working electrode, a Pt flake was used as the counter electrode, and Ag/AgCl was used as the reference electrode. A 500 W Xe lamp was used to irradiate the working electrode from the back side. The light intensity on the working electrode was 120 mW cm−2.
Photocatalytic reaction
The nitrogen photofixation performance of prepared catalysts was evaluated according to previous work.41 The experiments were performed in a double-walled quartz reactor using 300 W Xe lamp and 200 W infrared light together as a simulated solar light source. Light of λ > 800 nm and λ < 800 nm was removed by optical filters for Xe lamp and infrared light, respectively. 0.2 g of catalyst was added to a 500 mL deionized water. Ethanol (0.789 g L−1) was added as a hole scavenger. The suspension was dispersed using an ultrasonicator for 10 min. 5 mL of the suspension were collected at given time intervals, and immediately centrifuged to separate the liquid samples from the solid catalyst. The concentration of NH4+ was measured using the Nessler's reagent spectrophotometry method (JB7478-87) with a UV-2450 spectrophotometer (Shimadzu, Japan).17,41Results and discussion
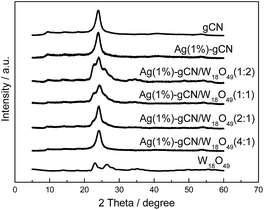
XRD patterns of as-prepared catalysts are shown in Fig. 1. W18O49 displays mainly two diffraction peaks, corresponding to the (0 1 0) and (2 1 0) crystal faces of the monoclinic W18O49 structure.42 For gCN, two diffraction peaks locate at 13.1° and 27.5°, which are assigned to the (1 0 0) and (0 0 2) crystal planes.43 For Ag(1%)–gCN, no Ag diffraction peak is observed, which is probably due to the low content and high dispersion. As expected, all XRD diffraction peaks of as-prepared heterojunction catalysts reveal a coexistence of W18O49 and gCN. Furthermore, the peak intensity of W18O49 increases with increasing W18O49 content.The optical property is a critical factor to influence the photocatalytic performance of materials. The powder absorbance spectra of as-prepared catalysts were given in Fig. 2a. gCN shows the typical absorption curve of semiconductor with the absorption edge of 460 nm. Ag(1%)–gCN shows the low visible light absorption because of the surface plasmon effect.44 For W18O49, it can be clearly seen that the blue sample exhibits strong optical absorption in the whole solar region of 250–1800 nm, especially for the NIR region from 750 to 1800 nm. Benefitting from the addition of W18O49, the as-prepared heterojunction catalysts display enhanced absorption in the whole solar region, accompanying with the color change from cambridge blue for Ag(1%)–gCN/W18O49(4![[thin space (1/6-em)]](https://www.rsc.org/images/entities/char_2009.gif) :
:![[thin space (1/6-em)]](https://www.rsc.org/images/entities/char_2009.gif) 1) to dark blue for Ag(1%)–gCN/W18O49(1
1) to dark blue for Ag(1%)–gCN/W18O49(1![[thin space (1/6-em)]](https://www.rsc.org/images/entities/char_2009.gif) :
:![[thin space (1/6-em)]](https://www.rsc.org/images/entities/char_2009.gif) 2). The TG analysis is shown in Fig. 2b. For gCN, the beginning temperature of the weight loss is approximately at 600 °C. The weight loss is 100% when the temperature rises to 750 °C, which is mainly attributed to the sublimation or decomposition of g-C3N4. For Ag(1%)–gCN/W18O49(1
2). The TG analysis is shown in Fig. 2b. For gCN, the beginning temperature of the weight loss is approximately at 600 °C. The weight loss is 100% when the temperature rises to 750 °C, which is mainly attributed to the sublimation or decomposition of g-C3N4. For Ag(1%)–gCN/W18O49(1![[thin space (1/6-em)]](https://www.rsc.org/images/entities/char_2009.gif) :
:![[thin space (1/6-em)]](https://www.rsc.org/images/entities/char_2009.gif) 1), the similar weight loss curve is obtained, whereas 53 wt% sample is remained. This remains should be WO3. The W18O49 content for Ag(1%)–gCN/W18O49(4
1), the similar weight loss curve is obtained, whereas 53 wt% sample is remained. This remains should be WO3. The W18O49 content for Ag(1%)–gCN/W18O49(4![[thin space (1/6-em)]](https://www.rsc.org/images/entities/char_2009.gif) :
:![[thin space (1/6-em)]](https://www.rsc.org/images/entities/char_2009.gif) 1), Ag(1%)–gCN/W18O49(2
1), Ag(1%)–gCN/W18O49(2![[thin space (1/6-em)]](https://www.rsc.org/images/entities/char_2009.gif) :
:![[thin space (1/6-em)]](https://www.rsc.org/images/entities/char_2009.gif) 1), Ag(1%)–gCN/W18O49(1
1), Ag(1%)–gCN/W18O49(1![[thin space (1/6-em)]](https://www.rsc.org/images/entities/char_2009.gif) :
:![[thin space (1/6-em)]](https://www.rsc.org/images/entities/char_2009.gif) 1) and Ag(1%)–gCN/W18O49(1
1) and Ag(1%)–gCN/W18O49(1![[thin space (1/6-em)]](https://www.rsc.org/images/entities/char_2009.gif) :
:![[thin space (1/6-em)]](https://www.rsc.org/images/entities/char_2009.gif) 2) measured by TG analysis is 21 wt%, 34.5 wt%, 53 wt% and 67.4 wt%, respectively.
2) measured by TG analysis is 21 wt%, 34.5 wt%, 53 wt% and 67.4 wt%, respectively.
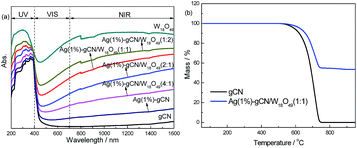 | ||
| Fig. 2 Powder absorbance spectra of as-prepared samples from UV to near infrared region (a) and TG analysis (b). | ||
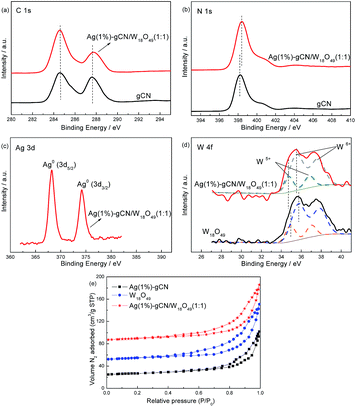
XPS is used to investigate the state of the elements on the catalyst surface (Fig. 3). In C 1s region, the peak with binding energy of 284.6 eV is assigned to the graphitic species in the CN matrix. The peak located at 287.9 eV should be attributed to the sp2 hybridized carbon atoms bonded to aliphatic amine.45,46 In N 1s region (Fig. 3b), the main peak located at 398.2 eV is attributed to sp2 hybridized nitrogen (C![[double bond, length as m-dash]](https://www.rsc.org/images/entities/char_e001.gif) N–C), confirming the structure of graphitic carbon nitride. The peak with binding energy of 400.4 eV is assigned to tertiary nitrogen (N–(C)3) groups.47 In Ag 3d region (Fig. 3c), two peaks located at 368.2 and 374.2 eV are assigned to the metallic Ag.48 For W 4f region (Fig. 3d), the spectra of W18O49 and Ag(1%)–gCN/W18O49(1
N–C), confirming the structure of graphitic carbon nitride. The peak with binding energy of 400.4 eV is assigned to tertiary nitrogen (N–(C)3) groups.47 In Ag 3d region (Fig. 3c), two peaks located at 368.2 and 374.2 eV are assigned to the metallic Ag.48 For W 4f region (Fig. 3d), the spectra of W18O49 and Ag(1%)–gCN/W18O49(1![[thin space (1/6-em)]](https://www.rsc.org/images/entities/char_2009.gif) :
:![[thin space (1/6-em)]](https://www.rsc.org/images/entities/char_2009.gif) 1) can be fitted with four contributions. Two peaks at 35.6 and 37.6 eV is attributed to W6+, and the other two peaks at 34.7 and 36.8 eV is assigned to W5+ or W4+.42,49 This result confirms the as-prepared catalyst is W18O49 but not WO3. In addition, no difference between gCN and Ag(1%)–gCN/W18O49(1
1) can be fitted with four contributions. Two peaks at 35.6 and 37.6 eV is attributed to W6+, and the other two peaks at 34.7 and 36.8 eV is assigned to W5+ or W4+.42,49 This result confirms the as-prepared catalyst is W18O49 but not WO3. In addition, no difference between gCN and Ag(1%)–gCN/W18O49(1![[thin space (1/6-em)]](https://www.rsc.org/images/entities/char_2009.gif) :
:![[thin space (1/6-em)]](https://www.rsc.org/images/entities/char_2009.gif) 1) can be observed in C 1s region. However, in the regions of N 1s and W 4f, ∼0.2 eV shifts are obviously shown. This hints the strong interaction between W18O49 and gCN exist. To characterize the specific surface area of as-prepared catalysts, the nitrogen adsorption and desorption isotherms were measured (Fig. 3e). The isotherms of all the samples are of classical type IV, suggesting the presence of mesopores. The BET specific surface areas (SBET) of gCN, Ag(1%)–gCN, W18O49, Ag(1%)–gCN/W18O49(4
1) can be observed in C 1s region. However, in the regions of N 1s and W 4f, ∼0.2 eV shifts are obviously shown. This hints the strong interaction between W18O49 and gCN exist. To characterize the specific surface area of as-prepared catalysts, the nitrogen adsorption and desorption isotherms were measured (Fig. 3e). The isotherms of all the samples are of classical type IV, suggesting the presence of mesopores. The BET specific surface areas (SBET) of gCN, Ag(1%)–gCN, W18O49, Ag(1%)–gCN/W18O49(4![[thin space (1/6-em)]](https://www.rsc.org/images/entities/char_2009.gif) :
:![[thin space (1/6-em)]](https://www.rsc.org/images/entities/char_2009.gif) 1), Ag(1%)–gCN/W18O49(2
1), Ag(1%)–gCN/W18O49(2![[thin space (1/6-em)]](https://www.rsc.org/images/entities/char_2009.gif) :
:![[thin space (1/6-em)]](https://www.rsc.org/images/entities/char_2009.gif) 1), Ag(1%)–gCN/W18O49(1
1), Ag(1%)–gCN/W18O49(1![[thin space (1/6-em)]](https://www.rsc.org/images/entities/char_2009.gif) :
:![[thin space (1/6-em)]](https://www.rsc.org/images/entities/char_2009.gif) 1) and Ag(1%)–gCN/W18O49(1
1) and Ag(1%)–gCN/W18O49(1![[thin space (1/6-em)]](https://www.rsc.org/images/entities/char_2009.gif) :
:![[thin space (1/6-em)]](https://www.rsc.org/images/entities/char_2009.gif) 2) are calculated to be 8.2, 8.3, 8.7, 8.8, 8.9, 8.5 and 8.4 m2 g−1. This indicates the as-prepared catalysts show the comparable SBET.
2) are calculated to be 8.2, 8.3, 8.7, 8.8, 8.9, 8.5 and 8.4 m2 g−1. This indicates the as-prepared catalysts show the comparable SBET.
Fig. 4 shows the morphology of as-prepared catalysts. It can be seen that the gCN shows the layered structure, similar to the analogue graphite (Fig. 4a). The morphology of W18O49 is nanorods, with the size of 2 μm length × 0.4 μm width (Fig. 4b). Fig. 4c shows that Ag(1%)–gCN/W18O49(1![[thin space (1/6-em)]](https://www.rsc.org/images/entities/char_2009.gif) :
:![[thin space (1/6-em)]](https://www.rsc.org/images/entities/char_2009.gif) 1) display two obvious different morphologies. The layered structure should be g-C3N4. These nanorods, which attached on the g-C3N4 surface, should be W18O49. The TEM image of Ag(1%)–gCN/W18O49(1
1) display two obvious different morphologies. The layered structure should be g-C3N4. These nanorods, which attached on the g-C3N4 surface, should be W18O49. The TEM image of Ag(1%)–gCN/W18O49(1![[thin space (1/6-em)]](https://www.rsc.org/images/entities/char_2009.gif) :
:![[thin space (1/6-em)]](https://www.rsc.org/images/entities/char_2009.gif) 1) displays that the Ag nanoparticles, with the size of 5 nm, are uniformly dispersed on the catalyst surface (Fig. 4d).
1) displays that the Ag nanoparticles, with the size of 5 nm, are uniformly dispersed on the catalyst surface (Fig. 4d).
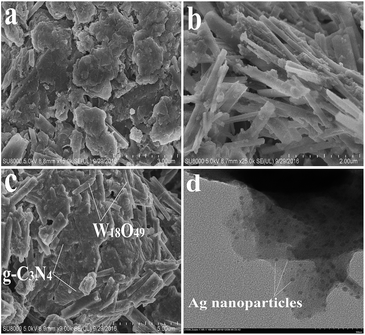 | ||
| Fig. 4 SEM images of gCN (a), W18O49 (b), Ag(1%)–gCN/W18O49(1 : 1) (c) and TEM image of Ag(1%)–gCN/W18O49(1 : 1) (d). | ||
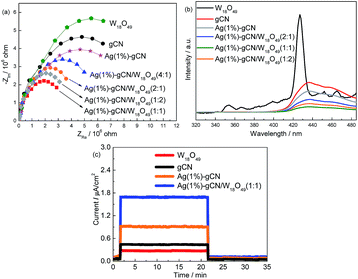
The effective separation of photogenerated electron–hole pairs can provide sufficient photoelectrons to reduce the N2 molecules. Fig. 5a shows the EIS spectra of as-prepared catalysts. W18O49 and gCN exhibit larger arc radius than other catalysts, suggesting a larger resistance of working electrodes, which is harmful to the charge transmission.50 Ag(1%)–gCN shows smaller arc radius than gCN, due to the promoted separation rate by Ag loading. For the as-prepared heterojunction catalysts, the arc radius are obviously reduced, indicating that more effective separation of photogenerated electron–hole pairs occurs. Ag(1%)–gCN/W18O49(1![[thin space (1/6-em)]](https://www.rsc.org/images/entities/char_2009.gif) :
:![[thin space (1/6-em)]](https://www.rsc.org/images/entities/char_2009.gif) 1) displays the most effective separation rate among the catalysts. Fig. 5b shows the PL spectra of as-prepared catalysts using excitation at 255 nm. W18O49 exhibits a emission peak centered at 430 nm, which was attributed to the intrinsic band to band transition emission. The week emissions around 350, 450 and 465 nm should be assigned to the defects such as oxygen vacancies.51 For gCN, broad PL band around 450 nm is observed with the energy of light approximately equal to the band gap of gCN. Such band–band PL signal is attributed to excitonic PL, which mainly results from the n–π* electronic transitions involving lone pairs of nitrogen atoms in g-C3N4.52 In the case of as-prepared heterojunction catalysts, the PL spectra show the similar shape to that of gCN, whereas the intensities are obviously decreased. Ag(1%)–gCN/W18O49(1
1) displays the most effective separation rate among the catalysts. Fig. 5b shows the PL spectra of as-prepared catalysts using excitation at 255 nm. W18O49 exhibits a emission peak centered at 430 nm, which was attributed to the intrinsic band to band transition emission. The week emissions around 350, 450 and 465 nm should be assigned to the defects such as oxygen vacancies.51 For gCN, broad PL band around 450 nm is observed with the energy of light approximately equal to the band gap of gCN. Such band–band PL signal is attributed to excitonic PL, which mainly results from the n–π* electronic transitions involving lone pairs of nitrogen atoms in g-C3N4.52 In the case of as-prepared heterojunction catalysts, the PL spectra show the similar shape to that of gCN, whereas the intensities are obviously decreased. Ag(1%)–gCN/W18O49(1![[thin space (1/6-em)]](https://www.rsc.org/images/entities/char_2009.gif) :
:![[thin space (1/6-em)]](https://www.rsc.org/images/entities/char_2009.gif) 1) shows the lowest PL intensity, hinting its most effective separation rate of electrons and holes. This is consistent with the EIS results. The photocurrent densities of as-prepared catalysts are also measured. As shown in Fig. 5c, neat gCN and W18O49 show the low photocurrent densities. After loading with Ag, the photocurrent density of Ag(1%)–gCN obviously improves. In the case of Ag(1%)–gCN/W18O49(1
1) shows the lowest PL intensity, hinting its most effective separation rate of electrons and holes. This is consistent with the EIS results. The photocurrent densities of as-prepared catalysts are also measured. As shown in Fig. 5c, neat gCN and W18O49 show the low photocurrent densities. After loading with Ag, the photocurrent density of Ag(1%)–gCN obviously improves. In the case of Ag(1%)–gCN/W18O49(1![[thin space (1/6-em)]](https://www.rsc.org/images/entities/char_2009.gif) :
:![[thin space (1/6-em)]](https://www.rsc.org/images/entities/char_2009.gif) 1), the photocurrent density further improves because of the formation of heterojunction.
1), the photocurrent density further improves because of the formation of heterojunction.
The influence of Ag content on nitrogen photofixation performance is presented in Table 1. The result shows that, without Ag loading, the NH4+ generation rate (r(NH4+)) for gCN is only 0.36 mg L−1 h−1 gcat−1. Ag(1%)–gCN display the highest r(NH4+), 0.57 mg L−1 h−1 gcat−1. Further increasing the Ag content causes the decreased r(NH4+) for Ag(2%)–gCN. This decreased photocatalytic activity results not only from an increased electrons–holes recombination but also from the trivial light shielding effect by strongly absorbing of Ag. Thus the optimal loading amount for Ag is 1 wt%.
| Ag content | 0 | 0.5 wt% | 1 wt% | 2 wt% |
|---|---|---|---|---|
| r(NH4+)/mg L−1 h−1 gcat−1 | 0.36 | 0.48 | 0.57 | 0.39 |
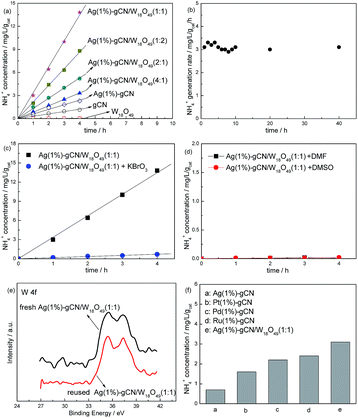
Fig. 6a displays the N2 photofixation ability over as-prepared catalysts. The control experiment indicates that the NH4+ concentrations are very low (<0.01 mg L−1 h−1 gcat−1) in the absence of photocatalyst, N2 or light irradiation. This hints that NH4+ is formed via a photocatalytic process. The r(NH4+) of neat W18O49 can be ignorant, hinting the active component in the heterojunction catalyst is not W18O49 but gCN. For gCN and Ag(1%)–gCN, the r(NH4+) is only 0.36 and 0.57 mg L−1 h−1 gcat−1 respectively, as mentioned in Table 1. The r(NH4+) over heterojunction catalyst increases obviously with increasing the W18O49 content. Ag(1%)–gCN/W18O49(1![[thin space (1/6-em)]](https://www.rsc.org/images/entities/char_2009.gif) :
:![[thin space (1/6-em)]](https://www.rsc.org/images/entities/char_2009.gif) 1) exhibits the highest r(NH4+), 3.2 mg L−1 h−1 gcat−1, which is 8.9-fold higher than that of neat gCN. According to the characterization results, this promoted N2 photofixation ability is attributed to the improved separation rate of electron–hole pairs and enhanced light absorption in the whole solar region. Ag(1%)–gCN/W18O49(1
1) exhibits the highest r(NH4+), 3.2 mg L−1 h−1 gcat−1, which is 8.9-fold higher than that of neat gCN. According to the characterization results, this promoted N2 photofixation ability is attributed to the improved separation rate of electron–hole pairs and enhanced light absorption in the whole solar region. Ag(1%)–gCN/W18O49(1![[thin space (1/6-em)]](https://www.rsc.org/images/entities/char_2009.gif) :
:![[thin space (1/6-em)]](https://www.rsc.org/images/entities/char_2009.gif) 2) shows the r(NH4+) of 2.1 mg L−1 h−1 gcat−1, lower than Ag(1%)–gCN/W18O49(1
2) shows the r(NH4+) of 2.1 mg L−1 h−1 gcat−1, lower than Ag(1%)–gCN/W18O49(1![[thin space (1/6-em)]](https://www.rsc.org/images/entities/char_2009.gif) :
:![[thin space (1/6-em)]](https://www.rsc.org/images/entities/char_2009.gif) 1). This is probably due to the following two reasons. On the one hand, the content of active component Ag(1%)–gCN is too low in Ag(1%)–gCN/W18O49(1
1). This is probably due to the following two reasons. On the one hand, the content of active component Ag(1%)–gCN is too low in Ag(1%)–gCN/W18O49(1![[thin space (1/6-em)]](https://www.rsc.org/images/entities/char_2009.gif) :
:![[thin space (1/6-em)]](https://www.rsc.org/images/entities/char_2009.gif) 2). On the other hand, Ag(1%)–gCN and W18O49 show almost the same SBET. When the mass ratio Ag(1%)–gCN to W18O49 is 1
2). On the other hand, Ag(1%)–gCN and W18O49 show almost the same SBET. When the mass ratio Ag(1%)–gCN to W18O49 is 1![[thin space (1/6-em)]](https://www.rsc.org/images/entities/char_2009.gif) :
:![[thin space (1/6-em)]](https://www.rsc.org/images/entities/char_2009.gif) 1, they can contact with each other as much as possible, leading to the formation of the maximum area of the heterojunction. Thus Ag(1%)–gCN/W18O49(1
1, they can contact with each other as much as possible, leading to the formation of the maximum area of the heterojunction. Thus Ag(1%)–gCN/W18O49(1![[thin space (1/6-em)]](https://www.rsc.org/images/entities/char_2009.gif) :
:![[thin space (1/6-em)]](https://www.rsc.org/images/entities/char_2009.gif) 2) shows the lower r(NH4+) than that of Ag(1%)–gCN/W18O49(1
2) shows the lower r(NH4+) than that of Ag(1%)–gCN/W18O49(1![[thin space (1/6-em)]](https://www.rsc.org/images/entities/char_2009.gif) :
:![[thin space (1/6-em)]](https://www.rsc.org/images/entities/char_2009.gif) 1). In addition, the r(NH4+) over Ag(1%)–gCN/W18O49(1
1). In addition, the r(NH4+) over Ag(1%)–gCN/W18O49(1![[thin space (1/6-em)]](https://www.rsc.org/images/entities/char_2009.gif) :
:![[thin space (1/6-em)]](https://www.rsc.org/images/entities/char_2009.gif) 1) remained stable over 40 h (Fig. 6b), hinting that the sample has excellent catalytic stability. Fig. 6c and d provide a preliminary analysis of the mechanism of this nitrogen photofixation process. As an electron scavenger, the addition of KBrO3 sharply suppresses the nitrogen photofixation ability of Ag(1%)–gCN/W18O49(1
1) remained stable over 40 h (Fig. 6b), hinting that the sample has excellent catalytic stability. Fig. 6c and d provide a preliminary analysis of the mechanism of this nitrogen photofixation process. As an electron scavenger, the addition of KBrO3 sharply suppresses the nitrogen photofixation ability of Ag(1%)–gCN/W18O49(1![[thin space (1/6-em)]](https://www.rsc.org/images/entities/char_2009.gif) :
:![[thin space (1/6-em)]](https://www.rsc.org/images/entities/char_2009.gif) 1) (Fig. 6c). The r(NH4+) becomes very low when using DMF and DMSO (aprotic solvent) instead of water (Fig. 6d). These two results show that electrons are the reactive species and that water provides protons for this nitrogen reduction reaction. The reaction is shown in eqn (1):
1) (Fig. 6c). The r(NH4+) becomes very low when using DMF and DMSO (aprotic solvent) instead of water (Fig. 6d). These two results show that electrons are the reactive species and that water provides protons for this nitrogen reduction reaction. The reaction is shown in eqn (1):
| N2 + 6H+ + 6e− → 2NH3↑ | (1) |
Fig. 6e shows the XPS of fresh and reused Ag(1%)–gCN/W18O49(1![[thin space (1/6-em)]](https://www.rsc.org/images/entities/char_2009.gif) :
:![[thin space (1/6-em)]](https://www.rsc.org/images/entities/char_2009.gif) 1) in the region of W 4f. Obviously, no binding energy shift occurs after reaction indicating the stable structure of as-prepared catalysts. Fig. 6f compares the N2 photofixation ability of Ag(1%)–gCN, Ag(1%)–gCN/W18O49(1
1) in the region of W 4f. Obviously, no binding energy shift occurs after reaction indicating the stable structure of as-prepared catalysts. Fig. 6f compares the N2 photofixation ability of Ag(1%)–gCN, Ag(1%)–gCN/W18O49(1![[thin space (1/6-em)]](https://www.rsc.org/images/entities/char_2009.gif) :
:![[thin space (1/6-em)]](https://www.rsc.org/images/entities/char_2009.gif) 1) and other noble metal loaded gCN catalysts prepared according to previous work.14 Obviously, the N2 photofixation abilities of Pt(1%)-gCN, Pd(1%)–gCN and Ru(1%)–gCN are much higher than Ag(1%)–gCN, but lower than Ag(1%)–gCN/W18O49(1
1) and other noble metal loaded gCN catalysts prepared according to previous work.14 Obviously, the N2 photofixation abilities of Pt(1%)-gCN, Pd(1%)–gCN and Ru(1%)–gCN are much higher than Ag(1%)–gCN, but lower than Ag(1%)–gCN/W18O49(1![[thin space (1/6-em)]](https://www.rsc.org/images/entities/char_2009.gif) :
:![[thin space (1/6-em)]](https://www.rsc.org/images/entities/char_2009.gif) 1) under simulated solar light. This is due to the promoted separation rate and light utilization.
1) under simulated solar light. This is due to the promoted separation rate and light utilization.
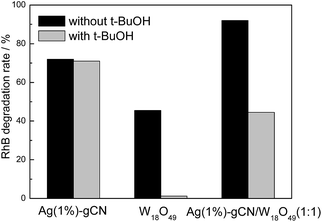
In order to investigate the reaction mechanism of as-prepared heterojunction catalyst, the photocatalytic RhB degradation rates over as-prepared catalysts with and without hydroxyl radical scavenger t-BuOH are shown in Fig. 7.53 A 300 W Xe lamp was used as light source. It is reported that the conduction band (CB) and valence band (VB) of g-C3N4 are −1.12 V and +1.57 V, respectively.43 Whereas, the redox potential for ˙OH/OH− is determined to be +1.99 V.54 Without t-BuOH, the RhB degradation rates are 72%, 45% and 92% for Ag(1%)–gCN, W18O49 and Ag(1%)–gCN/W18O49(1![[thin space (1/6-em)]](https://www.rsc.org/images/entities/char_2009.gif) :
:![[thin space (1/6-em)]](https://www.rsc.org/images/entities/char_2009.gif) 1). When t-BuOH is added, the RhB degradation rate for Ag(1%)–gCN shows almost no change. This indicates the addition of t-BuOH to trap ˙OH does not influence the RhB degradation rate over Ag(1%)–gCN. This is reasonable because the VB holes in Ag(1%)–gCN are not positive enough to generate ˙OH. Whereas, W18O49 displays almost no activity when t-BuOH is added. This hints that ˙OH is the only active species for RhB degradation over W18O49. It is known that the CB and VB are located at +0.74 and + 3.44 V for W18O49. The redox potential for O2/˙O2− is −0.33 V.54 Thus the VB holes in W18O49 are positive enough to generate ˙OH but the CB electrons are not negative enough to reduce O2 to form ˙O2−. In the case of Ag(1%)–gCN/W18O49(1
1). When t-BuOH is added, the RhB degradation rate for Ag(1%)–gCN shows almost no change. This indicates the addition of t-BuOH to trap ˙OH does not influence the RhB degradation rate over Ag(1%)–gCN. This is reasonable because the VB holes in Ag(1%)–gCN are not positive enough to generate ˙OH. Whereas, W18O49 displays almost no activity when t-BuOH is added. This hints that ˙OH is the only active species for RhB degradation over W18O49. It is known that the CB and VB are located at +0.74 and + 3.44 V for W18O49. The redox potential for O2/˙O2− is −0.33 V.54 Thus the VB holes in W18O49 are positive enough to generate ˙OH but the CB electrons are not negative enough to reduce O2 to form ˙O2−. In the case of Ag(1%)–gCN/W18O49(1![[thin space (1/6-em)]](https://www.rsc.org/images/entities/char_2009.gif) :
:![[thin space (1/6-em)]](https://www.rsc.org/images/entities/char_2009.gif) 1), the RhB degradation rate decreases sharply when t-BuOH is added. However, still 42% RhB is degraded indicating that ˙OH is one of the active species for RhB degradation over Ag(1%)–gCN/W18O49(1
1), the RhB degradation rate decreases sharply when t-BuOH is added. However, still 42% RhB is degraded indicating that ˙OH is one of the active species for RhB degradation over Ag(1%)–gCN/W18O49(1![[thin space (1/6-em)]](https://www.rsc.org/images/entities/char_2009.gif) :
:![[thin space (1/6-em)]](https://www.rsc.org/images/entities/char_2009.gif) 1). In general, there are two typical working mechanisms for heterojunction catalyst: double charge transfer mechanism and Z-scheme mechanism.55–58 If Ag(1%)–gCN/W18O49(1
1). In general, there are two typical working mechanisms for heterojunction catalyst: double charge transfer mechanism and Z-scheme mechanism.55–58 If Ag(1%)–gCN/W18O49(1![[thin space (1/6-em)]](https://www.rsc.org/images/entities/char_2009.gif) :
:![[thin space (1/6-em)]](https://www.rsc.org/images/entities/char_2009.gif) 1) follows the double charge transfer mechanism, the electrons and holes should be congregated at CB of W18O49 and VB of gCN. According to the energy level position, the addition of t-BuOH should not influence the RhB degradation rate. However, the experimental results are just the opposite. Thus, the Z-scheme mechanism over Ag(1%)–gCN/W18O49(1
1) follows the double charge transfer mechanism, the electrons and holes should be congregated at CB of W18O49 and VB of gCN. According to the energy level position, the addition of t-BuOH should not influence the RhB degradation rate. However, the experimental results are just the opposite. Thus, the Z-scheme mechanism over Ag(1%)–gCN/W18O49(1![[thin space (1/6-em)]](https://www.rsc.org/images/entities/char_2009.gif) :
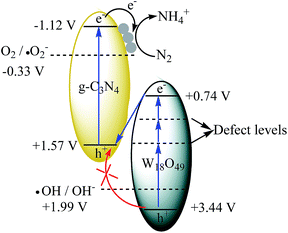
:![[thin space (1/6-em)]](https://www.rsc.org/images/entities/char_2009.gif) 1) is proposed (Fig. 8). Under irradiation, the photogenerated electron–hole pairs are formed in both components. Because of the abundant oxygen vacancies, there are many defect levels in the band gap of W18O49. Thus the light with long wavelength can be absorbed by W18O49, causing the photogenerated electrons continuous transition from valence band (VB) to conduction band (CB) by using these defect levels as springboard. The electrons in the CB of W18O49 combine with the holes in the VB of g-C3N4 at the interface of the heterojunction, leading to the enhanced electron–hole separation rate for g-C3N4. The CB electrons in the g-C3N4 transfer to the metallic Ag where the nitrogen molecules are reduced.
1) is proposed (Fig. 8). Under irradiation, the photogenerated electron–hole pairs are formed in both components. Because of the abundant oxygen vacancies, there are many defect levels in the band gap of W18O49. Thus the light with long wavelength can be absorbed by W18O49, causing the photogenerated electrons continuous transition from valence band (VB) to conduction band (CB) by using these defect levels as springboard. The electrons in the CB of W18O49 combine with the holes in the VB of g-C3N4 at the interface of the heterojunction, leading to the enhanced electron–hole separation rate for g-C3N4. The CB electrons in the g-C3N4 transfer to the metallic Ag where the nitrogen molecules are reduced.
In order to investigate the effect of NIR light on the N2 photofixation ability, the reaction was carried out under different light source (Fig. 9). The result indicates that neat W18O49 show no activity under each light source, confirming it is not the active component in the heterojunction catalyst. For Ag(1%)–gCN, N2 photofixation can not occur under IR light due to no light absorption in this region. The N2 photofixation ability of Ag(1%)–gCN under Xe lamp is almost the same as that under combined light source. Without any doubt, Ag(1%)–gCN/W18O49(1![[thin space (1/6-em)]](https://www.rsc.org/images/entities/char_2009.gif) :
:![[thin space (1/6-em)]](https://www.rsc.org/images/entities/char_2009.gif) 1) and Ag(1%)–gCN/WO3(1
1) and Ag(1%)–gCN/WO3(1![[thin space (1/6-em)]](https://www.rsc.org/images/entities/char_2009.gif) :
:![[thin space (1/6-em)]](https://www.rsc.org/images/entities/char_2009.gif) 1) show no N2 photofixation ability under IR light. Under Xe lamp, the r(NH4+) over Ag(1%)–gCN/W18O49(1
1) show no N2 photofixation ability under IR light. Under Xe lamp, the r(NH4+) over Ag(1%)–gCN/W18O49(1![[thin space (1/6-em)]](https://www.rsc.org/images/entities/char_2009.gif) :
:![[thin space (1/6-em)]](https://www.rsc.org/images/entities/char_2009.gif) 1) is 1.1 mg L−1 h−1 gcat−1, much lower than that under combined light source (3.2 mg L−1 h−1 gcat−1). Whereas, the r(NH4+) over Ag(1%)–gCN/WO3(1
1) is 1.1 mg L−1 h−1 gcat−1, much lower than that under combined light source (3.2 mg L−1 h−1 gcat−1). Whereas, the r(NH4+) over Ag(1%)–gCN/WO3(1![[thin space (1/6-em)]](https://www.rsc.org/images/entities/char_2009.gif) :
:![[thin space (1/6-em)]](https://www.rsc.org/images/entities/char_2009.gif) 1) under Xe lamp is almost the same as that under combined light source (0.55 mg L−1 h−1 gcat−1). This value is much lower than Ag(1%)–gCN/W18O49(1
1) under Xe lamp is almost the same as that under combined light source (0.55 mg L−1 h−1 gcat−1). This value is much lower than Ag(1%)–gCN/W18O49(1![[thin space (1/6-em)]](https://www.rsc.org/images/entities/char_2009.gif) :
:![[thin space (1/6-em)]](https://www.rsc.org/images/entities/char_2009.gif) 1) under combined light source. This confirms the crucial effect of NIR light on the N2 photofixation performance in this reaction system. Because of the strong absorption in the full-spectrum, more photons can be utilized to produce more electron–hole pairs over W18O49. According to the Z-scheme mechanism, more photogenerated electrons can cross the heterojunction interface to combine with the holes in the VB of g-C3N4. Thus, the separation rate and N2 photofixation ability are promoted.
1) under combined light source. This confirms the crucial effect of NIR light on the N2 photofixation performance in this reaction system. Because of the strong absorption in the full-spectrum, more photons can be utilized to produce more electron–hole pairs over W18O49. According to the Z-scheme mechanism, more photogenerated electrons can cross the heterojunction interface to combine with the holes in the VB of g-C3N4. Thus, the separation rate and N2 photofixation ability are promoted.
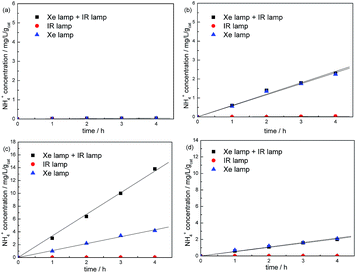 | ||
Fig. 9 Comparison of N2 photofixation ability over W18O49 (a), Ag(1%)–gCN (b), Ag(1%)–gCN/W18O49(1![[thin space (1/6-em)]](https://www.rsc.org/images/entities/char_2009.gif) : :![[thin space (1/6-em)]](https://www.rsc.org/images/entities/char_2009.gif) 1) (c) and Ag(1%)–gCN/WO3(1 1) (c) and Ag(1%)–gCN/WO3(1![[thin space (1/6-em)]](https://www.rsc.org/images/entities/char_2009.gif) : :![[thin space (1/6-em)]](https://www.rsc.org/images/entities/char_2009.gif) 1) (d) under different light source. 1) (d) under different light source. | ||
Conclusions
In this work, full-spectrum-absorption heterojunction catalyst Ag–g-C3N4/W18O49 is prepared and used for N2 photofixation under simulated solar irradiation for the first time. g-C3N4 is the active component in the heterojunction catalyst for N2 reduction. W18O49 plays a role as light absorber in the full-spectrum to form more photogenerated electrons for recombining the holes in the g-C3N4 through “Z-scheme” mechanism. Ag(1%)–gCN/W18O49(1![[thin space (1/6-em)]](https://www.rsc.org/images/entities/char_2009.gif) :
:![[thin space (1/6-em)]](https://www.rsc.org/images/entities/char_2009.gif) 1) exhibits the highest r(NH4+), 3.2 mg L−1 h−1 gcat−1, which is 8.9-fold higher than that of neat g-C3N4. This is due to the improved separation rate of electron–hole pairs after coupling with W18O49 and Ag loading. Ag(1%)–gCN/W18O49(1
1) exhibits the highest r(NH4+), 3.2 mg L−1 h−1 gcat−1, which is 8.9-fold higher than that of neat g-C3N4. This is due to the improved separation rate of electron–hole pairs after coupling with W18O49 and Ag loading. Ag(1%)–gCN/W18O49(1![[thin space (1/6-em)]](https://www.rsc.org/images/entities/char_2009.gif) :
:![[thin space (1/6-em)]](https://www.rsc.org/images/entities/char_2009.gif) 1) also displays excellent photocatalytic stability.
1) also displays excellent photocatalytic stability.
Conflicts of interest
There are no conflicts to declare.Acknowledgements
This project was supported by the National Natural Science Foundation of China (51374053).Notes and references
- X. Chen, S. Shen, L. Guo and S. Mao, Chem. Rev., 2010, 110, 6503–6570 CrossRef CAS PubMed.
- A. Kudo and Y. Miseki, Chem. Rev., 2009, 38, 253–278 RSC.
- M. Osterloh, Chem. Mater., 2008, 20, 35–54 CrossRef.
- M. Fox and M. Dulay, Chem. Rev., 1993, 93, 341–357 CrossRef CAS.
- C. S. Guo, S. Yin, Q. Dong and T. Sato, Nanoscale, 2012, 4, 3394–3398 RSC.
- M. Yan, G. L. Li, C. S. Guo, W. Guo, D. D. Ding, S. H. Zhang and S. Q. Liu, Nanoscale, 2016, 8, 17828–17835 RSC.
- J. Tian, Y. Sang, G. Yu, H. Jiang, X. Mu and H. Liu, Adv. Mater., 2013, 25, 5075–5080 CrossRef CAS PubMed.
- G. Wang, B. Huang, X. Ma, Z. Wang, X. Qin, X. Zhang, Y. Dai and M. H. Whangbo, Angew. Chem., Int. Ed., 2013, 52, 4810–4813 CrossRef CAS PubMed.
- G. L. Li, C. S. Guo, M. Yan and S. Q. Liu, Appl. Catal., B, 2016, 183, 138–142 CrossRef.
- Z. Zhang and W. Wang, Dalton Trans., 2013, 42, 12072–12074 RSC.
- Z. Z. Lou and C. Xue, CrystEngComm, 2016, 18, 8406–8410 RSC.
- X. T. Chang, S. B. Sun, L. H. Dong and Y. S. Yin, Mater. Lett., 2012, 83, 133–135 CrossRef CAS.
- G. N. Schrauzcr and T. D. Guth, J. Am. Chem. Soc., 1977, 99, 7189–7193 CrossRef.
- K. T. Ranjit, T. K. Varadarajan and B. Viswanathan, J. Photochem. Photobiol., A, 1996, 96, 181–185 CrossRef CAS.
- O. Rusina, O. Linnik, A. Eremenko and H. Kisch, Chem.–Eur. J., 2003, 9, 561–565 CrossRef CAS PubMed.
- G. H. Dong, W. K. Ho and C. Y. Wang, J. Mater. Chem. A., 2015, 3, 23435–23441 CAS.
- H. Li, J. Shang, Z. H. Ai and L. Z. Zhang, J. Am. Chem. Soc., 2015, 137, 6393–6399 CrossRef CAS PubMed.
- S. Z. Hu, X. Chen, Q. Li, Y. F. Zhao and W. Mao, Catal. Sci. Technol., 2016, 6, 5884–5890 CAS.
- S. Z. Hu, L. Ma, J. G. You, F. Y. Li, Z. P. Fan, G. Lu, D. Liu and J. Z. Gui, Appl. Surf. Sci., 2014, 311, 164–171 CrossRef CAS.
- X. C. Wang, K. Maeda, A. Thomas, K. Takanabe, G. Xin, J. M. Carlsson, K. Domen and M. Antonietti, Nat. Mater., 2009, 8, 76–80 CrossRef CAS PubMed.
- Q. F. Deng, L. Liu, X. Z. Lin, G. H. Du, Y. P. Liu and Z. Y. Yuan, Chem. Eng. J., 2012, 203, 63–70 CrossRef CAS.
- S. Z. Hu, X. Chen, Q. Li, F. Y. Li, Z. P. Fan, H. Wang, Y. J. Wang, B. H. Zheng and G. Wu, Appl. Catal., B, 2017, 201, 58–69 CrossRef CAS.
- M. B. Ansari, H. L. Jin, M. N. Parvin and S. E. Park, Catal. Today, 2012, 185, 211–216 CrossRef CAS.
- X. J. Bai, R. L. Zong, C. X. Li, D. Liu, Y. F. Liu and Y. F. Zhu, Appl. Catal., B, 2014, 147, 82–91 CrossRef CAS.
- S. Krejcíková, L. Matejová, K. Kocí, L. Obalová, Z. Matej, L. Capek and O. Solcová, Appl. Catal., B, 2012, 111–112, 119–125 CrossRef.
- H. Eskandarloo, A. Badiei, M. A. Behnajady and G. M. Ziarani, RSC Adv., 2014, 4, 28587–28596 RSC.
- J. Cao, B. D. Luo, H. L. Lin, B. Y. Xu and S. F. Chen, Appl. Catal., B, 2012, 111–112, 288–296 CrossRef CAS.
- C. H. Wang, X. T. Zhang, B. Yuan, Y. X. Wang, P. P. Sun, D. Wang, Y. G. Wei and Y. C. Liu, Chem. Eng. J., 2014, 237, 29–37 CrossRef CAS.
- J. Su, L. Guo, N. Bao and C. A. Grimes, Nano Lett., 2011, 11, 1928–1933 CrossRef CAS PubMed.
- H. J. Yan, X. J. Zhang, S. Q. Zhou, X. H. Xie, Y. L. Luo and Y. H. Yu, J. Alloys Compd., 2011, 509, L232–L235 CrossRef CAS.
- L. Y. Huang, H. Xu, Y. P. Li, H. M. Li, X. N. Cheng, J. X. Xia, Y. G. Xu and G. B. Cai, Dalton Trans., 2013, 42, 8606–8616 RSC.
- X. C. Wang, K. Maeda, X. F. Chen, K. Takanabe and K. Domen, J. Am. Chem. Soc., 2009, 131, 1680 CrossRef CAS PubMed.
- S. J. Liu, F. T. Li, Y. L. Li, Y. J. Hao, X. J. Wang, B. Li and R. H. Liu, Appl. Catal., B, 2017, 212, 115–128 CrossRef CAS.
- F. T. Li, Y. Zhao, Q. Wang, X. J. Wang, Y. J. Hao, R. H. Liu and D. S. Zhao, J. Hazard. Mater., 2015, 283, 371–381 CrossRef CAS PubMed.
- K. N. Song, F. Xiao, L. J. Zhang, F. Yue, X. Y. Liang, J. D. Wang and X. T. Su, J. Mol. Catal. A: Chem., 2016, 418–419, 95–102 CrossRef CAS.
- X. X. Guo, X. Y. Qin, Z. J. Xue, C. B. Zhang, X. H. Sun, J. B. Hou and T. Wang, RSC Adv., 2016, 6, 48537–48542 RSC.
- P. Q. Chen, M. L. Qin, Y. Liu, B. R. Jia, Z. Q. Cao, Q. Wan and X. H. Qu, New J. Chem., 2015, 39, 1196–1201 RSC.
- M. Guan, C. Xiao, J. Zhang, S. Fan, R. An, Q. Cheng, J. Xie, M. Zhou, B. Ye and Y. Xie, J. Am. Chem. Soc., 2013, 135, 10411–10417 CrossRef CAS PubMed.
- W. Bi, C. Ye, C. Xiao, W. Tong, X. Zhang, W. Shao and Y. Xie, Small, 2014, 10, 2820–2825 CrossRef CAS PubMed.
- C. S. Guo, S. Yin, M. Yan, M. Kobayashi, M. Kakihana and T. Sato, Inorg. Chem., 2012, 51, 4763–4771 CrossRef CAS PubMed.
- W. R. Zhao, J. Zhang, X. Zhu, M. Zhang, J. Tang, M. Tan and Y. Wang, Appl. Catal., B, 2014, 144, 468–477 CrossRef CAS.
- G. Xi, S. Ouyang, P. Li, J. Ye, Q. Ma, N. Su, H. Bai and C. Wang, Angew. Chem., Int. Ed., 2012, 51, 2395–2399 CrossRef CAS PubMed.
- Y. Wang, X. C. Wang and M. Antonietti, Angew. Chem., Int. Ed., 2012, 51, 68–89 CrossRef CAS PubMed.
- P. Wang, B. B. Huang, X. Y. Qin, X. Y. Zhang, Y. Dai, J. Y. Wei and M. H. Whangbo, Angew. Chem., Int. Ed., 2008, 47, 7931–7933 CrossRef CAS PubMed.
- L. Ge and C. Han, Appl. Catal., B, 2012, 117–118, 268–274 CrossRef CAS.
- W. Lei, D. Portehault, R. Dimova and M. Antoniettit, J. Am. Chem. Soc., 2011, 133, 7121–7127 CrossRef CAS PubMed.
- Y. W. Zhang, J. H. Liu, G. Wu and W. Chen, Nanoscale, 2012, 4, 5300–5303 RSC.
- Y. S. Fu, T. Huang, L. L. Zhang, J. W. Zhu and X. Wang, Nanoscale, 2015, 7, 13723–13733 RSC.
- R. Wu, J. Zhang, Y. Shi, D. Liu and B. Zhang, J. Am. Chem. Soc., 2015, 137, 6983–6986 CrossRef CAS PubMed.
- B. L. He, B. Dong and H. L. Li, Electrochem. Commun., 2007, 9, 425–430 CrossRef CAS.
- D. Wang, J. B. Sun, X. Cao, Y. H. Zhu, Q. X. Wang, G. C. Wang, Y. Han, G. Y. Lu, G. S. Pang and S. H. Feng, J. Mater. Chem. A., 2013, 1, 8653–8657 CAS.
- V. N. Khabashesku, J. L. Zimmerman and J. L. Margrave, Chem. Mater., 2000, 12, 3264–3270 CrossRef CAS.
- S. Q. Zhang, Y. X. Yang, Y. N. Guo, W. Guo, M. Wang, Y. H. Guo and M. X. Huo, J. Hazard. Mater., 2013, 261, 235–245 CrossRef CAS PubMed.
- G. Liu, P. Niu, L. C. Yin and H. M. Cheng, J. Am. Chem. Soc., 2012, 134, 9070–9073 CrossRef CAS PubMed.
- K. Kondo, N. Murakami, C. Ye, T. Tsubota and T. Ohno, Appl. Catal., B, 2013, 142–143, 362–367 CrossRef CAS.
- Y. M. He, L. H. Zhang, B. T. Teng and M. H. Fan, Environ. Sci. Technol., 2015, 49, 649–656 CrossRef CAS PubMed.
- Y. M. He, L. H. Zhang, X. X. Wang, Y. Wu, H. J. Lin, L. H. Zhao, W. Z. Weng, H. L. Wan and M. H. Fan, RSC Adv., 2014, 4, 13610–13619 RSC.
- Y. M. He, L. H. Zhang, M. H. Fan, X. X. Wang, M. L. Walbridge, Q. Y. Nong, Y. Wu and L. H. Zhao, Sol. Energy Mater. Sol. Cells, 2015, 137, 175–184 CrossRef CAS.
| This journal is © The Royal Society of Chemistry 2017 |

