 Open Access Article
A label-free screening approach targeted protease-activated receptor 1 based on dynamic mass redistribution in living cells†
Weiwei Tanga,
Bixia Huanga,
Jiancheng Wanga,
Lin Ana,
Huailing Zhongb,
Hua Yanga,
Ping Li a and
Jun Chen
 *a
*a
aState Key Laboratory of Natural Medicines, China Pharmaceutical University, Nanjing 210009, P. R. China. E-mail: chenj2002cpu@126.com; Fax: +86-25-8327-1379; Tel: +86-25-8327-1382
bU-Pharm Laboratories LLC, 239 New Rd, Suite A-107, Parsippany, NJ 07054, USA
First published on 5th September 2017
Abstract
Protease-activated receptor 1 (PAR-1) antagonists strongly inhibit thrombin-induced platelet aggregation and are proved to be effective as anti-thrombotic drugs. Traditional screening assays for PAR-1 antagonists require molecular labeling or cell engineering technique. Here, a label-free approach was developed for the screening of active compounds targeting PAR-1 through monitoring integrated live-cell responses in whole cells. To characterize the cellular response, the cellular dynamic mass redistribution (DMR) was detected with a resonant waveguide grating (RWG) biosensor using PAR-1 known agonists and antagonists. The human epidermoid carcinoma A431 cell line was selected to establish a cell phenotypic profiling model for screening the PAR-1 antagonists from 80 natural products. Results showed that five compounds were screened out as candidate bioactive compounds. Two compounds, parthenolide and sanguinarine, were identified to possess anti-platelet aggregation activities in vitro. These results indicate that the label-free DMR screening approach is effective and useful for screening bioactive compounds targeting PAR-1.
1 Introduction
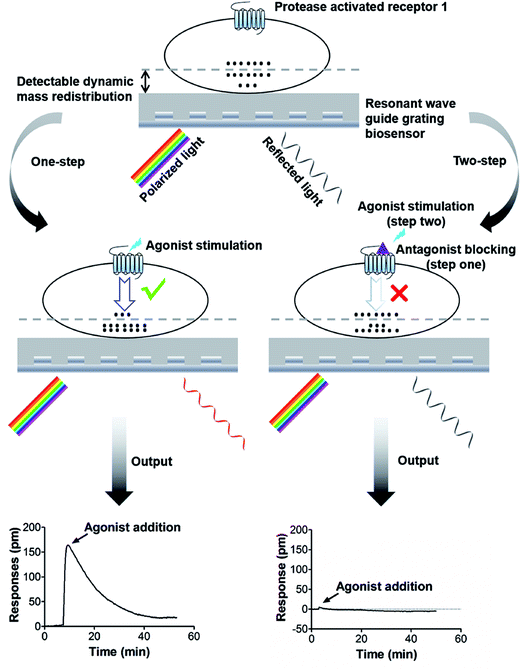
G protein-coupled receptors (GPCRs) are a large superfamily of receptors that play an important role in cellular signal transduction and organismic biological functions.1,2 After agonist triggering, GPCRs routinely couple to heterotrimeric G proteins, resulting in the generation of second messengers and the initiation of downstream signaling events. Activated GPCRs are phosphorylated by specific GPCR kinases (GRKs) or recruited β-arrestins to the phosphorylated GPCRs, which leads to G protein signaling termination, i.e. receptor desensitization, inactivation or internalization.3,4 Due to its important role in physiological and pathological processes, GPCRs have served as the most successful drug targets in clinical medicine.5 As a GPCR, protease-activated receptor 1 (PAR-1) mediates important biological functions, such as platelet aggregation,6 inflammatory responses,7 and endothelial cell protection.8 Since the 1990s, it has been proposed that PAR-1 antagonists could be effective as antithrombotic agents, without the hemorrhage risk associated with thrombin inhibitors. However, different from the conventional activation of most GPCRs by direct ligand binding, activation of PAR-1 involves the proteolytic unmasking of a cryptic ligand that is already tethered to the receptor, which poses a great challenge for PAR-1 drug development. Until now, only one PAR-1 antagonist (vorapaxar) was approved for preventing thrombotic cardiovascular events in patients with prior myocardial infarction or peripheral artery disease.9 Therefore, it is meaningful to discover new PAR-1 antagonists for antiplatelet drug discovery.Currently, the most commonly used approach for novel GPCR drug discovery is high throughput screening (HTS) of small molecule compounds, which is mainly achieved through either target-based screening or phenotypic approach. One of the traditional target-based approaches is receptor binding assay, which is a cell-free method theoretically suitable for any GPCR drug screening. However, the availability and disposal of radioactive labeling or fluorescent labeling ligands greatly limits its application.10 Structure or fragment-based drug design, also known as the virtual or in silico screening approach, has emerged as a rapid and powerful method. However, a vast number of GPCRs are still not readily studied by such methods due to the paucity of crystallographic or nuclear magnetic resonance (NMR)-based structural information.11 Over the past decades, with the development of recombinant GPCR expression techniques, the cell membrane chromatography assay and biosensor-based approach have been widely developed for screening active components. However, significant challenges arose from these assays due to the influence of receptor purification and immobilization procedures on receptor conformation.12,13 Phenotypic approaches are based on the determination of following signaling components production and biological responses after GPCRs interacting with compounds, providing powerful tools for bioactivity prediction.14 Such assays, including the GTPγS binding assay,15 the cAMP, IP3/IP1 or Ca2+ flux assays,16–18 the reporter assay,19 as well as the β-arrestin recruitment assay,20 provide functional outputs which are analyzed using hallmarks like fluorescence or luminescence. These assays normally require specific molecular probes and engineering cells. Label-free technologies provide a holistic, unbiased and non-invasive approach to monitor the cellular response, thus, they could potentially be used to translate complex integrated GPCR signaling into a sample-identifiable “fingerprint”.21,22 Currently available label-free techniques employ impedance-based,23 acoustic-based24 or optical-based25 biosensors to record integrated cellular responses in whole living cells. Resonance wave-guide grating (RWG), as an optical biosensor, measures the cellular process of dynamic mass redistribution (DMR) near the sensor surface. Polarized light is shined across the bottom of an RWG biosensor microtiter plate containing the living cells, and a wavelength shift of reflected light is indicative of cellular DMR triggered by receptor activation.26 Previous studies showed that the DMR technology was adopted as a tool for GPCR-targeted drug discovery,27–29 drug target identification30,31 and GPCR signaling deconvolution.25,26,32 In this study, we developed a label-free approach based on cellular DMR response and applied it to screen bioactive compounds targeting PAR-1 from natural products (Fig. 1).
2 Materials and reagents
Vorapaxar (SCH 530348) and atopaxar (E5555) were purchased from TargetMol co., Ltd. (Shanghai, China). Thrombin (1kU) and HEPES were brought from Sigma-Aldrich (St. Louis, MO, USA). PAR-1 agonist TRAP-6 (Ser-Phe-Leu-Leu-Arg-Asn-NH2, SFLLRN) was purchased from Nanjing Peptide Biotech co., Ltd. (Nanjing, China). Fetal bovine serum (FBS), 0.25% trypsin/EDTA solution, Dulbecco's modified Eagle's medium (DMEM), Kaighn's modification of Ham's F12 medium (F-12K), Roswell Park Memorial Institute (RPMI) 1640 medium and HBSS buffer solution (pH 7.4) were purchased from GIBCO (Grand Island, New York, USA). Epic® 384-well biosensor microplates were obtained from Corning (Corning cat. no. 5040).3 Animals
Ethical statement: animal welfare and experimental procedures were carried out in accordance with the Provisions and General Recommendation of Chinese Experimental Animals Administration Legislation and the guidelines of the Animal Ethics Committee of China Pharmaceutical University. The experiment was approved by the Animal Ethics Committee of China Pharmaceutical University.Male guinea pigs were purchased from Sino-British Sippr/BK Lab Animal Ltd (Shanghai, China). They were housed in temperature- and humidity-controlled animal quarters with access to food and water ad libitum before the experiment.
4 Methods
4.1 Cell culture
Chinese hamster ovary (CHO-K1) cells, human umbilical vein endothelial cells (HUVEC), human endothelial cells (EA.hy926) and human breast cancer cells (MDA-MB-231) were obtained from American Type Cell Culture. Human epidermoid carcinoma A431 cells were provided by cell bank of Chinese Academy of Sciences (Shanghai, China). Human aortic endothelial cells (hAECs) were obtained from JENNIO Biological technology (Guangzhou, China). HUVEC, EA.hy926, MDA-MB-231 and A431 cells were maintained in DMEM with Glutamax and high-glucose medium supplemented with 1% glutamine, 1% penicillin/streptomycin and 10% FBS. CHO-K1 cells were grown in F-12K medium supplemented with 10% FBS, 2 mM L-glutamine, 1.5 mg mL−1 sodium bicarbonate, and antibiotics. hAECs were used within 5 passages and maintained in RPMI-1640 medium supplemented with 1% glutamine, 1% penicillin/streptomycin and 10% FBS. All cells were cultured at 37 °C under air/5% CO2 until 95% confluency reached. Cells were seeded in 384-well microplate at 15![[thin space (1/6-em)]](https://www.rsc.org/images/entities/char_2009.gif) 000 cells per well for CHO-K1 and A431 cells, and 20
000 cells per well for CHO-K1 and A431 cells, and 20![[thin space (1/6-em)]](https://www.rsc.org/images/entities/char_2009.gif) 000 cells per well for hAECs, HUVEC, EA.hy926 and MDA-MB-231 cells.
000 cells per well for hAECs, HUVEC, EA.hy926 and MDA-MB-231 cells.
4.2 Dynamic mass redistribution (DMR) assays
DMR assays were carried out on an Epic® BT system (Corning NY, USA), which is a wavelength-interrogation reader system tailored for RWG biosensors in microtiter plates. The detection unit was centered on integrated fiber optics, and enabled kinetic measures of cellular responses with a time interval of 15 s. Unless specific mentioned, cells were directly seeded in the Epic® 384-well biosensor microplate and cultured overnight to form a confluent monolayer in the cell culture medium. The cells were then manually washed twice, and maintained in the assay buffer (1× HBSS buffer, 20 mM HEPES, pH 7.2) for 1 h before measurement. In the one-step DMR measurement, after a stable baseline was established, compound was added to record the triggered DMR signals for 1 h.In the two-step DMR measurement, cells were firstly treated with compound for 20 min or more. After a stable baseline was established, PAR-1 agonist was added at concentration of EC80 or EC100. The cellular DMR response was then recorded for another 1 h.
4.3 Cell viability assay
Cell viability was evaluated by MTT assay. Briefly, A431 cells were seeded at the density of 30![[thin space (1/6-em)]](https://www.rsc.org/images/entities/char_2009.gif) 000 cells per well in a 96-well plate. After culturing for 16 h, cells were treated with compound for 2 h. Then, MTT (5 mg mL−1) was added and incubated for further 4 h. The cytotoxicity of compounds was detected by a microplate reader (Biotek, USA).
000 cells per well in a 96-well plate. After culturing for 16 h, cells were treated with compound for 2 h. Then, MTT (5 mg mL−1) was added and incubated for further 4 h. The cytotoxicity of compounds was detected by a microplate reader (Biotek, USA).
4.4 Anti-platelet aggregation in vitro
Blood from guinea pigs was collected into plastic vessels containing 3.8% sodium citrate (v/v, 1/10). Platelet-rich plasma (PRP) was obtained from the supernatant fraction of the blood after centrifugation at 150g for 5 min. Platelet-poor plasma (PPP) was obtained by centrifugation of the remaining blood at 1000g for 10 min. The final cell count in PRP was adjusted to 3 × 10⁸ platelets per mL with the PPP.Platelet aggregation was measured according to the turbidimetric method of Born and Cross33 with an aggregometer (PRECIL LBY-NJ4A, Beijing, China). In the cuvette, 287 μL PRP were pre-incubated for 3 min at 37 °C after the addition of drug or vehicle (3 μL). Before testing, the PPP was used to correct the light transmission as 100%. In order to quantify the inhibitory effects of each drug, the maximum increase in light transmission was determined from the aggregation curve for 5 min after the addition of 15 μM agonist. The effect of each drug was expressed as percentage inhibition of agonist-induced platelet aggregation compared with vehicle treatment. Data are presented as the means ± S.D. for the indicated number of experiments. The IC50 value was obtained by linear regression, and is expressed as the drug concentration required to exhibit 50% inhibition of agonist-induced platelet aggregation in comparison to vehicle treatment.
4.5 Data analysis and statistics
All DMR data were acquired using Epic Imager software (Corning, NY, USA) and processed using Imager Beta 3.7 (Corning) and GraphPad Prism 5.0 (GraphPad Software Inc., San Diego, CA, USA). All DMR signals were background-corrected. EC50 and IC50 values were calculated based on the maximum amplitudes of DMR signals within 10 min after agonist stimulation unless otherwise stated. The EC50 and IC50 values were obtained by fitting the dose DMR response curves with nonlinear regression.The quality of screening assays can be assessed using the Z-factor (Z′), calculated as follows:
| Z′ = 1 − [(3σs + 3σc)/|μs − μc|] |
5 Results
5.1 PAR-1 agonists trigger concentration-dependent DMR signals in A431 cells
PAR-1 is expressed in various cell types, including platelets, monocytes, mast cells, T lymphocytes, vascular smooth muscle cells, endothelial cells and epithelial cells.34 However, PAR-1 agonist may elicit different PAR-1 mediated downstream signaling events in different types of cells. Therefore, it is necessary to select an appropriate cell type for DMR assay. Six types of adherent cells expressing PAR-1 endogenously, including CHO-K1 cells, hAECs, HUVEC, EA.hy926 cells, MDA-MB-231 cells and A431 cells, were studied. After the washing and equilibrium procedures, cells were stimulated by PAR-1 agonist (thrombin or TRAP-6) with gradient concentrations. The real time cellular DMR response profiles are shown in Fig. 2 for thrombin stimulation and in Fig. 3 for TRAP-6 stimulation. As displayed in Fig. 2A, F and 3A, F, CHO-K1 and A431 cells exhibited typical positive DMR (P-DMR) signals after thrombin or TRAP-6 stimulation. On the contrary, hAECs, HUVEC, EA.hy926 and MDA-MB-231 cells showed typical negative DMR (N-DMR) response triggered by both agonists (Fig. 2B–E and 3B–E). The real time DMR response data was processed to obtain three DMR response indicators, including the maximum DMR signal amplitude within 10 min post-stimulation, the DMR response at 30 min post-stimulation and the area under real time response curves over 50 min (AUC50 min), according to reported protocol.25 In CHO-K1 cells, thrombin triggered P-DMR response with a concentration-dependent manner in terms of the three indicators, while TRAP-6 triggered response without a concentration-dependent manner (Fig. S1a–c and S2a–c†). In hAEC and EA.hy926 cells, TRAP-6 triggered N-DMR response with a concentration-dependent manner, while thrombin did not triggered it in a concentration-dependent manner (Fig. S1d–f, j–l, S2d–f and j–l†). In HUVEC and MDA-MB-231 cells, both thrombin and TRAP-6 did not triggered N-DMR response in a concentration-dependent manner (Fig. S1g–i, m–o, S2g–i and m–o†). In A431 cells, both PAR-1 agonists triggered DMR response with a concentration-dependent manner in terms of the three indicators (Fig. S1p–r and S2p–r†). These results indicated the A431 cell line was suitable for establishing a cell phenotypic profiling to screen active compounds targeting PAR-1. The maximum DMR signal amplitude within 10 min post-stimulation was used as a representative indicator for assessment of DMR response in our following experiments.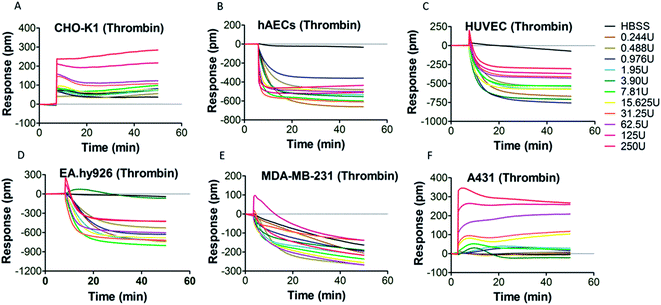 | ||
| Fig. 2 DMR real time signals from different cell types after thrombin stimulation (A) CHO-K1; (B) hAECs; (C) HUVEC; (D) EA.hy926; (E) MDA-MB-231; (F) A431. | ||
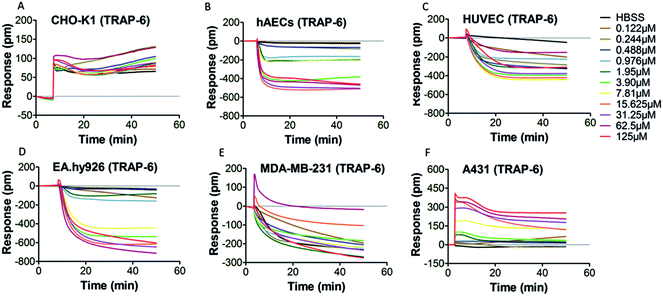 | ||
| Fig. 3 DMR real time signals from different cell types after TRAP-6 stimulation (A) CHO-K1; (B) hAECs; (C) HUVEC; (D) EA.hy926; (E) MDA-MB-231; (F) A431. | ||
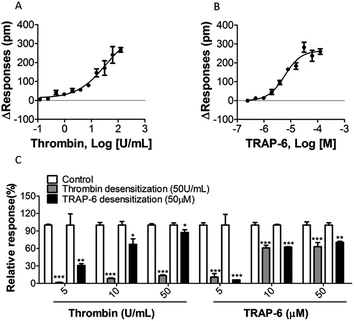
In A431 cells, the EC50 values of thrombin and TRAP-6 were 22.82 ± 6.12 U mL−1 and 5.93 ± 0.15 μM, respectively (Fig. 4A and B, Table 1). These results were similar to the reported EC50 values.35
| EC50 or IC50 | |
|---|---|
| Thrombin | 22.82 ± 6.12 U mL−1 |
| TRAP | 5.93 ± 0.15 (μM) |
| Vorapaxar | 0.480 ± 0.108 (μM) |
| Atopaxar | 0.194 ± 0.014 (μM) |
5.2 Consecutive stimulations of PAR-1 agonists block DMR signals
The desensitization of a GPCR response can be described as the subsequent loss of response to prolonged or repeated administration of an agonist.36 Thus, desensitization showed an “apparent” inhibitory effect when using the functional assay at cellular phenotype level. To validate the availability and specificity of obtained DMR responses, profiles of receptor desensitization were evaluated using a two-step measurement. A431 cells were treated with thrombin (50 U mL−1) or TRAP-6 (50 μM) for 20 min. After re-establishing a baseline, cells were treated with low, medium or high concentrations of each agonist (final concentrations 5 U mL−1, 10 U mL−1, or 50 U mL−1 for thrombin, final concentrations 5 μM, 10 μM or 50 μM for TRAP-6). Fig. 4C show that A431 cells became desensitized in a concentration-dependent manner after second treatment with the same or different PAR-1 agonist. It is worth mentioning that cells desensitized by TRAP-6 still responded to 50 U mL−1 thrombin treatment. Since thrombin is not a selective agonist for PAR-1, this may be an explanation for the observation. Previous studies have shown that TRAP-6 is a selective agonist for PAR-1, which means that TRAP-6 induces a more specific DMR response associated with PAR-1 activation. Therefore, TRAP-6 was used in the following experiments.5.3 Optimization of experimental parameters for the screening model
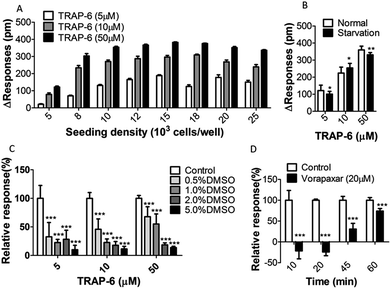
To optimize the cell seeding density, A431 cells were seeded at different densities (from 5000 to 25![[thin space (1/6-em)]](https://www.rsc.org/images/entities/char_2009.gif) 000 cells per well) and stimulated with low, medium or high concentrations of TRAP-6 (5 μM, 10 μM, or 50 μM). As shown in Fig. 5A, the maximum DMR signal amplitude increased with the cell seeding density increasing and reached to a plateau at a density of 12
000 cells per well) and stimulated with low, medium or high concentrations of TRAP-6 (5 μM, 10 μM, or 50 μM). As shown in Fig. 5A, the maximum DMR signal amplitude increased with the cell seeding density increasing and reached to a plateau at a density of 12![[thin space (1/6-em)]](https://www.rsc.org/images/entities/char_2009.gif) 000 cells per well. This may be explained by the fact that cells with higher seeding density grow to multilayer instead of monolayer. Multilayer cells cause cellular aggregation, and the DMR response is no longer enhance to some extent. Therefore, A431 cells were seeded at density of 15
000 cells per well. This may be explained by the fact that cells with higher seeding density grow to multilayer instead of monolayer. Multilayer cells cause cellular aggregation, and the DMR response is no longer enhance to some extent. Therefore, A431 cells were seeded at density of 15![[thin space (1/6-em)]](https://www.rsc.org/images/entities/char_2009.gif) 000 cells per well in the screening model.
000 cells per well in the screening model.
Previous reports suggested that GPCRs become more sensitive to stimulation after starvation culturing.25,26 To test this, A431 cells were cultured for 10 h in a 384-well microplate, and then incubated in DMEM with or without serum for 10 h. The results showed no difference in the cellular DMR response between starvation and normal culture (Fig. 5B). Thus, A431 cells were cultured normally without starvation.
DMSO is routinely used as a solvent in the preparation of compound solutions. It is a dense solvent capable of eliciting changes not only in the index of refraction but also in the cells themselves. Thus, the effects of DMSO on DMR responses were investigated using the one-step assay. Cells were washed twice with assay buffer containing different amounts of DMSO ranging from 0.5 to 5% (v/v) after cell sending and culturing. The agonist was added to the cells for stimulation after equilibrium in the same amounts of DMSO with wash buffer. DMR signals were obtained and show in Fig. 5C (n = 10). The control group was under assay buffer without DMSO treatment. It was found that the DMR signal varied inversely with the amount of DMSO. Thus, for subsequent assays, the amount of DMSO in each well was below 0.5%.
Due to the compound residence time affecting target interaction, it is necessary to optimize the incubation time. For this part, a time-dependent two-step assay was employed to determine the optimum incubation time. In the two-step assay, cells were incubated with compounds in step one and agonist was added in step two. Consequently, cells were treated with vorapaxar (20 μM) or buffer solution for 10, 20, 45 or 60 min in step one. Then, the signals were corrected to baseline before TRAP-6 addition (50 μM). Results showed in Fig. 5D indicate that the antagonism effects displayed time-dependent profiles. With an incubation time of over 20 min, the amplitude of the DMR responses increased, which suggests that the antagonism effect decreased. This can probably be attributed to antagonist dissociation of PAR-1. Based on these, the incubation time for further experiments was set at 20 min.
5.4 PAR-1 antagonists inhibit agonist-triggered DMR signals in a concentration-dependent manner
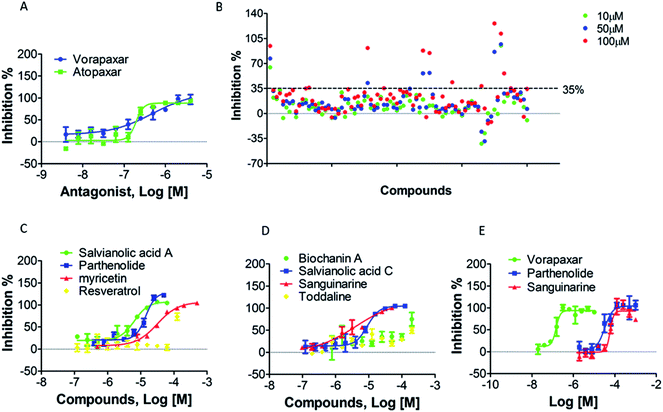
To screen PAR-1 inhibitors, two PAR-1 antagonists (vorapaxar and atopaxar) were used as reference compounds to verify our approach. Using the two-step measurement, the inhibition rate of each antagonist was determined at different concentrations and their inhibition curves are shown in Fig. 6A. Their IC50 values shown in Table 1 are similar to the reported data.37 The Z′ factor values for vorapaxar and atopaxar were 0.58 and 0.59, respectively. These results indicate that the screening approach established herein is reliable.5.5 Assay application for screening candidate compounds against PAR-1
This newly developed method was used to screen for active compounds from natural products displaying antagonistic activity against PAR-1. Our compound library was thoroughly analyzed and 80 compounds were selected for screening. All compounds were first dissolved in DMSO and then diluted directly into the assay buffer, with the final amount of DMSO being kept below 0.5%. Compounds were screened with low (10 μM), medium (50 μM) or high (100 μM) concentrations using the same two-step assay utilized in the preliminary screening. Therefore, cells were stimulated with TRAP-6 to obtain real time DMR responses. DMR data were processed with background correction and then compared to positive control (buffer addition in step one). The inhibition rate of each compound was calculated with normalized processing of background-corrected P-DMR values. The threshold of approved inhibition rate was set at 35% for the screening of potent compounds. As shown in Fig. 6B, 8 compounds were accepted for secondary screening. The optimal concentrations of the 8 compounds, namely salvianolic acid A, parthenolide, myricetin, resveratrol, biochanin A, salvianolic acid C, sanguinarine and toddaline, were then measured using the MTT assay (Fig. S3†). Subsequently, the two-step assay was applied to obtain the IC50 values for the 8 potent compounds screened out for secondary screening. The results were displayed in Fig. 6C, D and Table 2, and 5 compounds, namely salvianolic acid A, parthenolide, myricetin, salvianolic acid C and sanguinarine, were revealed as candidate compounds.| IC50 (μM) | |
|---|---|
| Salvianolic acid A | 6.27 ± 0.56 |
| Parthenolide | 14.49 ± 1.58 |
| Myricetin | 31.67 ± 0.59 |
| Resveratrol | >100 |
| Biochanin A | >100 |
| Salvianolic acid C | 9.11 ± 0.32 |
| Sanguinarine | 6.232 ± 5.02 |
| Toddaline | >50 |
5.6 Identification of candidate PAR-1 antagonists through in vitro anti-platelet aggregation assay
As described above, salvianolic acid A, parthenolide, myricetin, salvianolic acid C and sanguinarine were screened as candidate compounds against PAR-1. As previously reported, PAR-1 antagonists should function as platelet aggregation inhibitors. Therefore, these 5 hit compounds were assessed by an anti-platelet aggregation assay in vitro to validating their efficacy. Fig. 6E and Table 3 show that among the 5 hit compounds, parthenolide and sanguinarine displayed a better anti-platelet aggregation effect than the other three, with IC50 values of 34.95 ± 15.37 and 60.89 ± 1.27 μM, respectively. Consequently, parthenolide and sanguinarine were identified as new potent anti-platelet aggregation agents through PAR-1.| Compound | IC50 (μM) |
|---|---|
| Vorapaxar | 0.13 ± 0.03 |
| Salvianolic acid A | >500 |
| Parthenolide | 34.95 ± 15.37 |
| Myricetin | >500 |
| Salvianolic acid C | >500 |
| Sanguinarine | 60.89 ± 1.27 |
6 Discussion
PAR-1 has emerged as a promising therapeutic target for cardiovascular disease like acute coronary syndromes. It has been proposed that PAR-1 antagonists could be excellent anti-thrombotic agents without the hemorrhage risk associated with other antithrombotic therapies. Considerable efforts have been directed towards developing antagonists for PAR-1.38 However, because of the unusual mechanism of PAR-1 tethered ligand activation and its biased signaling, these efforts have been, until now, largely unsuccessful.6 Since classic phenotypic assays focus on individual second messengers, it is difficult to comprehensively evaluate the action of molecules by such assays, which results in a poor correlation between in vitro results and in vivo indications.31 Given that the label-free DMR assay provides integrated cellular responses read-outs, we attempted to develop a new phenotypic assay using native cells to identify novel ligands against PAR-1.PAR-1 is expressed in many tissues and cell types. As signaling-dependent relocation of cellular constituents is likely to be affected by the cellular background, the DMR profiles of different cells were mapped after PAR-1 agonist stimulation in an attempt to identify a suitable cell type to be used as a model system.22 Robust and concentration-dependent DMR signals triggered by two probe agonists (thrombin and TRAP-6) were acquired from A431 cells, thus making them an ideally native cell type for further DMR assays. Agonism and desensitization results of agonists in A431 cells showed that thrombin may activate a more complicated DMR response, especially at a high concentration. Therefore, thrombin exhibited a higher EC50 value than previously reported and presented a limited desensitization effect to TRAP-6. This is because thrombin, as a protease, can cleave multiple other proteins that may influence outcomes and, also, proteolysis per se can activate multiple signaling pathways. The activating peptide TRAP-6 has been thought to mimic the effects of proteases and is widely used to probe the functions of PAR-1 without the use of proteases.39–41 The TRAP-6 triggered DMR signals can be inhibited by two PAR-1 antagonists (vorapaxar and atopaxar), suggesting that the DMR of PAR-1 agonists is specific to PAR-1 activation in A431 cells.
The amount of DMSO played a critical role in assay performance. DMSO is widely used as a solvent for compound solutions. However, previous literature revealed that DMSO is capable of eliciting changes not only in the index of refraction, but also on the cells themselves.42 To match the bulk refractive index prior to and after compound addition in a standard cell-based assays (i.e. the Epic® System), it is recommended that the amount of DMSO added to the cells should keep consistent in each step, otherwise DMSO can affect the DMR signals if different amounts of DMSO are used in the DMR assay wash buffer, equilibrium buffer and compound solution. The results revealed that higher concentrations of DMSO attenuate the maximum DMR signals greatly, particularly in TRAP-6 stimulation at low concentration. The reason for this could be that high amounts of DMSO may exert cytotoxic effects. Therefore, the amount of DMSO should depend on specific conditions and the maximum amount should not exceed 0.5%.
Due to the increasing size of compound libraries, high-throughput screening is crucial to drug discovery and development. However, false screening results have been posed an enormous challenge in the development of effective the screening assays. To overcome that, a secondary screening strategy, using the DMR assay, was adopted in this study. Compound activity was evaluated using three concentrations in the preliminary screening, and of which compounds displaying inhibitory activity over 35% at any concentration were classified as potent compounds. Furthermore, to identify candidate compounds, secondary screening assays were conducted using concentration-dependent measurements after MTT assay. Potent compounds displaying concentration-dependent potency were utilized for further activity validation. Results showed that five candidate compounds were screened out using the DMR assay, of which two revealed better anti-platelet aggregation activity than other compounds using in vitro assay. Although the DMR screening assay may also generate incorrect screening outcomes, we believe that this label-free assay could potentially become an effective screening assay for GPCR drug discovery.
7 Conclusion
In summary, we have developed a label-free approach, using native cells endogenously expressing PAR-1, for the screening of active compounds. Basically, the RWG biosensor was used as a non-invasive monitor to observe the real time cellular response and convert it into a biosensor signal, termed DMR. Results demonstrated that this new method was successfully applied to screen for active compounds. In contrast to conventional single-point assays, the integrative readout of the DMR assays permits the assessment of drug action with wide pathway coverage, making it more appropriate for in vivo applications. The non-invasive measurement enables DMR assays to probe compound action under a wide range of conditions. In brief, this newly established method provides a rapid, label-free, and integrated compound evaluation for GPCR drug discovery.Conflicts of interest
There are no conflicts to declare.Abbreviations
| PAR-1 | Protease activated receptor 1 |
| DMR | Dynamic mass redistribution |
Acknowledgements
This work was financially supported by the National Natural Science Foundation of China (No. 81421005), “Twelfth-Five Years” Supporting Programs from the Ministry of Science and Technology of China (No. 2015ZX09101043-010) and the Priority Academic Program Development of Jiangsu Higher Education Institutions.References
- V. Katritch, V. Cherezov and R. C. Stevens, Annu. Rev. Pharmacol. Toxicol., 2013, 53, 531–556 CrossRef CAS PubMed.
- P. Kumari, E. Ghosh and A. K. Shukla, Trends Mol. Med., 2015, 21, 687–701 CrossRef CAS PubMed.
- E. Reiter and R. J. Lefkowitz, Trends Endocrinol. Metab., 2006, 17, 159–165 CrossRef CAS PubMed.
- D. S. Kang, X. Tian and J. L. Benovic, Curr. Opin. Cell Biol., 2014, 27, 63–71 CrossRef CAS PubMed.
- B. C. Heng, D. Aubel and M. Fussenegger, Biotechnol. Adv., 2013, 31, 1676–1694 CrossRef CAS PubMed.
- R. Ramachandran, F. Noorbakhsh, K. DeFea and M. D. Hollenberg, Nat. Rev. Drug Discovery, 2012, 11, 69–86 CrossRef CAS PubMed.
- N. Vergnolle, Pharmacol. Ther., 2009, 123, 292–309 CrossRef CAS PubMed.
- J. S. Bae, L. Yang, C. Manithody and A. R. Rezaie, Blood, 2007, 110, 3909–3916 CrossRef CAS PubMed.
- S. L. French, J. F. Arthur, H. A. Tran and J. R. Hamilton, Blood Rev., 2015, 29, 179–189 CrossRef CAS PubMed.
- D. B. Bylund and M. L. Toews, Am. J. Physiol.: Lung Cell. Mol. Physiol., 1993, 265, L421–L429 CAS.
- S. Engel, A. P. Skoumbourdis, J. Childress, S. Neumann, J. R. Deschamps, C. J. Thomas, A. O. Colson, S. Costanzi and M. C. Gershengorn, J. Am. Chem. Soc., 2008, 130, 5115–5123 CrossRef CAS PubMed.
- X. F. Hou, S. C. Wang, T. Zhang, J. Ma, J. Zhang, Y. M. Zhang, W. Lu, H. Z. He and L. C. He, J. Pharm. Biomed. Anal., 2014, 101, 141–150 CrossRef CAS PubMed.
- I. Navratilova and A. L. Hopkins, Future Med. Chem., 2011, 3, 1809–1820 CrossRef CAS PubMed.
- W. Thomsen, J. Frazer and D. Unett, Curr. Opin. Biotechnol., 2005, 16, 655–665 CAS.
- G. Milligan, Trends Pharmacol. Sci., 2003, 24, 87–90 CrossRef CAS PubMed.
- C. Williams, Nat. Rev. Drug Discovery, 2004, 3, 125–135 CrossRef CAS PubMed.
- E. Trinquet, R. Bouhelal and M. Dietz, Expert Opin. Drug Discovery, 2011, 6, 981–994 CrossRef CAS PubMed.
- K. Liu, N. Southall, S. A. Titus, J. Inglese, R. L. Eskay, P. Shinn, C. P. Austin, M. A. Heilig and W. Zheng, Assay Drug Dev. Technol., 2010, 8, 362–374 CrossRef CAS PubMed.
- F. Zanella, J. B. Lorens and W. Link, Trends Biotechnol., 2010, 28, 237–245 CrossRef CAS PubMed.
- J. D. Violin and R. J. Lefkowitz, Trends Pharmacol. Sci., 2007, 28, 416–422 CrossRef CAS PubMed.
- M. Rocheville and J. C. Jerman, Curr. Opin. Pharmacol., 2009, 9, 643–649 CrossRef CAS PubMed.
- T. Kenakin, Nat. Biotechnol., 2010, 28, 928–930 CrossRef CAS PubMed.
- R. Barbour and M. P. Bova, Bioanalysis, 2012, 4, 619–622 CrossRef CAS PubMed.
- M. Saitakis and E. Gizeli, Cell. Mol. Life Sci., 2012, 69, 357–371 CrossRef CAS PubMed.
- R. Schroeder, J. Schmidt, S. Blaettermann, L. Peters, N. Janssen, M. Grundmann, W. Seemann, D. Kaufel, N. Merten, C. Drewke, J. Gomeza, G. Milligan, K. Mohr and E. Kostenis, Nat. Protoc., 2011, 6, 1748–1760 CrossRef CAS PubMed.
- R. Schroeder, N. Janssen, J. Schmidt, A. Kebig, N. Merten, S. Hennen, A. Mueller, S. Blaettermann, M. Mohr-Andrae, S. Zahn, J. Wenzel, N. J. Smith, J. Gomeza, C. Drewke, G. Milligan, K. Mohr and E. Kostenis, Nat. Biotechnol., 2010, 28, 943–949 CrossRef CAS PubMed.
- L. Wei, J. X. Wang, X. L. Zhang, P. Wang, Y. P. Zhao, J. Q. Li, T. Hou, L. L. Qu, L. Y. Shi, X. M. Liang and Y. Fang, J. Med. Chem., 2016, 60, 362–372 CrossRef PubMed.
- X. L. Zhang, H. Y. Deng, Y. S. Xiao, X. Y. Xue, A. M. Ferrie, E. Tran, X. M. Liang and Y. Fang, RSC Adv., 2014, 4, 26368–26377 RSC.
- N. N. Du, Y. F. Liu, X. L Zhang, J. X. Wang, J. Q Zhao, J. He, H. Zhou, L. J. Mei and X. M. Liang, Sci. Rep., 2017, 7, 46067 CrossRef CAS PubMed.
- J. X. Wang, T. Hou, L. Wei, L. Y. Shi, J. He, N. Zhou, G. W. Sun, X. L. Zhang and X. M. Liang, RSC Adv., 2015, 5, 25768–25776 RSC.
- A. M. Ferrie, H. Sun and Y. Fang, Sci. Rep., 2011, 1, 33 CrossRef PubMed.
- T. Hou, L. Y. Shi, J. X. Wang, L. Wei, L. L. Qu, X. L. Zhang and X. M. Liang, Pharmacol. Res., 2016, 108, 39–45 CrossRef CAS PubMed.
- G. V. R. Born and M. J. Cross, J. Physiol., 1963, 168, 178 CrossRef CAS.
- M. N. Adams, R. Ramachandran, M. K. Yau, J. Y. Suen, D. P. Fairlie, M. D. Hollenberg and J. D. Hooper, Pharmacol. Ther., 2011, 130, 248–282 CrossRef CAS PubMed.
- M. E. Maragoudakis and N. E. Tsopanoglou, Thrombin: physiology and disease, Springer, New York, 2010, ch. 12 Search PubMed.
- R. Irannejad and M. von Zastrow, Curr. Opin. Cell Biol., 2014, 27, 109–116 CrossRef CAS PubMed.
- J. H. Zhang, T. D. Y. Chung and K. R. Oldenburg, J. Biomol. Screening, 1999, 4, 67–73 CrossRef PubMed.
- R. Shah, Am. Heart J., 2009, 157, 253–262 CrossRef CAS PubMed.
- P. Zhao, M. Metcalf and N. W. Bunnett, Front. Endocrinol., 2014, 5, 67 Search PubMed.
- Y. V. Kim, F. Di Cello, C. S. Hillaire and K. S. Kim, Am. J. Physiol.: Cell Physiol., 2004, 286, C31–C42 CrossRef CAS PubMed.
- R. Ramachandran, K. Mihara, M. Mathur, M. D. Rochdi, M. Bouvier, K. DeFea and M. D. Hollenberg, Mol. Pharmacol., 2009, 76, 791–801 CrossRef CAS PubMed.
- Y. Fang, A. M. Ferrie, N. H. Fontaine, J. Mauro and J. Balakrishnan, Biophys. J., 2006, 91, 1925–1940 CrossRef CAS PubMed.
Footnote |
| † Electronic supplementary information (ESI) available. See DOI: 10.1039/c7ra07927c |
| This journal is © The Royal Society of Chemistry 2017 |

