DOI:
10.1039/C7RA07096A
(Paper)
RSC Adv., 2017,
7, 37214-37219
Highly efficient removal of methylene blue by a synthesized TiO2/montmorillonite-albumin nanocomposite: kinetic and isothermal analysis in water
Received
26th June 2017
, Accepted 21st July 2017
First published on 27th July 2017
Abstract
Color removal from industrial effluents, especially in the textile and dyeing industries, is of great interest nowadays. In this research an experimental study was performed to investigate the efficiency of a TiO2/montmorillonite-albumin nanocomposite (TMAN), synthesized by a green process for the first time, in the removal of methylene blue (MB) from solutions. The as-synthesized TMAN was characterized using transmission electron microscopy (TEM), Fourier transformed infrared spectroscopy (FT-IR) and powder X-ray diffraction (XRD). The results of the evaluations showed that the particle size of TMAN is about 21.79 ± 8.671 nm. The effect of different parameters such as initial concentration of MB, contact time, adsorbent dosage and pH were determined. The results showed that increasing the concentration of MB, adsorbent dosage, temperature and pH increases the removal efficiency of MB. The optimum for this process was reached at 3 h and the optimum pH for adsorption of MB with by TMAN was in the range of 7–11. The equilibrium data were also fitted to the Temkin, Langmuir and Freundlich equilibrium isotherm models. The results showed that the data fitted to Langmuir (R2 = 0.965) better compared with Freundlich (R2 = 0.936) and Temkin (R2 = 0.774) models. Maximum adsorption capacity was 18.18 mg g−1. Since industrial wastewaters have alkaline pH, TMAN can be used for the removal of dyes from industrial wastewaters and aqueous solutions.
Introduction
Hazardous compounds and synthetic dyestuffs discharged in effluents from different industries, such as dyestuff, plastics, textiles, leather and paper, are of significant importance.1,2 Discharge of the dyes to the environment can cause several problems to aquatic biota and human health because of their toxic, mutagenic and carcinogenic effects.3,4 It has been reported that the presence of trace amounts of many dyes in water can be detected visually and is not desirable. Therefore, the removal of such dyes from water to return to standard levels is necessary. Different techniques such as floatation, biological treatment, adsorption, coagulation and chemical oxidation have been used for the removal of dyes from wastewaters.5–7 Various adsorbents can be used for the removal of methylene blue from wastewaters such as those from physical and chemical processes. However, these techniques can be economical if the solute concentrations are relatively high. Thus, the adsorption processes can be effective and interesting for the removal of dyes from wastewaters. Techniques for adsorption of dyes on various adsorbents have been widely investigated.8–19
In this study, TMAN was used and characterized as an effective sorbent for removing MB from aqueous solutions. The effects of MB concentration, contact time, temperature, pH and dosage of TMAN and the kinetic, equilibrium and thermodynamic data on batch adsorption studies were evaluated.
Results and discussion
Characterization of TMAN
The structure of TMAN was characterized using X-ray diffraction (XRD). XRD study (Fig. 1) showed that the particles are crystalline in nature, with a tetragonal structure of anatase TiO2, as shown by the green indexes.
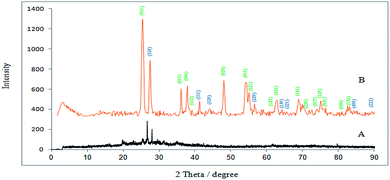 |
| | Fig. 1 XRD image of (A) montmorillonite and (B) TMAN. | |
TEM and SEM images (Fig. 2) showed that the synthesized TMAN has nano dimension with mean diameter and standard deviation for 21.79 ± 8.671 nm and has uniform distribution of nano particles without agglomeration.
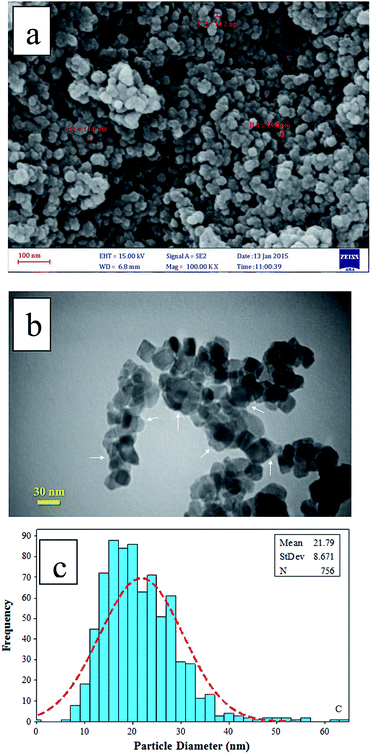 |
| | Fig. 2 SEM (a), TEM (b) and particle diameter (c) images of TMAN. | |
FT-IR spectrum of TMAN (Fig. 3) show adsorption bands at 486 and 738 cm−1 are assigned to the O–Ti–O bonding. The peak corresponding to OH stretching of adsorbed water is observed at 3411 cm−1 while the vibration of OH in water is shown at 1634 cm−1. The peak at 2300 cm−1 is attributed to N–H stretching vibration.9,20
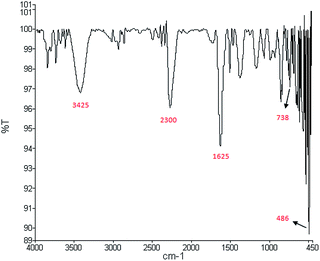 |
| | Fig. 3 FT-IR spectrum of TMAN. | |
Effect of pH
The solution pH can be important for the adsorption process. Because the hydrogen and hydroxyl ions can be adsorbed very easily, the adsorption of other ions into sorbent may be influenced by the pH. Therefore, the effect of pH on the adsorption of MB has been evaluated. Fig. 4 shows the pH effect in the adsorption of MB onto TMAN in the range of 3–11.
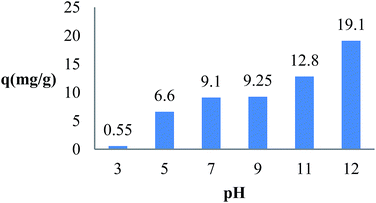 |
| | Fig. 4 Effect of pH on the adsorption of MB by TMAN. (C0 = 5 mg L−1, V = 25 ml, m = 0.005 g, T = 30 °C). | |
It was found that the qe value is increased with the increasing pH and the highest value was observed in the pH range of 7–11. This can be affected by the electrostatic attraction between the positively charged MB and the negatively charged surface of TMAN. By increasing the solution pH, the number of negatively charge sites can be increased causing enhanced attraction between MB and adsorbent surface.1,21
Effect of contact time
The adsorption capacity and removal of MB (R%) vs. contact time are shown Fig. 5. Findings showed that the sorption of MB (qt, mg g−1) is increased by contact time. The process was found to be fast during the first 45 min, increased slowly afterwards and finally remained constant with increasing contact time after 180 min. This is due to the fact that many active surfaces are at hand for sorption of MB on the TMAN. The diffusion of MB from the solution to the adsorbent surface can then be done. The removal rate gradually slowed down until the equilibrium was established.21
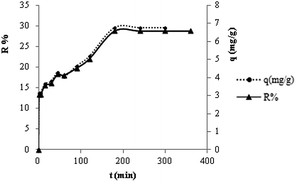 |
| | Fig. 5 Effect of contact time on the adsorption of MB by TMAN. | |
Effect of adsorbent dose
In Fig. 6 qe and the removal percentage of MB (R%) at different doses of TMAN are shown. As the TMAN concentration increased from 0.25 to 1.6 g L−1, the percentage of adsorbed MB increased from 10 to 84.45%. It can also be observed that increasing the TMAN amount decreases the adsorption capacity of MB. It has been reported that higher adsorbent dosages provide a large excess of the active sites leading to a lower utility of the sites at a certain concentration of MB solution.3
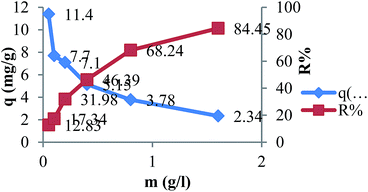 |
| | Fig. 6 Effect of adsorbent dose on the adsorption of MB by TMAN. (C0 = 5 mgL−1, V = 25 ml, t = 180 min, pH = 7, T = 30 °C). | |
Effect of adsorbent dose
The effect of the MB concentration on adsorption can be observed in Fig. 7 qe increases as the initial MB concentration increases within the range of experimental temperatures. This can be because of the effect of higher initial MB concentration on the interaction between adsorbent and MB.7
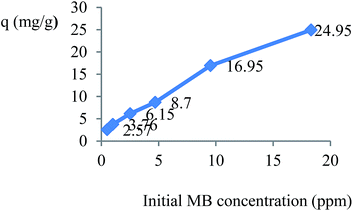 |
| | Fig. 7 Effect of initial MB concentration on the adsorption of MB by TMAN. (V = 25 ml, t = 180 min, pH = 7, m = 0.005 g). | |
Effect of temperature
Fig. 8 indicates that the amount of MB adsorbed onto TMAN nanocomposite increases with increased temperature, which could result from the endothermic nature of the sorption process.21
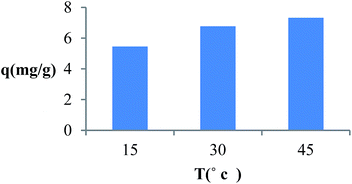 |
| | Fig. 8 Effect of temperature on the adsorption of MB by TMAN. (V = 25 ml, t = 180 min, pH = 7, m = 0.005 g). | |
Adsorption isotherms
In this paper, Langmuir, Freundlich and Temkin isotherms were used to evaluate the adsorption parameters.
Langmuir isotherm. The Langmuir isotherm theory is based on the assumption that adsorption takes place at specific homogeneous sites within the adsorbent. In addition, the interaction among adsorbed substance can be negligible and the adsorbent surface is saturated after monolayer adsorption. Langmuir isotherm equation is expressed as follows.6| |
 | (1) |
where qmax is the theoretical maximum adsorption capacity per unit weight of adsorbent (mg g−1), KL is Langmuir adsorption constant (L mg−1), Ce is the equilibrium concentration of the solution (mg L−1) and qe is the equilibrium adsorption capacity per unit weight of adsorbent (mg g−1). The essential characteristics of the Langmuir isotherm can be expressed in terms of a dimensionless separation factor RL, which is expressed as:| |
 | (2) |
where KL is Langmuir constant (L mg−1), C0 is maximum initial MB concentration (mg L−1) and RL is a dimensionless separation factor. The parameter RL indicates the shape of Langmuir isotherm to be either irreversible (RL = 0), favorable (0 < RL < 1), linear (RL = 1) or unfavorable (RL > 1). Fig. 9 shows Langmuir isotherm for adsorption of MB by TMAN.
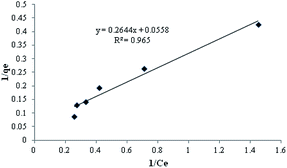 |
| | Fig. 9 Langmuir isotherm for adsorption of MB by TMAN. | |
Freundlich isotherm. The Freundlich isotherm is an empirical equation employed to describe heterogeneous surface systems.3 The Freundlich equation is expressed as follows:| |
 | (3) |
where KF (L mg−1) and 1/n are Freundlich constants, Ce is the equilibrium concentration of the solution (mg L−1) and qe is the equilibrium adsorption capacity per unit weight of adsorbent (mg g−1). Fig. 10 shows Freundlich isotherm for adsorption of MB by TMAN.
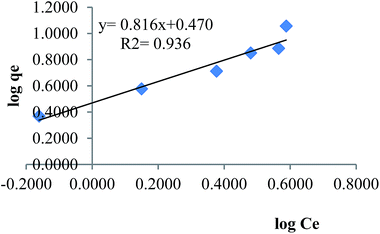 |
| | Fig. 10 Freundlich isotherm for adsorption of MB by TMAN. | |
Temkin isotherm. The Temkin equation is expressed as:where A and B are Temkin isotherm constants, A is the equilibrium binding constant (L mg−1) and corresponds to the maximum binding energy and constant B is related to the heat of adsorption.13 It has been reported that Temkin isotherm assumes that (i) the heat of adsorption of all the molecules in the layer decreases linearly with coverage due to adsorbent–adsorbate interactions and (ii) adsorption is characterized by a uniform distribution of binding energies up to some maximum binding energy.6 All the constants are presented in Table 1. Fig. 11 shows Temkin isotherm for adsorption of MB by TMAN.
Table 1 The values of parameters for each isotherm model used in the studies
| Isotherms |
Parameters |
| Langmuir |
qmax (mg g−1) = 18.18 |
| KL (L mg−1) = 0.2 |
| RL = 0.5 |
| R2 = 0.965 |
| Freundlich |
KF (L g−1) = 2.95 |
| n = 1.22 |
| R2 = 0.936 |
| Temkin |
A (L g−1) = 2.019 |
| B (J mol−1) = 4.25 |
| R2 = 0.774 |
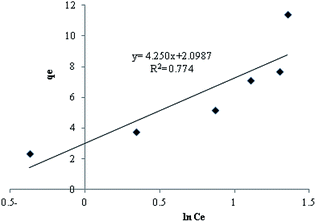 |
| | Fig. 11 Temkin isotherm for adsorption of MB by TMAN. | |
Thermodynamic parameters. Thermodynamic parameters indicate the spontaneity of an adsorption process. In order to determine the mechanism of adsorption process, thermodynamic parameters such as ΔG°, ΔH° and ΔS° must be considered. The thermodynamic equilibrium constant, Kd, can be calculated using the following equations:6| |
 | (5) |
The increase in Kd with increase in temperature indicates the endothermic nature of the process. ΔG°, ΔH° and ΔS° were calculated using the following equations:
| |
ΔG° = −RT![[thin space (1/6-em)]](https://www.rsc.org/images/entities/char_2009.gif) ln(Kd) ln(Kd)
| (6) |
A plot of ln(
Kd)
versus 1/
T was found to be linear and Δ
H° and Δ
S° were determined from the slope and intercept of the plot, respectively (
Table 2).
Table 2 Thermodynamic parameters calculated for the adsorption of MB on TMAN
| T (°K) |
Kd |
ΔG° (kJ mol−1) |
ΔH° (kJ mol−1) |
ΔS° (J mol−1 K−1) |
| 288 |
0.3019 |
2.8674 |
|
|
| 303 |
0.4072 |
2.2634 |
10.4839 |
26.6629 |
| 318 |
0.4551 |
2.0813 |
|
|
Adsorption kinetics
The mechanism of adsorption depends on the physical and/or chemical characteristics of the adsorbent as well as the mass transport process. In order to determine the mechanism of MB adsorption onto TMAN nanocomposite, several commonly used adsorption kinetic models were employed to discuss the controlling mechanism.
The pseudo first order model. The pseudo first order model of Lagergren is based on the assumption that the rate of change of adsorbed solute with time is proportional to the difference in equilibrium adsorption capacity and the adsorbed amount. The pseudo first-order equation is expressed as follows:| | |
log[(qe − qt)] = log[(qe − (k1t)/2.303)]
| (8) |
where qe and qt are the adsorption capacity per unit weight of adsorbent at equilibrium and at time t (min), respectively (mg g−1), and k1 is the pseudo first order rate constant (min−1). A plot of log(qe − qt) vs. time gave a straight line. The values of qe and k1 were computed from the slope and intercept of the plot, respectively (Fig. 12).
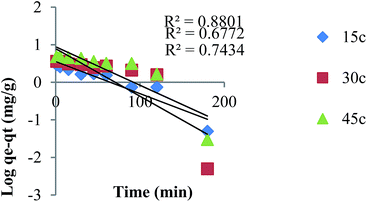 |
| | Fig. 12 The pseudo-first order kinetic plot for adsorption of MB TMAN. | |
The pseudo second order model. Pseudo second order kinetic is a kinetic model to predict the relationship between qexp and qcalculated. The fitness between experimental data and the model predicted values was expressed by the correlation coefficients (R2) and closeness of experimental and theoretical adsorption capacity values. This model, which is presented in the following equation, was found to successfully represent the kinetics of several sorption systems:21| |
 | (9) |
Pseudo second order kinetic constants were determined for three initial temperatures (15, 30 and 45 °C) from the slope and the intercept of the plots of t/qt vs. t. Fig. 13 gives a straight line from which one can determine the values of k2 and qe. Table 3 illustrates that the calculated amounts of the adsorbed (qe calc.) values are close to the experimental data (qe exp.) and the correlation coefficients are high for pseudo second order kinetic model. Therefore, the adsorption of MB can be approximated more favorably by the pseudo second order model, which reinforces the applicability of this model. According to the pseudo second order, boundary layer resistance is not the rate limiting step. The external resistance model cannot adequately describe the adsorption mechanism and the rate controlling step was the chemical adsorption involving valence forces through exchange or sharing of the electrons between MB molecules and the adsorbent.
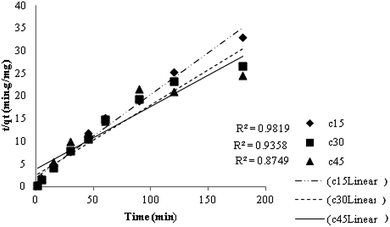 |
| | Fig. 13 The pseudo second order kinetic plot for adsorption of MB by TMAN. | |
Table 3 Comparison of adsorption capacities of various adsorbents for MB
| Adsorbent |
qm (mg g−1) |
References |
| Activated carbon from almond shell |
1.33 |
(Langmuir, 1916) |
| Glass wool |
2.2436 |
(Kundu and Gupta, 2006) |
| Fly ash |
2.755–3.074 |
(Langmuir, 1918) |
| Activated carbon from walnut shell |
3.53 |
(Langmuir,1916) |
| Activated carbon from apricot stones |
4.11 |
(Langmuir,1916) |
| Clay |
4.4–6.3 |
(El-Gammal et al., 2012) |
| Raw P. oceanica fibers |
5.56 |
(Sharma et al., 2009) |
| Rice husk |
8.07 |
(El-Kamash, 2008) |
| Activated carbon from hazelnut shell |
8.82 |
(Langmuir, 1916) |
| Marble dust |
16.36 |
(Hamed, 2014) |
| Neem leaf powder |
19.61 |
(Metwally et al., 2011) |
| TMAN |
18.18 |
This work |
Table 3 represents a comparison of the adsorption capacity of the TMAN obtained in this study with other adsorbents for the adsorption of MB.
Conclusion
The adsorption of MB from aqueous solutions using synthesized TMAN was investigated. Various factors such as contact time, adsorbent dose, initial MB concentration, solution pH and temperature were investigated. The initial pH experiments revealed that neutral or basic conditions were required to optimize the methylene blue biosorption. Langmuir, Freundlich and Temkin isotherms were employed to discuss the adsorption behavior. The experimental adsorption data fitted better to the Langmuir isotherm model. The monolayer saturation adsorption capacity of TMAN for MB was 18.18 mg g−1 at 303 K. Equilibrium, kinetic and thermodynamic studies were carried out regarding the adsorption of MB from aqueous solutions onto TMAN at pH 7. Thermodynamic analysis showed positive values of ΔH, indicating endothermic physical adsorption and positive values of ΔS, which showed increased disorder and randomness at the solid solution interface of MB with the adsorbent. The results of the kinetic models showed that the pseudo second order equation provided the best correlation of the sorption data. Hydroxyl groups were observed on the surface of the nanocomposite by FT-IR analysis. Based on the wide range of pH (7–11) for removal of MB solution and the fact that many industrial wastewaters have alkaline pH, this adsorbent can be used for the removal of dyes from industrial wastewaters and aqueous solutions.
Acknowledgements
We gratefully acknowledge the Islamic Azad University, Shahre-Qods Branch, for the support of this work.
References
- X. Han, W. Wang and X. Ma, Chem. Eng. J., 2011, 1, 171 Search PubMed.
- Z. Wu, H. Zhong, X. Yuan, H. Wang, L. Wang, X. Chen, G. Zeng and Y. Wu, Water Res., 2014, 67, 330 CrossRef CAS PubMed.
- Y. Liu, X. Chen, J. Li and C. Burda, Chemosphere, 2005, 61, 11 CrossRef CAS PubMed.
- H. Cherifi, B. Fatiha and H. Salah, Appl. Surf. Sci., 2013, 282, 52 CrossRef CAS.
- M. Gouamid, M. R. Ouahrani and M. B. Bensaci, Energy Procedia, 2013, 36, 907 CrossRef.
- P. Sharma, R. Kaur, C. Baskar and W. J. Chung, Desalination, 2010, 259, 249 CrossRef CAS.
- Z. Aksu, S. Ertugrul and G. Donmez, Chem. Eng. J., 2010, 158, 474 CrossRef CAS.
- Z. Li, P. H. Chang, W. T. Jiang, J. S. Jean and H. Hong, Chem. Eng. J., 2011, 168, 1193 CrossRef CAS.
- S. Hong, C. Wen, J. He, F. Gan and Y. S. Ho, J. Hazard. Mater., 2009, 167, 630 CrossRef CAS PubMed.
- S. A. E. Ofomaja and Y. S. Ho, Bioresour. Technol., 2008, 99, 5411 CrossRef PubMed.
- J. L. Gong, Y. L. Zhang, Y. Jiang, G. M. Zeng, Z. H. Cui, K. Liu, C. H. Deng, Q. Y. Niu, G. H. Deng and S. Y. Huan, Appl. Surf. Sci., 2015, 330, 148 CrossRef CAS.
- M. A. Rauf, I. Shehadeh, A. Ahmed and A. Al-Zamly, World. Acad. Sci. Eng. Tech., 2009, 3, 26 Search PubMed.
- M. Dogan, Y. Ozdemir and M. Alkan, Dyes Pigm., 2007, 75, 701 CrossRef CAS.
- S. Shanthi and T. Mahalakshmi, Int. J. Res. Pharm. Chem., 2012, 2, 2231 Search PubMed.
- M. A. Mohammed, A. Shitu and A. Ibrahim, J. Chem. Sci., 2014, 4, 91 Search PubMed.
- M. Ahmadi, S. Sedaghat and L. Khalafi, J. Appl. Chem. Res., 2015, 9, 117 Search PubMed.
- S. Patil, S. Renukdas and N. Patel, Int. J. Environ. Sci., 2011, 15, 726 Search PubMed.
- Y. Yao, F. Xu, M. Chen, Z. Xu and Z. Zhu, Bioresour. Technol., 2010, 101, 3040 CrossRef CAS PubMed.
- A. Varmarzyar. M.Sc thesis, Department of Chemistry, Shahre-Qods Branch, Islamic Azad University, Tehran, Iran, 2015.
- M. M. Hamed, I. M. Ahmed and S. S. Metwally, J. Ind. Eng. Chem., 2014, 202, 370 Search PubMed.
- Y. Yao, F. Xu, M. Chen, Z. Xu and Z. Zhu, Bioresour. Technol., 2010, 101, 3040 CrossRef CAS PubMed.
|
| This journal is © The Royal Society of Chemistry 2017 |
Click here to see how this site uses Cookies. View our privacy policy here.  Open Access Article
 b
b


![[thin space (1/6-em)]](https://www.rsc.org/images/entities/char_2009.gif) ln(Ce) + B
ln(Ce) + B![[thin space (1/6-em)]](https://www.rsc.org/images/entities/char_2009.gif) ln
ln![[thin space (1/6-em)]](https://www.rsc.org/images/entities/char_2009.gif) A
A

![[thin space (1/6-em)]](https://www.rsc.org/images/entities/char_2009.gif) ln(Kd)
ln(Kd)


