 Open Access Article
PdZn nanoparticle electrocatalysts synthesized by solution combustion for methanol oxidation reaction in an alkaline medium†
M. A. Matina,
A. Kumar *a,
R. R. Bhosalea,
M. A. H. Saleh Saada,
F. A. Almomania and
M. J. Al-Marriab
aDepartment of Chemical Engineering, Qatar University, P.O. Box 2713, Doha, Qatar. E-mail: akumar@qu.edu.qa
bGas Processing Center, Qatar University, P.O. Box 2713, Doha, Qatar
First published on 4th September 2017
Abstract
Herein, we report the synthesis of PdZn nanoparticle (NP) electrocatalysts for the methanol oxidation reaction (MOR). The PdZn NPs were synthesized by solution combustion synthesis in the presence of Pd(NO3)2·xH2O, Zn(NO3)2·6H2O and glycine in H2O, where glycine acted as a fuel. In this synthesis, the glycine amount was varied with a fixed stoichiometric ratio of Pd- and Zn-precursors at 1![[thin space (1/6-em)]](https://www.rsc.org/images/entities/char_2009.gif) :
:![[thin space (1/6-em)]](https://www.rsc.org/images/entities/char_2009.gif) 1 to obtain two electrocatalysts (PdZn/C) of fuel-high (glycine to metal nitrate ratio = 1.75), PdZn/C (1.75) and fuel-low (glycine to metal nitrate ratio = 0.5), PdZn/C (0.5). The NPs were characterized by X-ray diffractometry, transmission electron microscopy and scanning electron microscopy for the crystallite size, morphology and elemental composition of the electrocatalysts. High-angle annular dark-field-scanning transmission electron microscopy coupled to energy dispersive X-ray spectroscopy was used to obtain the elemental distribution maps of the aggregated NPs, which confirmed the NPs with Pd and Zn in the alloyed state. X-ray photoelectron spectroscopy was performed to analyze the electronic structures of the elements in the samples. The NPs were then applied in the electrocatalysis for MOR in an alkaline medium. We found that PdZn/C showed an improved electrocatalytic activity by a factor of ∼1.4–1.9 in comparison with Pd/C synthesized using the same method. The MOR on PdZn/C (1.75) began at an earlier onset potential and higher current density than for Pd/C and PdZn/C (0.5). Stability tests were performed by chronoamperometry on PdZn/C and Pd/C, and the results showed a higher stability of PdZn/C (1.75) compared to PdZn/C (0.5) and Pd/C. The fuel amount affected the NP sizes, reaction yield and electrocatalytic properties.
1 to obtain two electrocatalysts (PdZn/C) of fuel-high (glycine to metal nitrate ratio = 1.75), PdZn/C (1.75) and fuel-low (glycine to metal nitrate ratio = 0.5), PdZn/C (0.5). The NPs were characterized by X-ray diffractometry, transmission electron microscopy and scanning electron microscopy for the crystallite size, morphology and elemental composition of the electrocatalysts. High-angle annular dark-field-scanning transmission electron microscopy coupled to energy dispersive X-ray spectroscopy was used to obtain the elemental distribution maps of the aggregated NPs, which confirmed the NPs with Pd and Zn in the alloyed state. X-ray photoelectron spectroscopy was performed to analyze the electronic structures of the elements in the samples. The NPs were then applied in the electrocatalysis for MOR in an alkaline medium. We found that PdZn/C showed an improved electrocatalytic activity by a factor of ∼1.4–1.9 in comparison with Pd/C synthesized using the same method. The MOR on PdZn/C (1.75) began at an earlier onset potential and higher current density than for Pd/C and PdZn/C (0.5). Stability tests were performed by chronoamperometry on PdZn/C and Pd/C, and the results showed a higher stability of PdZn/C (1.75) compared to PdZn/C (0.5) and Pd/C. The fuel amount affected the NP sizes, reaction yield and electrocatalytic properties.
Introduction
Fuel cells (FCs) are considered among the conceivable alternatives to fossil fuel energy resources as they can produce energy with fewer harmful exhausts and eventually contribute to the reduction of global warming and protection of the ecosystem. Recent research on FCs, associated with energy technologies, has shown that they could be utilized for diverse applications as a least-polluting energy source in household and commercial industries.1–3 FC energy is now expected to have a significant application in the future from the use of micro fuel cells for powering cell phones to high-powered FCs for vehicles and power stations. Among the various types of FCs, direct methanol fuel cells (DMFCs) are being intensively studied because of their low operating temperature and high energy conversion and efficiency. Furthermore, they are environment-friendly and thus could be successfully used as a micro-power energy source. However, FCs require two types of catalysts, namely anode and cathode catalysts, to perform oxidation at the anode and reduction at the cathode, respectively.4–9Platinum (Pt) and Pt-based electrocatalysts are the key catalyst materials for both anode and cathode of FCs in acidic media. However, a number of challenges associated with Pt such as high-cost, sluggish kinetics, scarcity and CO poisoning at the anode preclude the wider application of DMFCs at the anode side of FCs.3,9–17 Since palladium (Pd) is relatively more abundant in the earth's crust, Pd could be a better alternative for anodic electrode materials.18 In order to replace Pt completely at the anode side of FCs, many researchers have reported that Pd and Pd-based catalysts exhibit lower CO poisoning in alkaline media; their use would reduce the cost of the electrode materials as well as limit the excess utilization of Pt, which is considered a rare metal.2,19–25 The Pd catalysts are commonly synthesized by conventional methods, such as sol–gel, impregnation, solvothermal, sputtering, electrodeposition, co-deposition and co-precipitation. Some of these methods require multiple steps and the use of ancillary materials, whereas others require the use of specific techniques to attain the desired nanoparticle (NP) shape and size when these NPs are prepared at high temperature. As a result, these methods incur an increased disposable production cost and potential environmental consequences/hazards.21,26–28 A reliable method is necessitated to reduce the production costs of the electrocatalysts and thus facilitate their widespread commercialization.
In 1967, Merzhanov et al.29 presented the concept of self-spreading high-temperature synthesis (SHS) for economically synthesizing advanced functional materials using self-sustained exothermic reactions. However, one major shortcoming of SHS was the difficulty in obtaining nanoparticles possessing a high surface area. Later, Patil et al.30 further developed this method in combination with wet chemistry and termed it as solution combustion synthesis (SCS). A wide variety of nanostructured materials has been synthesized by SCS based techniques for their applications in pigments, electronic and magnetic devices, and energy conversion and storage devices.31–34 With further recent innovations, the SCS technique has been used to synthesize a variety of nanomaterials for catalytic applications.35–44
Previously, we used the SCS method for the synthesis of multi-component-nanostructured catalysts for hydrogen production from the reforming/decomposition of light natural gas/alcohol.31,32 In this study, we applied the SCS method for the synthesis of two PdZn NP electrocatalysts for the methanol oxidation reaction (MOR), where glycine![[thin space (1/6-em)]](https://www.rsc.org/images/entities/char_2009.gif) :
:![[thin space (1/6-em)]](https://www.rsc.org/images/entities/char_2009.gif) fuel ratio was varied maintaining a fixed ratio of Pd- and Zn-precursors at 1
fuel ratio was varied maintaining a fixed ratio of Pd- and Zn-precursors at 1![[thin space (1/6-em)]](https://www.rsc.org/images/entities/char_2009.gif) :
:![[thin space (1/6-em)]](https://www.rsc.org/images/entities/char_2009.gif) 1. The as-synthesized PdZn NP electrocatalysts were then applied for the electrooxidation of CH3OH. We found that PdZn electrocatalysts showed better electrocatalytic activity than a Pd NP electrocatalyst synthesized using the same method in terms of the onset potential, current density and stability with the MOR.
1. The as-synthesized PdZn NP electrocatalysts were then applied for the electrooxidation of CH3OH. We found that PdZn electrocatalysts showed better electrocatalytic activity than a Pd NP electrocatalyst synthesized using the same method in terms of the onset potential, current density and stability with the MOR.
Experimental
Chemicals
The reagents palladium(II) nitrate hydrate (Pd(NO3)2, 97%), zinc(II) nitrate hexahydrate (Zn(NO3)2·6H2O, 98%), glycine (99.7%) and Nafion solution (5 wt%) were purchased from Sigma-Aldrich. Potassium hydroxide (KOH, 85%) and carbon black (VXC72) were purchased from Riedel-de Haen and Cabot Corporation, respectively. Ultrapure water (Millipore, 18.2 MΩ cm) was used for the entire study. All the reagents were used without any further purification.Synthesis
Weighed amounts of Pd(NO3)2·xH2O, Zn(NO3)2·6H2O and glycine were mixed with 20 mL of de-ionized water (DIW) in a 250 mL beaker, and then the beaker was kept on a sonic vibrator until a homogeneous solution was obtained. Then, the beaker containing the reaction reagents was placed on a hotplate at 250 °C. The water evaporated overtime and after ∼30 min, the catalysts were obtained at the end of the combustion reaction by self-ignition. The product was then ground using a mortar and a pestle to obtain uniform size of particles, and this was followed by sieving. In this way, we synthesized three catalysts in which the reaction ratios of the metal precursors of Pd(NO3)2![[thin space (1/6-em)]](https://www.rsc.org/images/entities/char_2009.gif) :
:![[thin space (1/6-em)]](https://www.rsc.org/images/entities/char_2009.gif) Zn(NO3)2 were maintained at 1
Zn(NO3)2 were maintained at 1![[thin space (1/6-em)]](https://www.rsc.org/images/entities/char_2009.gif) :
:![[thin space (1/6-em)]](https://www.rsc.org/images/entities/char_2009.gif) 1. The amount of glycine added in the mixture was calculated based on glycine to oxidizer ratio (ϕ) as defined in literature.31,32,38,41,45 The reactant ratios in the three samples (Pd(NO3)2
1. The amount of glycine added in the mixture was calculated based on glycine to oxidizer ratio (ϕ) as defined in literature.31,32,38,41,45 The reactant ratios in the three samples (Pd(NO3)2![[thin space (1/6-em)]](https://www.rsc.org/images/entities/char_2009.gif) :
:![[thin space (1/6-em)]](https://www.rsc.org/images/entities/char_2009.gif) Zn(NO3)2
Zn(NO3)2![[thin space (1/6-em)]](https://www.rsc.org/images/entities/char_2009.gif) :
:![[thin space (1/6-em)]](https://www.rsc.org/images/entities/char_2009.gif) glycine (ϕ)) were 1
glycine (ϕ)) were 1![[thin space (1/6-em)]](https://www.rsc.org/images/entities/char_2009.gif) :
:![[thin space (1/6-em)]](https://www.rsc.org/images/entities/char_2009.gif) 1
1![[thin space (1/6-em)]](https://www.rsc.org/images/entities/char_2009.gif) :
:![[thin space (1/6-em)]](https://www.rsc.org/images/entities/char_2009.gif) 1.75 for PdZn (1.75), 1
1.75 for PdZn (1.75), 1![[thin space (1/6-em)]](https://www.rsc.org/images/entities/char_2009.gif) :
:![[thin space (1/6-em)]](https://www.rsc.org/images/entities/char_2009.gif) 1
1![[thin space (1/6-em)]](https://www.rsc.org/images/entities/char_2009.gif) :
:![[thin space (1/6-em)]](https://www.rsc.org/images/entities/char_2009.gif) 0.5 for PdZn (0.5) and 1
0.5 for PdZn (0.5) and 1![[thin space (1/6-em)]](https://www.rsc.org/images/entities/char_2009.gif) :
:![[thin space (1/6-em)]](https://www.rsc.org/images/entities/char_2009.gif) 0
0![[thin space (1/6-em)]](https://www.rsc.org/images/entities/char_2009.gif) :
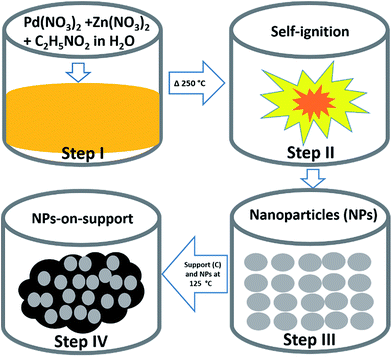
:![[thin space (1/6-em)]](https://www.rsc.org/images/entities/char_2009.gif) 1.75 for Pd, respectively. Then, 40% of the obtained catalyst powder was added to 60% of carbon support, dispersed in 7 mL DIW in a 50 mL beaker and then this mixture was heated to 125 °C until the water evaporated and the sample became completely dry. The schematic for the synthesis is shown in Fig. 1.
1.75 for Pd, respectively. Then, 40% of the obtained catalyst powder was added to 60% of carbon support, dispersed in 7 mL DIW in a 50 mL beaker and then this mixture was heated to 125 °C until the water evaporated and the sample became completely dry. The schematic for the synthesis is shown in Fig. 1.
Characterization techniques
X-ray diffraction (XRD) patterns were obtained using a powder X-ray diffractometer (Rigaku MiniFlexII Desktop, Cu-Kα radiation (λ = 1.54056 Å)). To perform the morphological study of the samples by transmission electron microscopy (TEM, TECNAI G2, F20 FEI), a small amount of the sample was ultrasonically dispersed in ethanol, and then a few drops of the NPs-dispersed solution were deposited onto carbon-coated Cu-grids, followed by drying under ambient conditions. In order to obtain the elemental distribution in NPs, high angle annular dark field (HAADF)-scanning transmission electron microscopy (FEI Talos F200X STEM) coupled to energy dispersive X-ray spectroscopy (FEI SuperX EDS system) was conducted. The elemental compositions and morphology of the particles in the samples were obtained using an energy dispersive X-ray spectroscopy analyzer coupled to a field-emission scanning electron microscope (SEM, Nova Nano 450, FEI). X-ray photoelectron spectroscopy (XPS, Kratos AXIS Ultra DLD) was conducted to analyze the oxidation state of the elements in the samples, and the reported binding energies (BEs) obtained from the XPS data were calibrated with respect to C 1s at 284.8 eV.Electrode fabrication
A homogeneous dispersion of 15 mg of a sample in 5 g of distilled water was obtained with the help of a sonicator. Furthermore, 20 μL of the dispersion was added dropwise by a calibrated micro-pipette onto the surface of a glassy carbon rotating disc electrode (RDE, d = 5.0 mm and geometric area, A = 0.196 cm2). The catalyst-coated electrode surface was dried under ambient conditions and then, 20 μL of 0.125 wt% Nafion solution was added on top of it to prevent the electrode materials from coming off the RDE surface.Electrochemical measurements
For all electrochemical measurements, a Pine instruments biopotentiostat (WaveDriver 20) was used to evaluate the electrochemical activity along with a standard three-electrode electrochemical cell consisting of a glassy carbon RDE coated with the catalyst as a working electrode, a Hg/Hg2SO4 in 4 M K2SO4 reference electrode, and a Pt-coil counter electrode. The working electrode was electrochemically pre-treated at a scan rate of 500 mV s−1 for 100 cycles prior to each measurement in the potential range from 0.1 to −0.6 V. Cyclic voltammograms (CVs) were measured in 1 M KOH aqueous solution in the potential range from 0.2 to −1.3 V at a scan rate of 50 mV s−1 under an N2 atmosphere. The electrocatalytic activity for the MOR was investigated by CVs in 1 M KOH containing 2 M CH3OH at a scan rate of 50 mV s−1 in the potential range from 0.5 to −0.8 V. Chronoamperometry was performed for the stability tests at 0.325 V using the same electrolyte with RDE (350 rpm) under an N2-ambient for 2 h.All the electrochemical measurements were performed at room temperature under ambient pressure, and a fresh electrolyte bubbled by N2-purging for 1 h was used for each measurement. The current densities obtained from the CVs were normalized with respect to the geometric surface area of the RDE, while the current densities obtained from the CVs for the MOR along with the chronoamperometric curves were normalized with respect to the amount of Pd used in the electrocatalytic activity.
Results and discussion
Structural characterization
PdZn/C electrocatalysts were synthesized by the SCS method in the presence of Pd(NO3)2·xH2O, Zn(NO3)2·6H2O and glycine in H2O, where glycine acted as a fuel. In each reaction, the ratios of weighed amounts of Pd- and Zn-precursors were fixed at 1![[thin space (1/6-em)]](https://www.rsc.org/images/entities/char_2009.gif) :
:![[thin space (1/6-em)]](https://www.rsc.org/images/entities/char_2009.gif) 1 for the two electrocatalysts, in which the glycine amount was varied according to the fuel to oxidizer ratio parameter (ϕ)31,32,38,41,45 with a ratio of 1.75 for Pd
1 for the two electrocatalysts, in which the glycine amount was varied according to the fuel to oxidizer ratio parameter (ϕ)31,32,38,41,45 with a ratio of 1.75 for Pd![[thin space (1/6-em)]](https://www.rsc.org/images/entities/char_2009.gif) :
:![[thin space (1/6-em)]](https://www.rsc.org/images/entities/char_2009.gif) Zn
Zn![[thin space (1/6-em)]](https://www.rsc.org/images/entities/char_2009.gif) :
:![[thin space (1/6-em)]](https://www.rsc.org/images/entities/char_2009.gif) glycine (1
glycine (1![[thin space (1/6-em)]](https://www.rsc.org/images/entities/char_2009.gif) :
:![[thin space (1/6-em)]](https://www.rsc.org/images/entities/char_2009.gif) 1
1![[thin space (1/6-em)]](https://www.rsc.org/images/entities/char_2009.gif) :
:![[thin space (1/6-em)]](https://www.rsc.org/images/entities/char_2009.gif) 1.75) and 0.5 for Pd
1.75) and 0.5 for Pd![[thin space (1/6-em)]](https://www.rsc.org/images/entities/char_2009.gif) :
:![[thin space (1/6-em)]](https://www.rsc.org/images/entities/char_2009.gif) Zn
Zn![[thin space (1/6-em)]](https://www.rsc.org/images/entities/char_2009.gif) :
:![[thin space (1/6-em)]](https://www.rsc.org/images/entities/char_2009.gif) glycine (1
glycine (1![[thin space (1/6-em)]](https://www.rsc.org/images/entities/char_2009.gif) :
:![[thin space (1/6-em)]](https://www.rsc.org/images/entities/char_2009.gif) 1
1![[thin space (1/6-em)]](https://www.rsc.org/images/entities/char_2009.gif) :
:![[thin space (1/6-em)]](https://www.rsc.org/images/entities/char_2009.gif) 0.5), respectively. These two electrocatalysts were termed here as PdZn/C (1.75) and PdZn/C (0.5) based on the glycine amount on the addition of the carbon support into them. In order to compare the electrocatalytic activity of the two PdZn/C NP electrocatalysts, we synthesized a Pd/C NP sample using the same method in which the ratio of the Pd-precursor
0.5), respectively. These two electrocatalysts were termed here as PdZn/C (1.75) and PdZn/C (0.5) based on the glycine amount on the addition of the carbon support into them. In order to compare the electrocatalytic activity of the two PdZn/C NP electrocatalysts, we synthesized a Pd/C NP sample using the same method in which the ratio of the Pd-precursor![[thin space (1/6-em)]](https://www.rsc.org/images/entities/char_2009.gif) :
:![[thin space (1/6-em)]](https://www.rsc.org/images/entities/char_2009.gif) glycine–fuel (ϕ) was 1
glycine–fuel (ϕ) was 1![[thin space (1/6-em)]](https://www.rsc.org/images/entities/char_2009.gif) :
:![[thin space (1/6-em)]](https://www.rsc.org/images/entities/char_2009.gif) 1.75. We also synthesized Zn NPs using the same method in which the ratio of the Zn-precursor and glycine–fuel (ϕ) was 1
1.75. We also synthesized Zn NPs using the same method in which the ratio of the Zn-precursor and glycine–fuel (ϕ) was 1![[thin space (1/6-em)]](https://www.rsc.org/images/entities/char_2009.gif) :
:![[thin space (1/6-em)]](https://www.rsc.org/images/entities/char_2009.gif) 1.75 for comparison with the XRD patterns of Zn in PdZn/C. In this study, we aimed to observe the effect of the fuel amount on the synthesis of the two PdZn/C electrocatalysts to tune their physiochemical properties and NP size for improving their electrochemical properties.
1.75 for comparison with the XRD patterns of Zn in PdZn/C. In this study, we aimed to observe the effect of the fuel amount on the synthesis of the two PdZn/C electrocatalysts to tune their physiochemical properties and NP size for improving their electrochemical properties.
Fig. 1 shows a schematic of the SCS technique. SCS is a redox based reaction that takes place in a homogeneous aqueous solution of oxidizing agents such as metal nitrates, and reducing agents such as glycine. Step I in Fig. 1 involves obtaining a homogeneous solution of starting materials. Then, the beaker is placed on a hotplate where the temperature is maintained at ∼250 °C in an open-air atmosphere until self-ignition occurs in step II. The solution becomes concentrated overtime. Once self-ignition occurs, energy is produced simultaneously because the reaction takes place exothermically.31,32,34 The energy produced by the system is sufficient to synthesize crystalline materials. This is how NPs are obtained in SCS. In step III, the particle size is uniformly obtained by sieving. For the application of MOR, a physical mixture of NPs and support (carbon black) is proposed at step IV.
We obtained a mixture of 40% of each synthesized sample with 60% carbon support in 7 mL DIW via use of a sonic vibrator and then heated the mixture to 125 °C with the help of a hotplate for complete drying. We carried out elemental analysis of the carbon-supported samples by SEM. The elemental compositions of Pd/C and PdZn/C were averaged from three measurements at different regions of each sample. The compositions analyzed by SEM showed that the reaction yield was almost quantitative (83.32–92.45%) based on the total weight of Pd and Zn (Table S1†), and the atomic ratios of Pd and Zn in the samples were 1![[thin space (1/6-em)]](https://www.rsc.org/images/entities/char_2009.gif) :
:![[thin space (1/6-em)]](https://www.rsc.org/images/entities/char_2009.gif) 1.54 for PdZn/C (1.75) and 1
1.54 for PdZn/C (1.75) and 1![[thin space (1/6-em)]](https://www.rsc.org/images/entities/char_2009.gif) :
:![[thin space (1/6-em)]](https://www.rsc.org/images/entities/char_2009.gif) 1.73 for PdZn/C (0.5), respectively. The SEM analysis for the compositions suggested that the electrocatalysts were Zn-enriched, where the fuel amount in the synthesis played a key role in the distribution of a Zn-high/low content in the samples. One image and its spectrum from each sample are shown in Fig. 2.
1.73 for PdZn/C (0.5), respectively. The SEM analysis for the compositions suggested that the electrocatalysts were Zn-enriched, where the fuel amount in the synthesis played a key role in the distribution of a Zn-high/low content in the samples. One image and its spectrum from each sample are shown in Fig. 2.
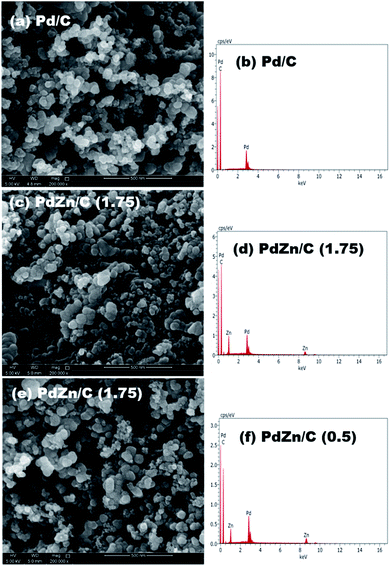 | ||
| Fig. 2 Compositional analysis with SEM, and the images and spectra on (a) and (d) Pd/C, (b) and (e) PdZn/C (1.75), and (c) and (f) PdZn/C (0.5). | ||
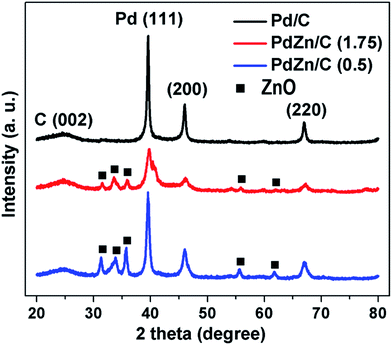
Fig. 3 shows the XRD patterns for Pd/C, PdZn/C (1.75) and PdZn/C (0.5). The peak positions at 2θ of 39.5°, 46.1°, and 67° are attributed to the planes corresponding to (111), (200), and (220) of the face centered cubic structure (fcc) of Pd, respectively. The peak position at 2θ of ∼24.9° was assigned to the carbon support corresponding to the C (002) plane. XRD patterns of the two bimetallic PdZn/C electrocatalysts showed similar characteristic patterns with Pd/C but the peak positions at 2θ for PdZn/C were shifted positively by 0.28 for PdZn/C (1.75) and 0.03 for PdZn/C (0.5) compared to those for Pd/C. The presence of other detectable peaks in the PdZn/C patterns at 2θ values of 31.2°, 33.8°, 35.7°, 55.7° and 61.8° were attributed to the (100), (002), (101), (110) and (103) planes of ZnO NP, respectively. These XRD patterns were confirmed by comparing them with the XRD patterns (Fig. S1†) of the synthesized ZnO obtained in the same manner as shown in literature.45 The shift of XRD patterns towards the positive direction indicates that the Zn element is incorporated into the Pd lattice to form an alloy, in accordance with reports on Pd alloyed with 3d transition metals.23,46–51 The presence of other crystal phases suggests that the alloy elements are not uniformly distributed within the PdZn NPs. Iwasa et al.,46 Tew et al.47 and Chin et al.48 independently reported on PdZn alloy formation with XRD observations at 200 °C, 250 °C and 350 °C, respectively, and the composition of the alloys varied with increasing temperature. In the SCS process, the combustion temperature goes up to ∼600 °C in an open-air atmosphere. Based on the phase-diagram,52 the elements of Pd and Zn could form an alloy in a wide range of compositions (∼32–85% of Zn with Pd) at a broader temperature range. The atomic ratios (61–63% of Zn with Pd (Table S1†)) of our samples and the synthetic temperature are in line with another report.52 Chen et al.53 carried out a study on PtZn and PdZn alloy formation to assess their surface structures and stabilities using density functional model theory (DFMT) and obtained an fcc structure with lattice parameters of a = 3.89 Å and 3.92 Å and an hcp structure with lattice constants, a = 2.6649 Å and c = 4.9468 Å for Pd and Pt, and Zn, respectively. According to the DFMT, Pd and Zn are readily miscible and form alloys in a broad range of compositions, where different compositions produce different structures. Later, their DFMT was experimentally implemented and verified by other groups.54–56 In addition, Penner et al.51 studied the growth and structural stability of PdZn alloy formation on SiO2 using TEM along with selected area electron diffraction patterns at high resolution, and they found that the alloy, PdZn NPs, was well ordered.
Literature studies indicate that Pd and Zn could form alloys under different conditions with different synthesis methods for a broad range of compositions and temperatures. We believe that the macroscopic-phase-segregation observed using XRD for the PdZn/C samples is dependent on the formation of an orderly alloy and the Zn-content in samples. The crystallite sizes of the samples calculated at the (111) plane using Scherrer's equation49 are shown in Table S1.† The trend of crystallite sizes (Table S1†) was Pd/C > PdZn/C (0.5) > PdZn/C (1.75). It is noted that the fuel-amount could affect the particle size.
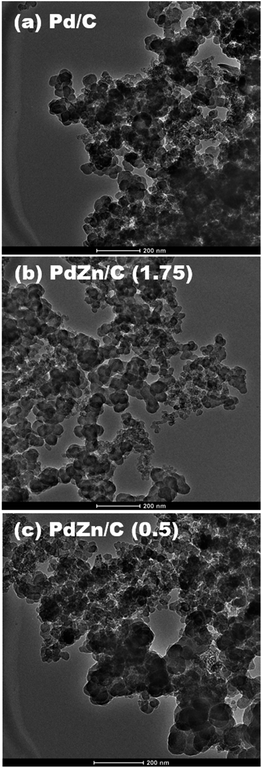
Fig. 4 shows the TEM images of the three samples. It could be observed that NPs of the samples are well distributed on the carbon support, but NPs aggregation was present on all the samples with spherical shapes. Agglomeration is one of the inherent properties of NPs synthesized by SCS. Herein, the NPs of PdZn/C (1.75) show less agglomeration when a higher fuel-amount is used in the synthesis.
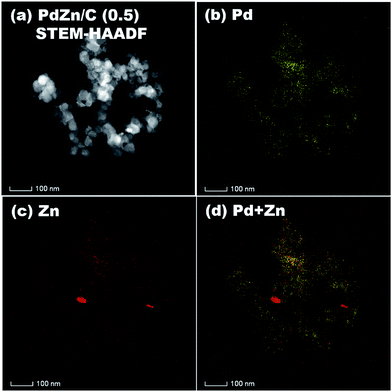
STEM-HAADF coupled to EDS was conducted for analysis of the elemental distribution in the NPs of both bimetallic electrocatalysts, and the results are shown in Fig. 5 for PdZn/C (1.75) and Fig. 6 for PdZn/C (0.5), respectively. The EDS elemental distribution shown in Fig. 5 indicates that the Pd element is fairly alloyed with the Zn element in the aggregated NPs. However, there are additional Zn signals detected outside of the NPs on the carbon support. These signals on the carbon support outside of the aggregated NPs correspond to ZnO and are seen in both bimetallic electrocatalysts in the XRD observations. The elemental distribution map of C in both electrocatalysts is shown in Fig. S2 and S3† as well as in the images shown in Fig. 5 and 6 for a clearer observation. In the case of PdZn/C (0.5), an almost similar observation was seen in the EDS elemental distribution of Pd and Zn throughout the aggregated NPs on the carbon support (Fig. 6). There are highly intensified Zn signals seen in two areas in Fig. 6(c) that are assigned to the aggregation of ZnO NPs. It is noted that one can see that there are some signals in Fig. S2 and S3† for each element map where there is no carbon support. These signals correspond to the background noise detected by the instrument.
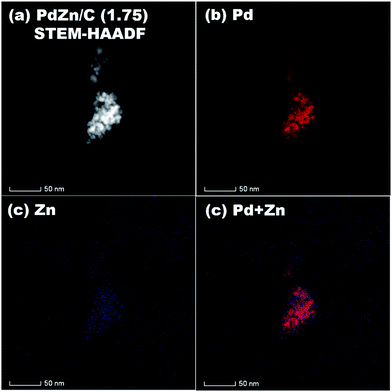 | ||
| Fig. 5 (a) STEM-HAADF image, and EDS elemental maps of (b) Pd, (c) Zn, (d) Pd + Zn on PdZn/C (1.75). | ||
Oxidation state of the elements
The XPS spectra of Pd/C and PdZn/C are depicted in Fig. 7. The peaks of Pd 3d5/2 and Pd 3d3/2 on the Pd/C sample appear at 335.34 and 340.82 eV, respectively, which are in good agreement with those reported in literature.57,58 The numerical values of the XPS spectra peaks are listed in Table S2.† These XPS peaks in the PdZn/C samples (Table S2†) are shifted towards lower BEs by 0.12–0.24 eV, which can be ascribed to the charge-transfer from Zn to Pd because of difference in their electronegativity (Zn (1.6) and Pd (2.2)). Hammer and Norskov59 reported on d-band model theory, in which the charge-transfer to Pd can induce a down-shift of the Pd d-band center, thus influencing the Pd-adsorbate interaction. As a result, the charge transfer process can weaken the interaction between Pd and the intermediate species produced during the MOR. Kibler et al.60 and Zhang et al.61 individually studied that the down-shift of the d-band center enhances the electrocatalysis on small organic molecules. The XPS peaks appearing at 336.91–337.23 eV and 342.43–344.39 eV BEs on Pd/C and PdZn/C correspond to the Pd-species of PdO and Pd(OH)2,62 respectively. The XPS spectra analysis shows the presence of Zn-species at 1021.93 eV and 1045.02 eV for PdZn/C (0.5) and 1022.3 eV and 1045.3 eV for PdZn/C (1.75), which are assigned to ZnO and agree with those reported in literature.63 These BEs on the Pd-species and Zn-species vary with the nature of the samples and the magnitude of the charge transfer from Zn to Pd. The elements of PdZn/C (1.75) show relatively more metallic character than PdZn/C (0.5) based on the SCS method, but the XPS peaks on Zn in PdZn/C (1.75) show higher BEs because of the higher electronic interaction between Pd and Zn.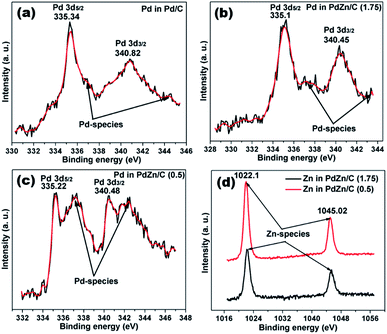 | ||
| Fig. 7 XPS data spectra of (a) Pd/C, (b) PdZn/C (1.75), (c) PdZn/C (0.5) and (d) Zn in PdZn/C (1.75) and PdZn/C (0.5). | ||
Electrocatalysis
Fig. 8(a) compares the CVs among the Pd/C and PdZn/C electrocatalysts. The CVs were measured in an electrolyte of 1 M KOH at 50 mV s−1 under a N2-ambient condition. As shown in Fig. 8(a), the CVs of Pd/C and PdZn/C exhibit the typical characteristics of Pd containing electrocatalysts. The CV peaks of Pd/C at about −0.795 V and −0.628 V match with the hydrogen desorption as reported in the literature64 on the (100) and (111) planes, respectively. The CV peak at about −0.368 V of Pd/C in the forward scan is assigned to oxide formation and that at −0.454 V in the backward scan to decomposition. The CV peaks of PdZn/C at about −0.728 V and −0.515 V are attributed to hydrogen-adsorption in the forward scan. The hydrogen adsorption/desorption and oxide formation/decomposition peaks for Pd/C are not similar to PdZn/C, suggesting that the electrocatalysts are composed of bimetallic NPs. The CV peaks of PdZn/C are shifted positively by about −341 mV for oxide-formation on PdZn/C, −35 mV for that on PdZn/C (1.75), and −15 mV for that on PdZn/C (0.5) as compared to those for the decomposition from Pd/C. The onset potentials of oxide-formation and decomposition for PdZn/C to a higher positive potential are evidence of the bimetallic electrocatalysts preventing the chemisorption of the hydroxyl species on the catalyst surface, which correlates with the down-shift of the Pd d-band center. The adsorbed hydroxyl species on the catalyst surface hinder small molecules (formic acid/methanol/ethanol) oxidation reactions.65 The suppression of hydroxyl formation on the PdZn/C surface is observed in the CVs, and it is found to enhance the electrocatalytic activity of MOR. The electrochemical surface areas (ECSAs) calculated from the hydrogen-desorption regions (2nd cycle of 3 in Fig. S4†) are shown in Table S1.† The trend for the ECSAs (Table S1†) is Pd/C > PdZn/C (0.5) > PdZn/C (1.75), and this trend does not follow the crystallite size obtained using XRD data. Upon the formation of an alloy with Pd and Zn in PdZn, the NPs can affect the ECSAs and the down-shift of the Pd d-band center may weaken the binding energy of the Pd atoms.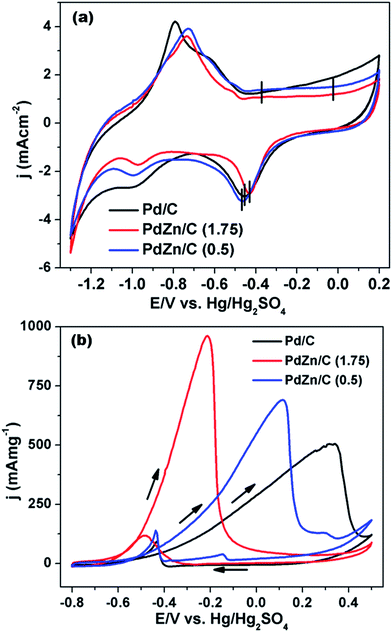 | ||
| Fig. 8 CVs of (a) Pd/C, PdZn/C (1.75) and PdZn/C (0.5) in 1 M KOH at 50 mV s−1 and (b) MOR on Pd/C, PdZn/C (1.75) and PdZn/C (0.5) in 1 M KOH containing 2 M CH3OH at 50 mV s−1 under a N2 environment. | ||
In order to study the electrochemical activity on Pd/C and PdZn/C electrocatalysts, the MOR was conducted using CV in an electrolyte of 1 M KOH containing 2 M CH3OH at a 50 mV s−1 in an N2-ambient condition. As seen in Fig. 8(b), the onset of potential for PdZn/C (1.75) is negatively shifted by about −125 mV and −92 mV compared to that of Pd/C and PdZn/C (0.5), respectively. The poison tolerance ratio (PTR) of the forward and backward currents is 8.2 on PdZn/C (1.75) and 5 on PdZn/C (0.5) ≡ Pd/C, whereas many reports on PTR provide a value of about 1.0 (ref. 22, 62 and 66) in alkaline media. In general, the backward current is assigned to carbonaceous species formed during the MOR. The PTR ratio and the intensity of the backward current for all the electrocatalysts show that the MOR is nearly complete in the forward scan. The reaction kinetics of CH3OH is greatly enhanced on PdZn/C compared to Pd/C. According to the kinetics studies reported in the literature,67,68 the dissociation of oxygenated species, such as O and OH, are the rate limiting steps for small molecules oxidation/reduction reactions. As observed in Fig. 8(a), the CV peaks for the oxide formation/decomposition on PdZn/C are at higher potentials than those of Pd/C. This indicates that PdZn NPs are less oxophilic than Pd/C. One can expect that a less oxophilic NPs surface can get rid of oxygenated species more easily and thus refresh the catalyst surface faster than that of Pd/C. This would result in more active sites being free on a bimetallic electrode surface for further quicker adsorption of CH3OH. Since the down-shift of the Pd d-band in the PdZn/C samples is seen in the XPS analysis, it can be inferred that the intermediate species generated in the MOR are less adsorbed on the catalyst surface. This study agrees with reports in the literature.59–61 Zn itself is an oxophilic element and can produce a synergistic effect with an electrolyte of alkaline media to release the intermediate species generated by the MOR. This is how the electrode surface can get more active sites for the adsorption of CH3OH, thereby, leading to an enhancement in electrocatalysis as well as in the MOR kinetics on the PdZn/C samples. The current densities at the forward scan of each electrocatalyst were normalized by the amount of Pd used in the measurement of the MOR activity (Table S1†). The electrocatalytic activity for MOR is ∼1.9 times for PdZn/C (1.75) and ∼1.4 times for PdZn/C (0.5) higher than that of Pd/C. This is a significant step ahead for application in DMFCs and meets one of the key criteria for fuel cells application that the catalyst should produce the highest current density at the lowest potential. The current densities were also normalized by ECSAs (Fig. S5(a)†). The normalization factor used for the ECSAs affects the trend of the current density normalized by the Pd amount in the samples.
The stability test is one of the key factors for assessing suitability for FCs application. Stability tests were performed on all the electrocatalysts using the chronoamperometry technique in an electrolyte of 1 M KOH containing 2 M CH3OH for a period of 2 h (Fig. 9) in a N2-ambient condition. The chronoamperometric curves in Fig. 9 demonstrate that the MOR on the PdZn/C electrocatalysts commences at high potentiostatic currents compared to Pd/C. The potentiostatic currents sharply decrease at ∼62 s for Pd/C and ∼85 s for PdZn/C, respectively. This phenomenon, observed on all the electrocatalysts, was due to adsorption of the reaction intermediates formed during CH3OH oxidation, hydrogen and oxygen species from the electrolyte, the dissolution/leaching of some Zn and bilayer discharge. These reasons are found in many reports17,21,23,26,66,69,70 for explaining the significant decay of the electrochemical performance at the very beginning of the oxidation of small molecules in acidic and alkaline media. After the sharp decrease at 62–85 s, the performance of the as-synthesized electrocatalysts remained firmly stable over a period of 2 h in an electrochemical environment. PdZn/C (1.75) showed the highest stability over both Pd/C and PdZn/C (0.5) based on the current densities normalized by both the Pd amount in the samples and the ECSAs from the CVs (Fig. 5(b)).
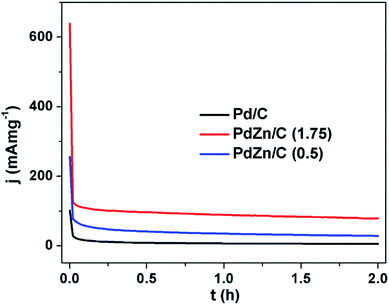 | ||
| Fig. 9 Chronoamperometric curves of Pd/C, PdZn/C (1.75) and PdZn/C (0.5) in 1 M KOH containing 2 M CH3OH at 0.325 V under a N2 environment for 2 h at 350 rpm. | ||
Conclusions
We successfully synthesized PdZn/C and Pd/C electrocatalysts by the SCS method and used them for the MOR in an alkaline medium. The NP electrocatalysts were characterized by XRD, TEM and SEM for the crystallite size, morphology and composition of the elements in the samples. The EDS elemental distribution throughout the NPs showed that the NPs were composed of Pd and Zn elements in the alloyed state. The electronic structure of Pd modified by the incorporation of Zn was proved by XPS analysis, which confirmed the down-shift of the d-band center on Pd. Agglomerated NPs observed by TEM were employed for the electrocatalysis of CH3OH. We found that PdZn/C showed better electrocatalytic performance by a factor of ∼1.4–1.9 in comparison with Pd/C. Among the electrocatalysts, PdZn/C (1.75) showed the highest current density on the MOR at the earliest onset potential, thus meeting one of the key criteria for DMFCs application. The stability tests conducted using chronoamperometry showed that PdZn/C (1.75) was more stable in an electrochemical environment compared to Pd/C and PdZn/C (0.5). We found that the variation of the fuel amount affected the NP sizes, electronic structure and electrochemical properties in the two samples.Conflicts of interest
There are no conflicts of interest to declare.Acknowledgements
This publication was made possible by NPRP grant (NPRP8-509-2-209) from the Qatar National Research Fund (a member of Qatar Foundation). The statements made herein are solely the responsibility of the author(s). The authors also gratefully acknowledge the Gas Processing Centre (GPC), the Central Laboratory Unit (CLU) at Qatar University and Qatar Environment and Energy Research Institute (QEERI) at Qatar Foundation for services related to XPS analysis, electron microscopy and STEM-HAADF-EDS, respectively.Notes and references
- W. Winter and R. J. Brodd, Chem. Rev., 2004, 104, 4245 CrossRef PubMed.
- X. Li, M. Wen, D. Wu, Q. Wu and J. Li, J. Alloys Compd., 2016, 685, 42 CrossRef CAS.
- H. Zhao, C. Yu, H. You, S. Yang, Y. Guo, B. Ding and X. Song, J. Mater. Chem., 2012, 22, 4780 RSC.
- K. Maharaju and L. Cindrella, RSC Adv., 2014, 4, 11939 RSC.
- J. H. Lin, T. H. Tse and M. Y. Yen, Energy Fuels, 2009, 23, 4042 CrossRef CAS.
- J. Speder, L. Altmann, M. Baumer, J. J. K. Kirkensgaard and K. Mortasen, RSC Adv., 2014, 4, 14971 RSC.
- S. Y. Huang, S. M. Chan, C. L. Lin, C. H. Chen and C. T. Yeh, J. Phys. Chem. B, 2006, 110, 23300 CrossRef CAS PubMed.
- A. D. Moore, S. M. Holmes and E. P. L. Roberts, RSC Adv., 2012, 2, 1669 RSC.
- L. Gao, W. Yue, S. Tao and L. Fan, Langmuir, 2013, 188, 957 CrossRef PubMed.
- Z. L. Liu, X. Y. Ling, B. Guo, L. Hong and J. Y. Lee, J. Power Sources, 2007, 167, 272 CrossRef CAS.
- K. Eid, Y. H. Ahmad, S. Y. Alqaradawi and N. K. Allam, Catal. Sci. Technol., 2017, 7, 2819 CAS.
- X. R. Jiang, T. M. Guer, F. B. Prinz and S. B. Bent, J. Electrochem. Soc., 2010, 147, B314 CrossRef.
- W. Wang, Q. Huang, J. Liu, Z. Zou, Z. Li and H. Yang, Electrochem. Commun., 2008, 10, 1396 CrossRef CAS.
- Y. C. Wei, C. W. Liu, Y. W. Chang, C. M. Lai, P. Y. Lim and L. D. Tsai, Int. J. Hydrogen Energy, 2010, 35, 1864 CrossRef CAS.
- S. K. Meher and G. R. Rao, ACS Catal., 2012, 2, 2795 CrossRef CAS.
- A. B. A. A. Nassr and M. Bron, ChemCatChem, 2013, 5, 1472 CrossRef CAS.
- M. A. Matin, E. Lee, H. Kim, W.-S. Yoon and Y.-U. Kwon, J. Mater. Chem. A, 2015, 3, 17154 CAS.
- Z. J. Mellinger, T. G. Kelly and J. G. Chen, ACS Catal., 2012, 2, 751 CrossRef CAS.
- F. Kadirgan, S. Beyhan and T. Atilan, Int. J. Hydrogen Energy, 2009, 34, 4312 CrossRef CAS.
- C. T. Hsieh, Y. Y. Liu and A. K. Roy, Electrochim. Acta, 2012, 64, 205 CrossRef CAS.
- C. T. Hsieh, P. O. Yu, D. Y. Tzou, J. P. Hsu and Y. R. Chiu, J. Electroanal. Chem., 2016, 761, 28 CrossRef CAS.
- Y. Ren, S. Zhang and H. Li, Int. J. Hydrogen Energy, 2014, 39, 288 CrossRef CAS.
- Y. Song, X. Zhang, S. Yang, Z. Wei and Z. Sun, Fuel, 2016, 181, 269 CrossRef CAS.
- A. I. C. Hidalgo, M. R. Aguirre, E. Valenzuela, J. Y. V. Gomez, A. C. Davila, R. S. Varma and V. H. R. Sanchez, Int. J. Hydrogen Energy, 2016, 41, 23329 CrossRef.
- M. A. Alvi and M. S. Akhtar, J. Alloys Compd., 2016, 684, 524 CrossRef CAS.
- L. Dai and S. Zou, J. Power Sources, 2011, 196, 9369 CrossRef CAS.
- C. Du, M. Chen, W. Wang and G. Yin, ACS Appl. Mater. Interfaces, 2011, 3, 105 CAS.
- H. Wang, Z. Sun, Y. Yang and D. Su, Nanoscale, 2013, 5, 139 RSC.
- A. G. Merzhanov, Ceram. Int., 1995, 21, 371 CrossRef CAS.
- J. Kingsley and K. C. Patil, Mater. Lett., 1988, 6, 427 CrossRef CAS.
- A. Kumar, A. S. Mukasyan and E. E. Wolf, Appl. Catal., A, 2011, 401, 20 CrossRef CAS.
- A. Cross, A. Kumar, E. E. Wolf and A. S. Mukasyan, Ind. Eng. Chem. Res., 2012, 51, 12004 CrossRef CAS.
- S. L. Gonzalez-Cortes and F. E. Imbert, Appl. Catal., A, 2013, 452, 117 CrossRef CAS.
- F. T. Li, J. Ran, M. Jaroniec and S. Z. Qiao, Nanoscale, 2015, 7, 17590 RSC.
- A. Kumar, E. Wolf and A. Mukasyan, AIChE J., 2011, 57, 3473 CrossRef CAS.
- A. Kumar, E. Wolf and A. Mukasyan, AIChE J., 2011, 57, 2207 CrossRef CAS.
- A. Kumar, A. S. Mukasyan and E. E. Wolf, Ind. Eng. Chem. Res., 2010, 49, 11001 CrossRef CAS.
- A. Ashok, A. Kumar, R. R. Bhosale, M. A. H. Saleh, V. D. Broeke and J. P. Leo, RSC Adv., 2015, 5, 28703 RSC.
- A. Ashok, A. Kumar, R. R. Bhosale, M. A. H. Saleh, U. K. Ghosh, M. Al-Marri, F. A. Almomani, M. M. Khader and F. Tarlochan, Ceram. Int., 2016, 42, 12771 CrossRef CAS.
- A. Kumar, A. Ashok, R. R. Bhosale, M. A. H. Saleh, F. A. Almomani, M. Al-Marri, M. M. Khader and F. Tarlochan, Catal. Lett., 2016, 146, 778 CrossRef CAS.
- A. Kumar, A. Mukasyan and E. Wolf, Appl. Catal., A, 2010, 372, 175 CrossRef CAS.
- G. Carotenuto, A. Kumar, J. Miller, A. S. Mukasyan, E. Santacesaria and E. E. Wolf, Catal. Today, 2013, 203, 163 CrossRef CAS.
- A. Kumar, J. T. Miller, A. S. Mukasyan and E. E. Wolf, Appl. Catal., A, 2013, 467, 593 CrossRef CAS.
- A. Kumar, A. Cross, K. Manukyan, R. R. Bhosale, J. P. Leo, V. D. Broeke, J. T. Miller, A. S. Mukasyan and E. E. Wolf, Chem. Eng. J., 2015, 278, 46 CrossRef CAS.
- A. K. Zak, W. H. A. Majid, M. E. Abrishami and R. Yousefi, Solid State Sci., 2011, 13, 251 CrossRef.
- N. Iwasa, T. Mayanagi, S. Masuda and N. Takezawa, React. Kinet. Catal. Lett., 2000, 2, 355 CrossRef.
- M. W. Tew, H. Emerich and J. A. Bokhoven, J. Phys. Chem. C, 2011, 115, 8457 CAS.
- Y.-H. Chin, R. Dagle, J. Hu, A. C. Dohnalkova and Y. Wang, Catal. Today, 2002, 77, 79 CrossRef CAS.
- M. A. Matin, J.-H. Jang and Y.-U. Kwon, J. Power Sources, 2014, 262, 356 CrossRef CAS.
- N. Tekezawa and N. Iwasa, Catal. Today, 1997, 36, 45 CrossRef.
- S. Penner, B. Jenewein, H. Gabasch, B. Klotzer, D. Wang, A. Knop-Gericke, R. Schlogl and K. Hayek, J. Catal., 2006, 241, 14 CrossRef CAS.
- H. Okamoto, in Binary Alloy Phase Diagrams, ed. T. B. Massalski, 1990, p. 3068 Search PubMed.
- Z. X. Chen, K. M. Neyman, A. B. Gordienko and N. Rosch, Phys. Rev. B: Condens. Matter Mater. Phys., 2003, 68, 075417 CrossRef.
- H. Gabasch, A. Knop-Gericke, R. Schlogl, S. Penner, B. Jenewein, K. Hayek and B. Klotzer, J. Phys. Chem. B, 2006, 110, 11391 CrossRef CAS PubMed.
- E. Jeroro, L. Lebarbier, A. Datye, Y. Wang and J. M. Vohs, Surf. Sci., 2007, 601, 5546 CrossRef CAS.
- G. Weirum, M. Kratzer, H. P. Koch, A. Tamtogl, J. Killmann, I. Bako, A. Winkle, S. Surnev, F. P. Netzer and R. Schennach, J. Phys. Chem. C, 2009, 113, 9788 CAS.
- L. Chen, H. Guo, T. Fjujita, A. Hirata, W. Zhang, A. Inoue and M. Chen, Adv. Funct. Mater., 2011, 21, 4364 CrossRef CAS.
- W. Wang, S. Ji and H. Wang, Fuel Cells, 2012, 12, 1129 CrossRef CAS.
- B. Hammer and J. K. Norskov, Adv. Catal., 2000, 45, 71 CAS.
- L. A. Kibler, A. M. El-Aziz, R. Hoyer and D. M. Kolb, Angew. Chem., Int. Ed., 2005, 44, 2080 CrossRef CAS PubMed.
- Z. Zhang, J. Ge, L. Ma, J. Liao, T. Lu and W. Xing, Fuel Cells, 2009, 9, 114 CrossRef CAS.
- Y. Feng, D. Bin, b. Yan, Y. Du, T. Majima and W. Zhou, J. Colloid Interface Sci., 2017, 493, 190 CrossRef CAS PubMed.
- M. C. Biesinger, L. W. M. Lau, A. R. Gerson and R. St. C. Smart, Appl. Surf. Sci., 2010, 257, 887 CrossRef CAS.
- M. Jin, H. Zhang, Z. Xie and Y. Xia, Energy Environ. Sci., 2012, 5, 6352 CAS.
- L. Zhang, L. Wan, Y. Ma, Y. Chen, Y. Zhou, Y. Tang and T. Lu, Appl. Catal., B, 2013, 138–139, 229 CrossRef CAS.
- S. R. Chowdhury, S. Ghosh, S. Kumar and S. K. Bhattachrya, Electrochim. Acta, 2017, 225, 310 CrossRef.
- J. X. Wang, N. M. Markovic and R. R. Adzic, J. Phys. Chem. B, 2004, 108, 4127 CrossRef CAS.
- J. X. Wang, J. L. Zhang and R. R. Adzic, J. Phys. Chem. A, 2007, 111, 12702 CrossRef CAS PubMed.
- R. Shi, J. Wang, N. Cheng, X. Sun, L. Zhang, J. Zhang and L. Wang, Electrochim. Acta, 2014, 148, 1 CrossRef CAS.
- H. A. Gasteiger, S. S. Kocha, B. Somalli and F. T. Wagner, Appl. Catal., B, 2005, 56, 9 CrossRef CAS.
Footnote |
| † Electronic supplementary information (ESI) available. See DOI: 10.1039/c7ra07013f |
| This journal is © The Royal Society of Chemistry 2017 |

