
 Open Access Article
 This Open Access Article is licensed under a
 Creative Commons Attribution 3.0 Unported Licence
Simultaneous enhancement of natural sunlight- and artificial UV-driven photocatalytic activity of a mechanically activated ZnO/SnO2 composite
Smilja Marković *a,
Ana Stankovića,
Jasmina Dostanićb,
Ljiljana Veselinovića,
Lidija Mančića,
Srečo Davor Škapinc,
Goran Dražičd,
Ivona Janković-Častvane and
Dragan Uskokovića
*a,
Ana Stankovića,
Jasmina Dostanićb,
Ljiljana Veselinovića,
Lidija Mančića,
Srečo Davor Škapinc,
Goran Dražičd,
Ivona Janković-Častvane and
Dragan Uskokovića
aInstitute of Technical Sciences of SASA, Knez Mihailova 35/IV, 11000 Belgrade, Serbia. E-mail: smilja.markovic@itn.sanu.ac.rs; Fax: +381 11 2185263
bUniversity of Belgrade, IChTM Center for Catalysis, Belgrade, Serbia
cJožef Stefan Institute, Jamova 39, 1000 Ljubljana, Slovenia
dLaboratory for Materials Chemistry, National Institute of Chemistry, Ljubljana, Slovenia
eFaculty of Technology and Metallurgy, University of Belgrade, Belgrade, Serbia
First published on 4th September 2017
Abstract
Mechanical milling of commercial ZnO and SnO2 was used to produce a ZnO/SnO2 composite with a high density of surface defects; in particular, zinc interstitials (Zni) and oxygen vacancies (VO). To determine the impact of surface defects on photocatalytic activity, the relative concentration ratio of bulk defects to surface defects was modified by annealing at 400 and 700 °C. The possible application of the ZnO/SnO2 composite as a natural sunlight and UV-light driven photocatalyst was revealed via de-colorization of methylene blue. In both cases the ZnO/SnO2 composite exhibited enhanced photocatalytic activity as compared to the pristine ZnO. In order to investigate the origin of the enhancement, the pristine metal oxides and composites were characterized using a variety of techniques, including X-ray diffraction (XRD), Raman and Fourier transform infrared (FTIR) spectroscopy, field emission scanning electron microscopy (FESEM), laser diffraction particle size analysis, Brunauer–Emmett–Teller, UV-Vis diffuse reflectance and photoluminescence spectroscopy. High-resolution transmission electron microscopy (HRTEM) and elemental mapping analyses were used to reveal the presence of SnO2 nanocrystallites on the surface of larger ZnO particles. The enhanced photocatalytic activity of the composite can be attributed to the synergetic effect of the surface defects and the ZnO/SnO2 heterojunction particles, which facilitated charge separation, thereby hindering the recombination of photogenerated carriers. This study draws attention to mechanical activation as an inexpensive and environmentally friendly technique for the large-scale production of the composite with an enhanced photocatalytic activity under illumination of either UV or sunlight.
1. Introduction
Over the past four decades, since Fujishima and Honda reported the photoelectrolysis of water using a TiO2 as photoanode,1 numerous efforts have been made by environmental and materials scientists to develop highly efficient semiconductor photocatalysts for degradation of organic and biological pollutants in water under light irradiation.2,3 The main advantage of photocatalytical disinfection, purification or remediation of drinking and wastewater is a complete mineralization of pollutants to inorganic salts, water and carbon dioxide, without any trace of secondary pollution.4 Metal oxides such as ZnO, TiO2, SnO2, Fe2O3, V2O5, and so on, are recognized as useful materials to initiate photoreaction due to their high photoactivity and photostability, good chemical and biological inertness, inexpensiveness and easy production.3,5 Due to the wide band gap energy, in the range of 3.3–3.6 eV, these metal oxides can be activated by UV light only, while they are non-efficient under visible range of sunlight or indoor light irradiation.6,7 According to the World Meteorological Organization, the outer atmosphere of the Earth receives approximately 1367 W m−2 of insolation,8 promoting sunlight as a renewable, free and clean energy source. Solar irradiation which comes to the Earth is spread over ultraviolet, visible and infrared frequency range, where UV-light makes no more than 3–5%, while visible light makes about 45% of the total amount. Thus, to use solar energy for initiating of photocatalytic or photoelectrolytic reaction it is necessary to modify the metal oxides to be photo-active under visible light irradiation or to increase activity under UV light.9 To modify the optical absorption and to improve the sunlight photonic activity of the metal oxides different approaches have been developed, such as: the incorporation of transition metal ions into the crystal structure, sensitization of the particles' surface, hydrogenation, the incorporation of crystalline defects in metal oxide semiconductors in the form of vacancies and interstitials, etc.10–14 Mechanical activation is recognized as an attractive approach to introduce point defects on a surface or into the crystal structure of metal oxides,15 consequently improving the visible light absorption. However, a wide practical application of photocatalysts, even with enhanced visible light absorption, is hindered by the fast recombination of the photogenerated electron–hole pairs.16,17 It has been revealed that the recombination of photogenerated electron–hole can be efficiently reduced by application of a heterojunction structure;18 where the heterojunction structure represents combination of at least two semiconductors with different band gap energies, enabling a better charge separation. Heterojunction composites such as ZnO/SnO2, TiO2/SnO2, ZnO/TiO2/SnO2, SnO2/Fe2O3, etc., have been developed, showing improved photocatalytic efficiency.17A number of studies have confirmed that ZnO/SnO2 nanostructured composites exhibit improved photocatalytic activity, high conversion efficiency of solar cell, gas sensing and electric properties, due to the formation of nano-heterojunctions.19–21 Many ZnO/SnO2 heterojunctions can be easily formed in composites during a synthesis procedure due to similar crystal growth habit of ZnO and SnO2.19 Besides better charge separation and reduced number of exciton recombination, the substitution of Zn2+ ions for Sn4+ would results in surface modification and formation of more oxygen vacancies in order to compensate the positive charge.
ZnO/SnO2 photocatalysts have been synthesized by various techniques: hydrothermally,17,19,22 solvothermally,23 by co-precipitation,20 by sol–gel procedure,2 mechanochemically,24 etc. Moreover, core–shell ZnO/SnO2 nanoneedle particles were prepared by two-step procedure, including hydrothermal processing and a coating.21 It have been shown that the photocatalytic properties of ZnO/SnO2 composites are highly related to the particle size and shape, crystal structure, proportions between the metal oxides and so on.
Most of methods for synthesis of ZnO/SnO2 composites include chemical reactions, often requiring very stringent control in various processing parameters, followed by annealing at elevated temperatures, together with a low production yield. The goal of our research was large-scale preparation of photocatalysts highly reactive under illumination of both UV and sunlight. We choose to modify commercial zinc oxide powder due to its band gap at the edge of ultraviolet part of the spectrum and high potential to be red-shifted, enabling use of a broader spectrum of sunlight. A mechanical milling was employed for processing of the photocatalyst particles since it enables introduction of surface defects which could promote red-shift of the band gap, what's more, surface defects could reduce the recombination of photogenerated electrons and holes. Small amount of commercial SnO2 powder (17 wt%) was added to the ZnO powder to form ZnO/SnO2 composite with heterojunction particles, thereby to more delay the recombination of photogenerated carriers through efficient charge separation based on different band gap energies. Here we report results of a systematical study of structural, morphological, textural and optical properties of the commercial ZnO and SnO2 powders as the ingredients, and composite made of them via simple mechanical milling. The photocatalytic activity of the samples was revealed through de-colorization of methylene blue under illumination of: (1) natural sunlight, and (2) UV lamp. The origin of the photocatalytic activity was discussed.
2. Experimental
2.1. Synthesis of ZnO/SnO2 photocatalysts
ZnO/SnO2 composite was prepared by high-energy ball milling of commercial metal oxide powders. Analytically grade ZnO (99%, Sigma-Aldrich) and SnO2 (>99%, Kemika, Zagreb) powders in a 0.9![[thin space (1/6-em)]](https://www.rsc.org/images/entities/char_2009.gif) :0.1 molar ratio (83 wt%:17 wt%) were mechanically treated during 2 h in planetary ball mill (Across International PQ-NO4) with stainless steel vessels (100 ml) and balls (∅ 5 mm). The balls to powder weight ratio was 10:1. The angular velocity of the vessels was 400 rpm. To prevent reagglomeration of broken oxide particles during processing, high-energy milling was done in an inert NaCl matrix resulting in the formation of a composite powder consisting of oxide grains embedded within a salt matrix. To remove the NaCl matrix, the obtained powder was rinsed five times with distilled water and subsequently two times with absolute ethanol; each time suspension was centrifuged at 5000 rpm for 5 min. The rinsed powder was air dried in an oven at 60 °C for 24 h.
:0.1 molar ratio (83 wt%:17 wt%) were mechanically treated during 2 h in planetary ball mill (Across International PQ-NO4) with stainless steel vessels (100 ml) and balls (∅ 5 mm). The balls to powder weight ratio was 10:1. The angular velocity of the vessels was 400 rpm. To prevent reagglomeration of broken oxide particles during processing, high-energy milling was done in an inert NaCl matrix resulting in the formation of a composite powder consisting of oxide grains embedded within a salt matrix. To remove the NaCl matrix, the obtained powder was rinsed five times with distilled water and subsequently two times with absolute ethanol; each time suspension was centrifuged at 5000 rpm for 5 min. The rinsed powder was air dried in an oven at 60 °C for 24 h.
In order to vary the relative concentration ratio of bulk defects to surface defects, ZnO/SnO2 composite was annealed at 400 and 700 °C. Annealing was done in a tube furnace in an air atmosphere, with a heating rate of 10° min−1 and a dwell time of 2 h. The annealing temperatures were chosen from a thermogravimetric and differential thermal analysis (TG-DTA) of ZnO/SnO2 composite. The analysis was determined by simultaneous TG-DTA (Setsys, SETARAM Instrumentation, Caluire, France) in the temperature range between 25 and 1000 °C under the air flow of 20 ml min−1, in an Al2O3 pan. The heating profile was set as follows: the material was stabilized at 25 °C for 5 min then heated to 1000 °C with the heating rate of 10° min−1.
Throughout this paper, the synthesized photocatalysts are designated as ma-ZnO/SnO2, ZnO/SnO2-400 and ZnO/SnO2-700, where “ma” denotes a process of the mechanical activation, while the numbers denote the annealing temperatures, 400 and 700 °C, respectively.
2.2. Characterization
X-ray diffraction (XRD) data were recorded on a Philips PW-1050 operated at 40 kV and 20 mA with Cu Kα1,2 radiation. The data were collected over a 2θ range 10–70° with a step of 0.05° and a counting time of 5 s per step. The crystal phases were identified by comparing the recorded data with those reported in the Joint Committee of Powder Diffraction Standards (JCPDS) database. The unit cell parameters were calculated through La Bail refinement using Topas academic software.25 The crystallite sizes (D) were calculated from the XRD line-broadening using the Scherrer equation D = Kλ/βmcosθ, where K is the shape coefficient and is equal to 0.89; λ is the wavelength of X-ray radiation (1.54178 Å); βm is the full width at half maximum (FWHM) for the XRD reflection, while θ is the diffraction angle (°).26,27 Fourier transform infrared (FT-IR) spectra were recorded on a Thermo Scientific™ Nicolet™ iS™10 FT-IR Spectrometer equipped with attenuated total reflectance (ATR) accessory. The ATR/FT-IR measurements were done in the wavenumber region of 400–2000 cm−1, with a resolution of 4 cm−1. The room-temperature Raman spectra were taken in the backscattering geometry using a μ-Raman system with a Jobin Yvon T64000 triple monochromator, equipped with a liquid nitrogen-cooled CCD detector. The excitation was done by the 514.5 nm line of an Ar-ion laser. The spectra were recorded in the wavenumber interval of 80–1200 cm−1 with a resolution of 4 cm−1. The morphology of composite particles was observed by field emission scanning electron microscopy (FESEM, Ultra plus, Carl Zeiss, Germany). The samples for the FESEM analysis were dispersed in ethanol, in ultrasonic bath, for 5 min; after dispersion a few drops were filtered through a polycarbonate membrane. The membrane was put on the carbon tape on the aluminum stub and carbon-coated in order to prevent electron charging. Before analysis the sample was vacuumed for 15 min. Particle size and morphology were investigated using transmission electron microscopy (TEM, JEOL 2100); elemental mapping was performed by EDXS analysis (JEOL ARM 200CF equipped with JEOL centurion 100). The specific surface area (SSA) and the porous properties of the photocatalysts were determined based on N2 adsorption–desorption isotherm at −195.8 °C using ASAP 2020 (Micromeritics Instrument Corporation, Norcross, GA, USA). Samples were degassed under reduced pressure for 10 h at 120 °C prior to analysis. The SSA was calculated according to the Brunauer–Emmett–Teller (BET) method from the linear part of the N2 adsorption isotherm.28 The total volume of pores (Vtotal) was given at p/p0 = 0.998. The volume of mesopores (Vmeso) and pore size distribution were analyzed according to the Barrett–Joyner–Halenda (BJH) method from the desorption branch of isotherm.29 The volume of micropores (Vmicro) was calculated from alpha-S plot. Particles size distribution in water suspensions was determined by laser light-scattering particle size analyzer (PSA) (Mastersizer 2000; Malvern Instruments Ltd., Malvern, Worchestershire, U.K.). Prior to measurements the powders were dispersed in distilled water, using a low-intensity ultrasonic bath, for 5 min. The UV-Vis diffuse reflectance spectra (DRS) were recorded in the wavelength range 300–800 nm on an Evolution 600 UV-Vis spectrophotometer (Thermo Scientific), equipped with DRA-EV-600 Diffuse Reflectance Accessory. Measurements were done on pellets (∅ 6 mm, h ∼ 1 mm) prepared by pressing the powders (without any additives) by P = 300 MPa. The reflectance spectra were measured relative to BaSO4 as a reference sample. Photoluminescence (PL) spectra were recorded on Horiba Jobin Yvon Fluorolog FL3-22 spectrofluorometer using Xe lamp excitation (wavelength 325 nm).
2.3. Photocatalytic activity tests
The photocatalytic activity of the samples was studied by the de-colorization of methylene blue dye (MB, a cationic dye with chemical formula C16H18ClN3S·3H2O; MB shows an intense absorption peak at 665 nm). Stock solution of 1000 ppm was prepared by dissolving 1.0 g of methylene blue (Methylen blay B extra, E. Merck, Darmstadt, Germany) in 1 l of distilled water. The MB solutions for photocatalytic activity experiments were prepared by diluting the stock solutions to the appropriate concentration.In each of the experiments 100 mg of a powder was mixed with 100 ml of MB (10 ppm). Prior to illumination, the suspension was magnetically stirred for 1 h in a dark to establish an adsorption–desorption equilibrium. After the equilibrium had been established the concentration of MB was measured and taken as the initial concentration Co. During the illumination stirring was maintained to keep the mixture in suspension. At specific time intervals 3 ml of aliquots was withdrawn and centrifuged (8000 rpm, 10 min) to remove particles from solution before the absorbance measurement. The concentrations of the solutions were monitored by using a GBC Cintra UV-Vis spectrophotometer in the wavelength range of 300–800 nm; concentration of the MB was calculated according to the absorbance value at 665 nm.
The photocatalytic activity of the ingredients and ZnO/SnO2 composites were tested under illumination of: (a) UV lamp (medium-pressure mercury vapor UV lamp, UVA region, Philips, 4 × 15 W), and (b) direct sunlight. The intensity of used UV light was 7 mW cm−2, as measured by YK-35UV light meter. All the experiments under direct sunlight illumination were done in time between 11:00 a.m. and 2:00 p.m. during the month of July 2015 and at ambient temperature (25 to 30 °C).
Photocatalytic activity was also examined for the degradation of the pollutant that has no absorption in the visible range. The photocatalytic test was done on ma-ZnO/SnO2 for the degradation of phenol (C6H6O, Alpha Aesar, Karlsruhe, Germany) under direct sunlight illumination. The experimental conditions were the same as for the de-colorization of MB; 100 mg of the powder was mixed with 100 ml of phenol (10 ppm). The phenol concentration during degradation was monitored by the UV-Vis spectrophotometer in the wavelength range of 200–400 nm, and afterwards, calculated according to the maximum absorbance value at 210.5 nm. The total organic carbon (TOC) was determined by the TOC Analyser Multi N/C (Analytik Jena, Austria).
3. Results and discussion
A thermal stability of ma-ZnO/SnO2 composite was investigated by the TG-DTA analysis. The TG curve presented in Fig. 1 shows neglected weight loss of about 0.5% in the temperature range from 25 to 260 °C, probably due to a small amount of surface water, ethanol and adsorbed gasses remained after the synthesis procedure. In the temperature range from 260 to about 900 °C a continuous weight gain exists accompanied with a wide exothermic peak in DTA curve. The total weight increase of about 5% is probably due to the solid state reaction between ZnO and SnO2 and formation of a new phase.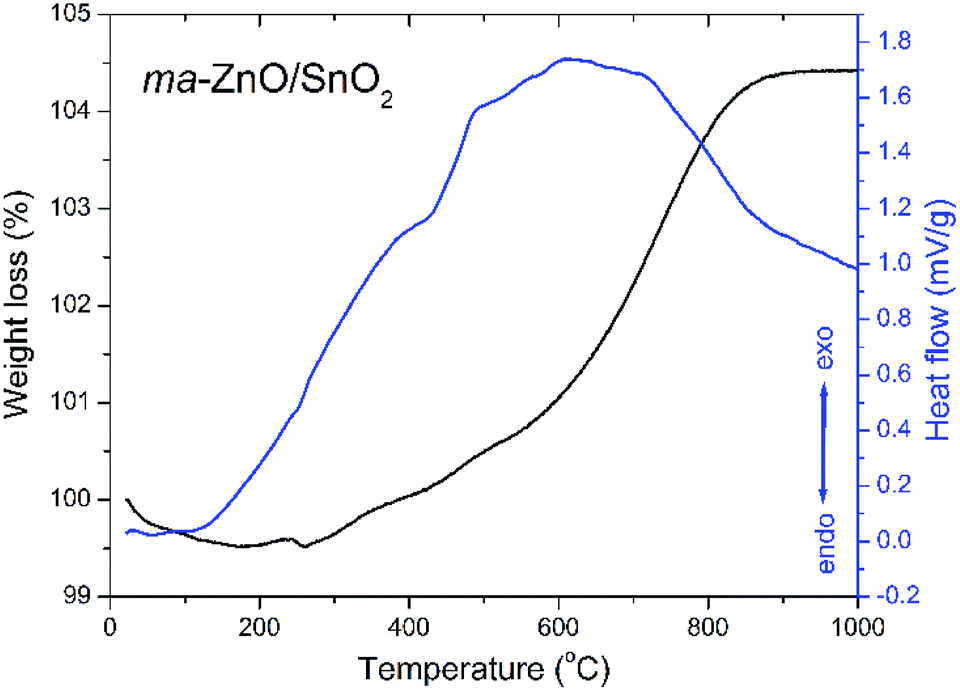 | ||
| Fig. 1 TG-DTA plots of ma-ZnO/SnO2 composite photocatalysts. | ||
The TG-DTA results point to a high thermal stability of ma-ZnO/SnO2 composite up to 400 °C. A considerable thermal stability of photocatalysts, without decomposition or phase transition, is highly desirable since allows their extensive application. Besides, thermal stability is significant for photocatalysts recovery procedure, usually done by drying in an oven at 110 °C.5,27
It is known that an annealing of ZnO/SnO2 composites can considerably affect photocatalytic activity, mostly through point defect reparation and/or creation,4,20,30,31 whereby the annealing temperature has a large impact. Having in mind results of the TG-DTA analysis we chose to anneal ma-ZnO/SnO2 composite at two different temperatures: at 400 °C, since up to this temperature adsorbed moisture and gasses will be desorbed while solid state reaction will not be started; and at 700 °C, as the temperature at which solid state reaction take place and is not completed.
XRD patterns presented in Fig. 2(a) indicate a high crystallinity of all examined samples. All the diffraction peaks in the pattern of pristine ZnO can be indexed to wurtzite-type structure with hexagonal phase (P63mc space group; JCPDS no. 89-0510), while the diffraction peaks in pattern of pristine SnO2 belong to cassiterite with tetragonal phase (P42/mnm space group; JCPDS no. 88-0287). Composite powder ma-ZnO/SnO2 is consisted of hexagonal ZnO and tetragonal SnO2 phases, without any other crystal phases. Since there is no reflection of any iron based phases, it can be confirmed that contamination from milling media is below the detection limit of the XRD technique. According to the XRD pattern, the ZnO/SnO2-400 composite has the same phase composition as ma-ZnO/SnO2. However, in the XRD pattern of the ZnO/SnO2-700 composite several additional reflections appeared, indicating the existence of an additional phase. To more precise identify a new phase, broad band composed of (310) and (103) reflections (belonging to SnO2 and ZnO, respectively) of ZnO/SnO2-700 were examined by a deconvolution; Fig. 2(b) shows the expanded and deconvoluted region between 61 and 64 2θ angles. After the deconvolution, a new reflection at 62.5 2θ angle can be clearly seen. It is find that all the additional reflections (marked by a purple circle in Fig. 2(a)), including one at 62.5 2θ angle, belong to Zn2SnO4 (JCPDS no. 74-2184). The development of the Zn2SnO4 phase correlates with the weight gain and a large exothermic peak as observed by TG-DTA.
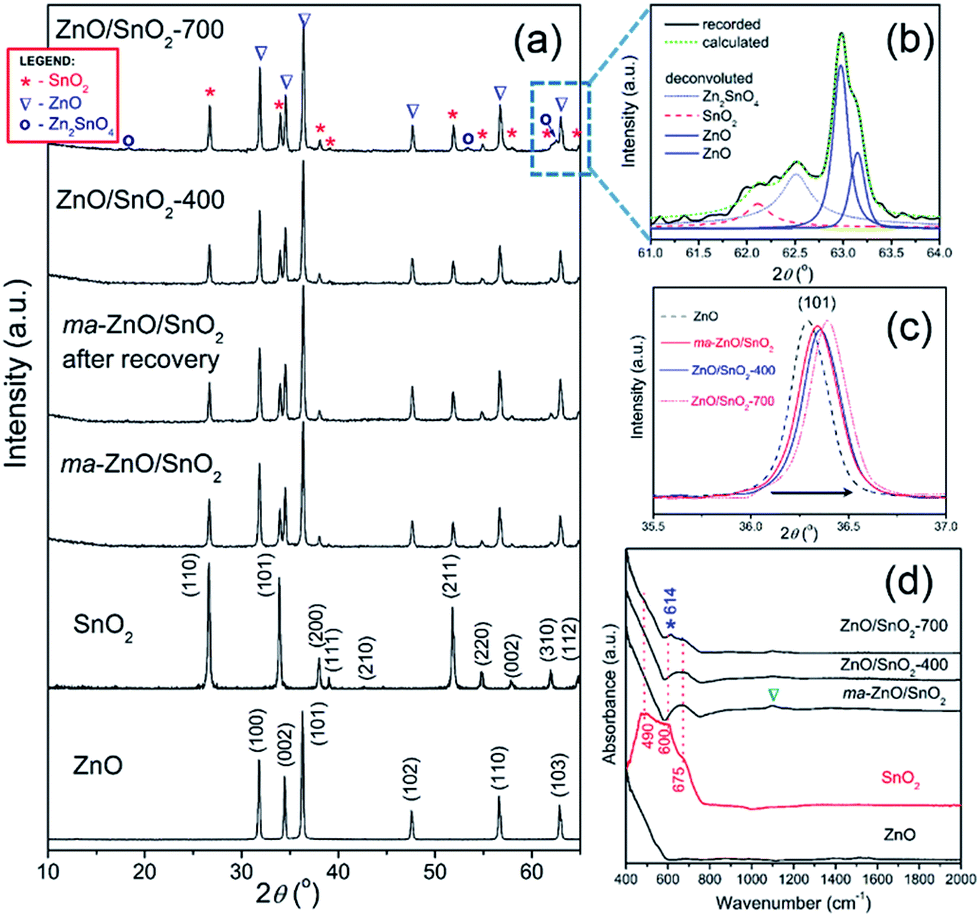 | ||
| Fig. 2 (a) XRD patterns of pristine metal oxides and photocatalysts particles, (b) expanded and deconvoluted 61 to 64° 2θ region of ZnO/SnO2-700, (c) shifting of the (101) reflection of ZnO, and (d) ATR/FT-IR spectra of pristine metal oxides and photocatalysts particles. | ||
It is observed that addition of the SnO2 and increases of the annealing temperature provoke a slight shift of ZnO diffraction peaks toward the higher 2θ angles; in Fig. 2(c) shift of the (101) peak is shown as an illustrative example. The shift of diffraction peaks toward the higher 2θ angles is caused by a decrease of the interplanar spacing, i.e. by a reduction of the lattice parameters (see Table 1). In the cases of ZnO/SnO2-400 and ZnO/SnO2-700 decrease of the interplanar spacing may result from interfacial substitution of zinc sites in ZnO, with a crystal radius of Zn2+ in coordination IV equal to 0.74 Å,32 by Sn4+, with a crystal radius in coordination IV equal to 0.69 Å,32 that were diffused from SnO2 during the annealing process. This process yields a small quantity of Zn2SnO4.
| Sample | DZnO (nm) | DSnO2 (nm) | DZn2SnO4 (nm) | Dcomposite (nm) | ZnO (nm) | SnO2 (nm) | Unit cell parameters (Å) | |||
|---|---|---|---|---|---|---|---|---|---|---|
| [100] | [002] | [110] | [101] | a = b | c | |||||
| a Data for ZnO fraction.b Data for SnO2 fraction. | ||||||||||
| ZnO | 39.14 ± 2.09 | — | — | — | 42.13 | 46.66 | — | — | 3.2477(4) | 5.2044(2) |
| SnO2 | — | 34.94 ± 3.09 | — | — | — | — | 35.75 | 39.87 | 4.7353(5) | 3.1867(4) |
| ma-ZnO/SnO2 | 36.74 ± 2.15 | 36.11 ± 4.59 | — | 36.40 ± 2.56 | 37.89 | 43.45 | 48.21 | 45.00 | 3.2470(6)a | 5.2037(3) |
| 4.7354(7)b | 3.1867(3) | |||||||||
| ZnO/SnO2-400 | 36.43 ± 2.31 | 35.22 ± 2.59 | — | 35.74 ± 1.73 | 40.85 | 43.52 | 41.40 | 44.64 | 3.2468(1)a | 5.1979(4) |
| 4.7353(2)b | 3.1864(3) | |||||||||
| ZnO/SnO2-700 | 44.33 ± 3.67 | 40.12 ± 3.58 | 14.87 ± 3.30 | 37.23 ± 3.49 | 43.32 | 42.96 | 42.65 | 46.05 | 3.2437(3)a | 5.1901(2) |
| 4.7347(5)b | 3.1860(4) | |||||||||
The refined unit cell parameters for all the examined powders are listed in Table 1. It should be stressed that parameters for pristine ZnO and SnO2 powders are in good agreement with those reported in corresponding JCPDS cards (89-0510 and 88-0287, respectively). The refined unit cell parameters shows that mechanical milling slightly reduces ZnO crystal lattice, while crystal lattice of SnO2 stay stable. Additional annealing provokes further reduction of ZnO crystal lattice and trigger shrinkage of tin oxide unit cell, too. The calculated values of crystallite sizes in specific crystallographic directions ([100] and [002] for ZnO, and [110] and [101] for SnO2) and average crystallite size are listed in Table 1. The results implicate a slight decrease of zinc oxide average crystallite size after 2 h of mechanical activation, retaining of that size during annealing at 400 °C, and promoted growth at 700 °C.
As a complementary to the XRD, ATR/FT-IR and Raman spectroscopy studies were used for an analysis of the photocatalysts crystal structure and to determine effects of the mechanical milling and the annealing.
According to the group theory predictions hexagonal ZnO crystals with wurtzite crystal structure and C6v4 symmetry have eight sets of phonon normal modes at the Γ point, represented as Γ = 2A1 + 2E1 + 2B1 + 2E2. Among them, one set of A1 and E1 modes are acoustic, while the remaining ones are optical modes, to be precise, Γopt = A1 + 2B1 + E1 + 2E2. The A1 and E1 are both Raman and infrared active, E2 is Raman active only, whereas B1 is inactive i.e. silent mode. Moreover, the A1 and E1 modes are polar and split into transverse optical (TO) and longitudinal optical (LO) components. The E2 mode is consisted of two modes, of low and high frequency phonons (Elow2 and Ehigh2), associated with the vibration of the heavy ZnO sublattice and oxygen atoms, respectively. Tetragonal SnO2 with rutile crystal structure and D4h14 symmetry has eleven sets of phonon normal modes represented by Γ = 1A1g + 1A2g + 1A2u + 1B1g + 1B2g + 2B1u + 1Eg + 3Eu. Among these phonons A1g, B1g, B2g and Eg are Raman active, while A2u and Eu are infrared active modes.33,34
The ATR/FT-IR spectra of investigated samples are shown in Fig. 2(d). The main characteristic in the spectrum of ZnO particles is peak in the region from 400 to 600 cm−1, attributed to Zn–O vibrations in ZnO lattice.35 The spectrum of SnO2 shows a broad band between 400 and 760 cm−1 attributed to Eu mode of anti-symmetric Sn–O stretching vibrations.3,36 The mathematical deconvolution of this broad band yields three Gaussian peaks centered at 491.5, 603 and 675 cm−1; this result is in accordance with the group theory which predict triple degenerative Eu mode. The spectrum of ma-ZnO/SnO2 shows two main band, first one is in the region from 400 to 600 cm−1 due to Zn–O vibrations and second one in the range 580–750 cm−1 attributed to Sn–O stretching vibrations. It is worth to note that mechanical milling of ZnO/SnO2 mixture leads to almost 180 cm−1 blue shift of Eu mode. Previously have been shown that a blue shift of Eu mode occurs when tin oxide particles are reduced;33,34 in the case of ma-ZnO/SnO2 sample this statement is further confirmed by FESEM analysis, results are discussed later in the text. Furthermore, small band which arouses near 1100 cm−1 (indicated by triangle) is due to C–O stretching vibrations from CO2 adsorbed at the particles surface. The spectrum of ZnO/SnO2-400 is almost the identical as ma-ZnO/SnO2 one, actually, without C–O vibrations since particles have been degassed during annealing at 400 °C. New small and sharp peak at 614 cm−1 (indicated by asterisk) appears in the spectrum of ZnO/SnO2-700; it belongs to Eu mode which is assigned to the surface phonons, thus, any change of the band implicates modifications of the surface structure.33 In this case, during annealing at 700 °C interfacial cations diffuse producing the defects on the particles surface, also modifying the local symmetry in the crystal. Certainly, the band at 614 cm−1 can be indication of Zn–O–Sn vibrations, confirming the development of Zn2SnO4.
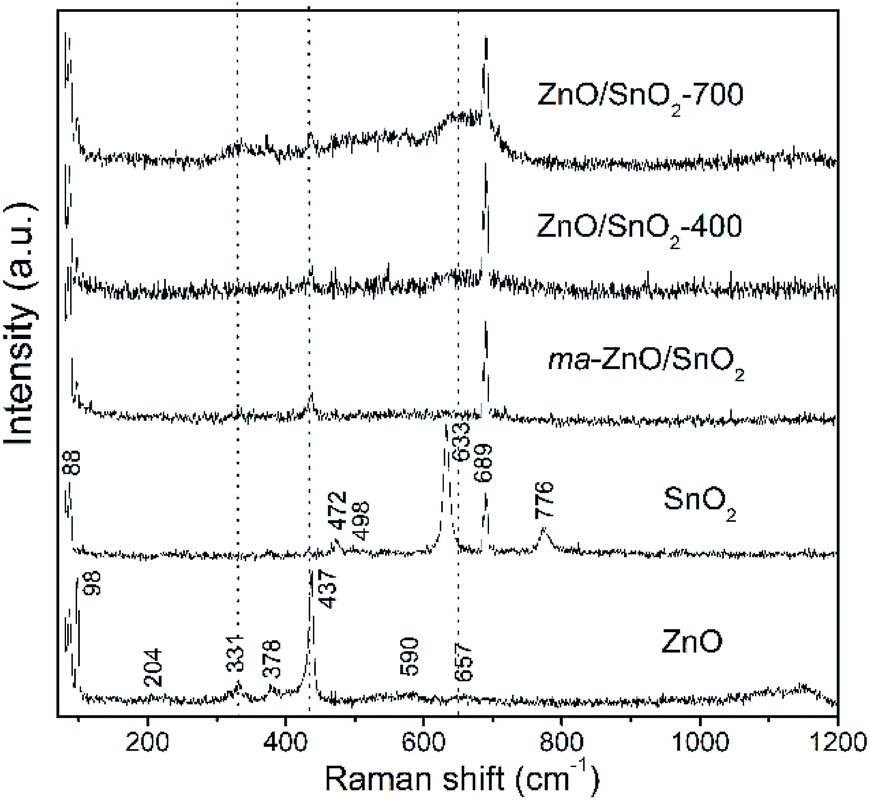
Fig. 3 shows Raman spectra of the pristine metal oxides and the composites. The vibrational modes in spectrum of ZnO are assigned as: an intensive peak near 100 cm−1 is ascribed to the vibrations of the zinc sublattice in ZnO;37,38 the peak around 200 cm−1 is due deformation mode, while the peaks at 330 and 379 cm−1 are due to the second-order vibration mode E2H–E2L and the transverse-optical mode A1 (TO), respectively.38 A sharp and intensive peak near 440 cm−1 is due to E2H mode which is related to vibration of oxygen attached to zinc atoms in the tetrahedral coordination.38 The strong E2H mode indicates high crystallinity which is in good correlation with the XRD data for the pristine ZnO powder. The peak at 590 is attributed to A1 (LO) and E1 (LO) modes, while peak at 657 cm−1 represents combination of acoustic and optical modes (TA + LO). These two peaks revealed the existence of lattice defects, in particular, oxygen vacancies and zinc interstitials.38 It is known that longitudinal optical modes A1 (LO) and E1 (LO) are evident only when the c-axis of the wurtzite crystal structure is parallel to the particles surface.39 Existence of these peaks in Raman spectra of pristine ZnO implicate to rod-shaped particles (this statement is confirmed by FESEM analysis, results are discussed later in the text). Wide band in wavenumber region 1090–1150 cm−1 is attributed to optical overtone 2LO, actually to 2A1 (LO) and 2E1 (LO). The Raman spectrum of tin oxide particles shows the peaks centered at 474, 633, and 776 cm−1 which are ascribed to the Eg, A1g, and B2g modes of SnO2, respectively. Peaks at 474, 631 and 776 cm−1 are related to the expansion and contraction vibration modes of Sn–O bonds in the rutile crystal structure.34 Peaks at 498 and 689 cm−1 belong to infrared-active modes A2u (TO) and A2u (LO), respectively. As it is indicated above, A2u mode is assigned to the surface phonons; obviously for pristine SnO2 sample used in this work the surface atoms represent a significant fraction of atoms.
 | ||
| Fig. 3 Raman spectra of pristine metal oxides and photocatalysts particles. | ||
As can be seen from the Raman spectrum of ma-ZnO/SnO2, the peaks of the SnO2 phase are dominant while those of the ZnO significantly decrease after mechanical milling. This decrease of ZnO peaks intensities is due to the reduction of the zinc oxide crystallinity, related with a large amount of surface defects introduced by mechanical milling.15 Vanishing of the tin oxide peak at 776 cm−1 in the Raman spectra of the composites is due to significant decreases of SnO2 particles sizes after milling (this assumption is further confirmed with results of FESEM and HRTEM analyses). Besides, the tin oxide peak at 663 cm−1 slightly increases and becomes broader in the spectra of annealed composites as compared to spectrum of ma-ZnO/SnO2. This can be attributed to the high-temperature induced substitution of tin cations into the ZnO structure and formation of a small amount of Zn2SnO4.34 In order to compensate positive charge, the substitution of Zn2+ for Sn4+ ions would be accompanied by formation of more VO; that is confirmed in the spectrum of ZnO/SnO2-700 composites, where the intensity and width of the peaks at 330 and 657 cm−1 increases pointing to increase of VO and Zni lattice defects. Thus, evolution of peaks in Raman spectra of ZnO/SnO2 composites confirmed that the relative concentration ratio of bulk defects to surface defects is strongly influenced by processing approach.
Effects of the mechanical milling and successive annealing on particles morphology, size distribution and texture properties were analyzed by scanning electron microscopy, particle size analyzer and nitrogen adsorption–desorption isotherm, respectively.
FESEM images of pristine metal oxides and prepared photocatalysts particles are shown in Fig. 4. As can be seen the pristine ZnO particles are mainly consisted of irregular hexagonal rod-shapes with a smooth crystal facets; their average diameter is about 95 nm while the average length is about 180 nm. The pristine SnO2 powder is consisted of coarse polygonal grains, with average size of about 600 nm, which are organized in agglomerates of about 2 μm sizes. After 2 h of milling significant reduction of ZnO particles or a change of their shape are not observed. It can be noticed that after milling surface of ZnO crystals is no more flat but is covered with a small spheroidal particles of tin oxide. Thus, during the milling soft agglomerates of SnO2 particles are broken; furthermore, primary particles are considerably reduced. The average particle size of ma-ZnO/SnO2 composite is estimated from the recorded micrograph by measuring the largest dimension of more than 300 particles; a particle size distribution is given as the micrograph inset. It should be highlighted that in this case computing program (SemAfore digital slow scan image recording system, version 5.21 demo; JEOL, Tokyo, Japan) is used for estimation of the particle size distribution since it allows distinguishing of ZnO and SnO2 fractions in the mixture. The average particle size of ma-ZnO/SnO2 composite is about 83 nm, among them ZnO crystals are ∼122 nm in average, while the mean size of SnO2 particles is ∼21 nm. According to the micrographs it can be concluded that further annealing have no significant influence on average particle size.
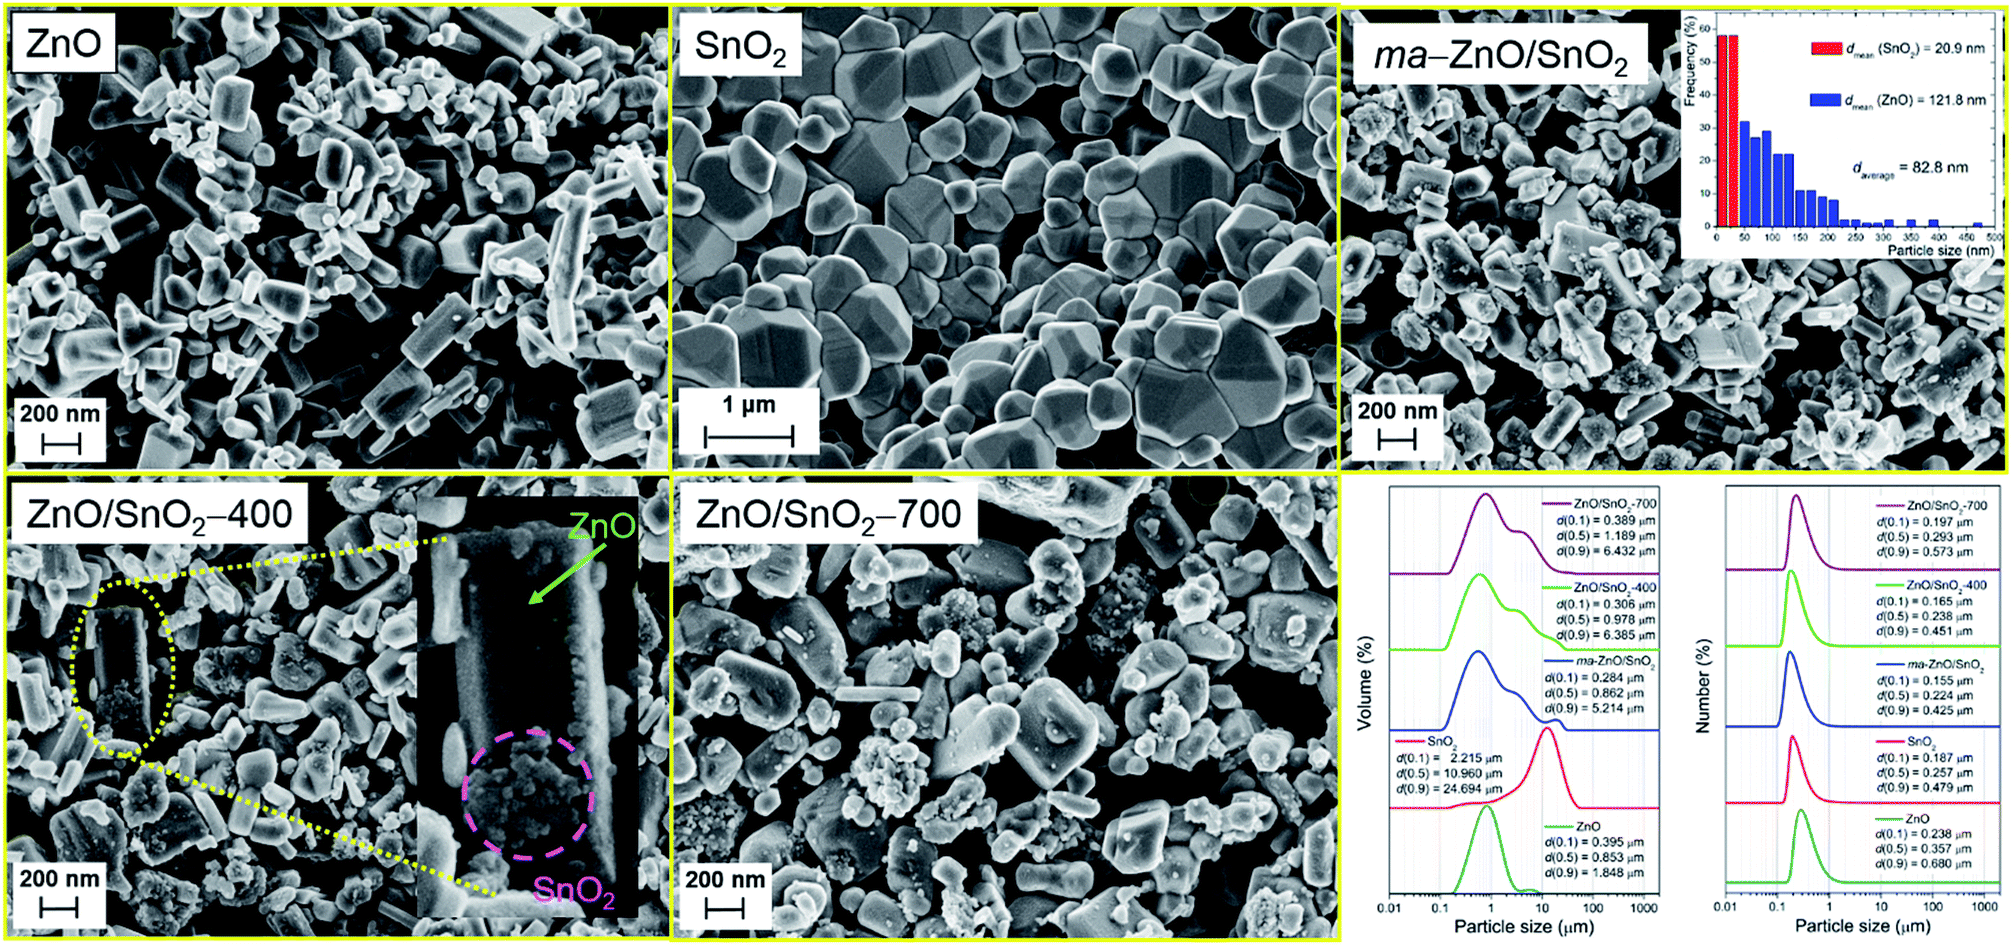 | ||
| Fig. 4 FESEM images of pristine metal oxides and photocatalysts particles; particle size distribution (based on volume and on number) determined by laser diffraction from water suspensions (bottom-right). | ||
The BET results of the specific surface area and pore structure of examined samples are depicted in Table 2. BET surface area of pristine ZnO is 5.75 m2 g−1; total volume of pores is 0.0163 cm3 g−1 with more than 90% of mesopores with diameter between 2 and 50 nm. The BET results show that pristine SnO2 powder is not porous and have low surface area, these values are too small to be measured with very sensitive equipment used for characterization. The BET surface area of ma-ZnO/SnO2 composite is 6.55 m2 g−1, while the total volume of pores is 0.0229 cm3 g−1; both values were slightly higher as compared to pristine metal oxides, implicating profound effects of mechanical treatment especially on commercial SnO2 powder. Annealing at 400 and 700 °C has neglected influence on texture properties of the composite.
| Sample | SBETa (m2 g−1) | Vtotalb (cm3 g−1) | Vmesoc (cm3 g−1) | Vmicrod (cm3 g−1) | rave (nm) | dV(0.5)PSAf (μm) | dN(0.5)PSAg (μm) | Ebg | |
|---|---|---|---|---|---|---|---|---|---|
| (eV) | (nm) | ||||||||
| a SBET – BET specific surface area.b Vtotal – total pore volume.c Vmeso – volume of mesopores (2–50 nm).d Vmicro – volume of micropores (<2 nm).e rav – BJH adsorption average pore diameter.f dV(0.5)PSA – average particle size (based on volume) determined by particle size analyzer (PSA).g dN(0.5)PSA – average particle size (based on number) determined by particle size analyzer (PSA). | |||||||||
| ZnO | 5.75 | 0.0163 | 0.0154 | 0.0020 | 13.64 | 0.853 | 0.357 | 3.26 | 380 |
| SnO2 | — | — | — | — | — | 10.960 | 0.257 | 3.55 | 349 |
| ma-ZnO/SnO2 | 6.55 | 0.0229 | 0.0212 | 0.0023 | 24.53 | 0.862 | 0.224 | 3.21 | 386 |
| ZnO/SnO2-400 | 6.22 | 0.0265 | 0.0252 | 0.0021 | 18.71 | 0.978 | 0.238 | 3.21 | 386 |
| ZnO/SnO2-700 | 6.15 | 0.0249 | 0.0237 | 0.0016 | 18.87 | 1.189 | 0.293 | 3.18 | 390 |
The particles size distributions and characteristics parameters, based on volume and number, determined by a laser diffraction scattering, are presented in the right-bottom part of the Fig. 4. The distribution results based on volume show that average particle sizes of pristine ZnO and SnO2 in water dispersion are 0.85 and 10.96 μm, respectively. Obviously the milling has not significant effects on ZnO particles but a total effect is profound since SnO2 agglomerates have been broken. Actually, the most important effect of milling is on tin oxide dV(0.9) which falls from 24.7 to 5.2 μm. Further annealing slightly increase particle sizes, because particles start to over-connect through sintering procedure. While the distribution over volume describe large particles those occupy a small amount of the sample, the insight in the statistically predominant particles is given by distribution over number.
The distribution over number shows similar trend as the volume one; particles have a high degree of uniformity and a relatively narrow span values. Besides, PSD shows that particles are in the range between 150 (for dN(0.1)) and 680 nm (for dN(0.9)). Since the purpose of this photocatalysts is their usage in water environment, for purification, decolorization, electrolysis, etc., it is very important to separate them from water after usage, either for the sake of recycling or to prevent further water contamination. Thus, dN(0.1), which describes the smallest particles of the photocatalysts in water dispersion, is an important characteristics which determine the way of their separation. In this case, catalysts can be removed from the liquid phase by filtration through a (cellulose acetate, nylon, etc.) membrane with pore size of 0.10 μm.
TEM and HRTEM images presented in Fig. 5 provide direct information about size and shape of the composite particles after annealing at 400 and 700 °C. As it is clearly illustrated at low magnified TEM images (Fig. 5, left), both samples are mainly composed of elongated ZnO grains with longer edge of about 200 nm (sporadically grains with 500 nm length are observed) and much smaller nanosized grains of SnO2. While nanosized SnO2 grains are present in the form of loosely connected agglomerates in ZnO/SnO2-700 sample, Fig. 5(b), their presence in ZnO/SnO2-400 sample is revealed at the surface of the ZnO grains in the HRTEM image, Fig. 5(a). A higher magnification pointed out that SnO2 particles sized around 20 nm are single crystallized; marked periodical structures belong to the (110) plane of cassiterite (JCPDS no. 88-0287) which persistence in this sample is confirmed by XRD analysis. Furthermore, the interplanar distance of 1.908 Å associated with the (102) plane of hexagonal wurtzite-type structure is clearly distinguished in a quite larger ZnO grain (FFT inset presented at Fig. 5), indicating formation of the ZnO/SnO2 heterojunction in this sample. The annealing at higher temperature increases formation of SnO2 agglomerates in ZnO/SnO2-700 sample. Despite it, a small amount of SnO2 nanocrystallites dispersed over larger ZnO grains is still notable in HRTEM image, Fig. 5(b). The corresponding elemental mapping (EDXS analysis), Fig. 6 and 7, verifies phase designation of particles based on HRTEM/FFT analysis. Moreover, it highlights that SnO2 nanocrystallites are present on the surface of much larger ZnO particles in both samples, but their spreading is more uniform in ZnO/SnO2-700 sample, Fig. 7. The driving force for such self-assembling originates from the high-temperature solid state diffusion.
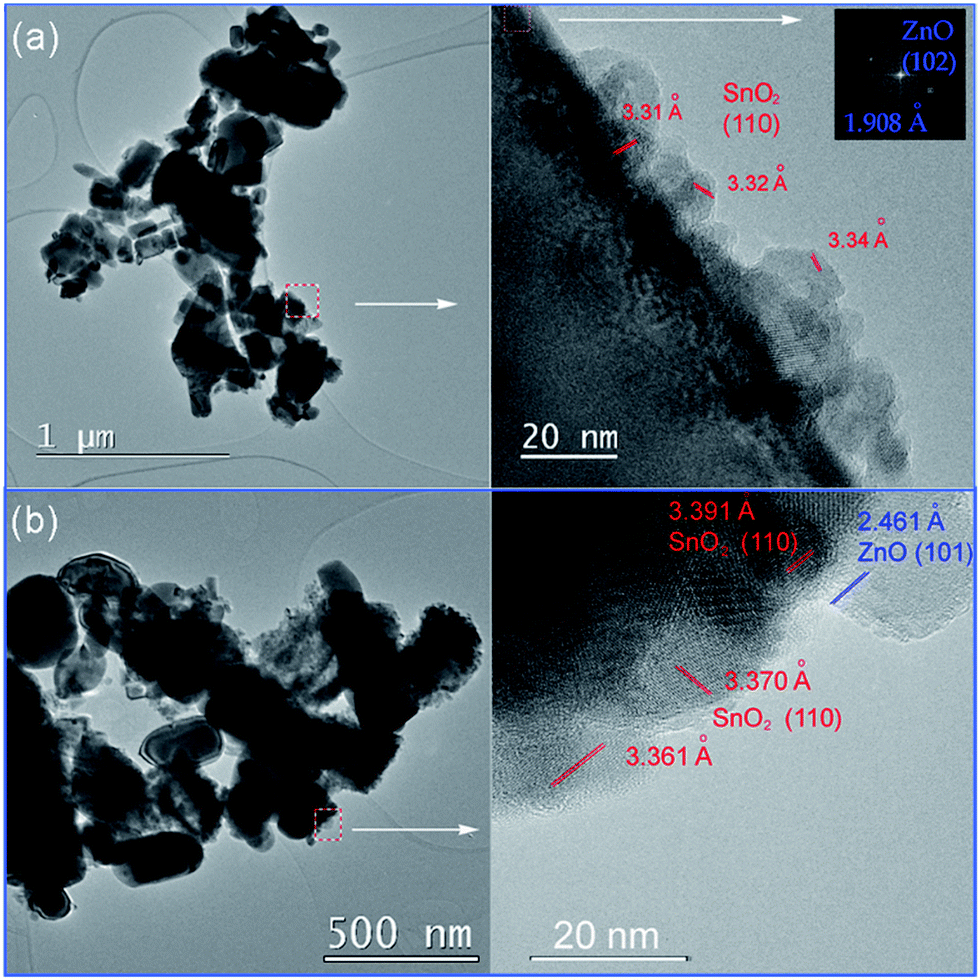 | ||
| Fig. 5 TEM (left), and HRTEM (right) with marked interplanar distances of: (a) ZnO/SnO2-400 powder; FFT of ZnO phase is given as an inset, and (b) ZnO/SnO2-700 powder. | ||
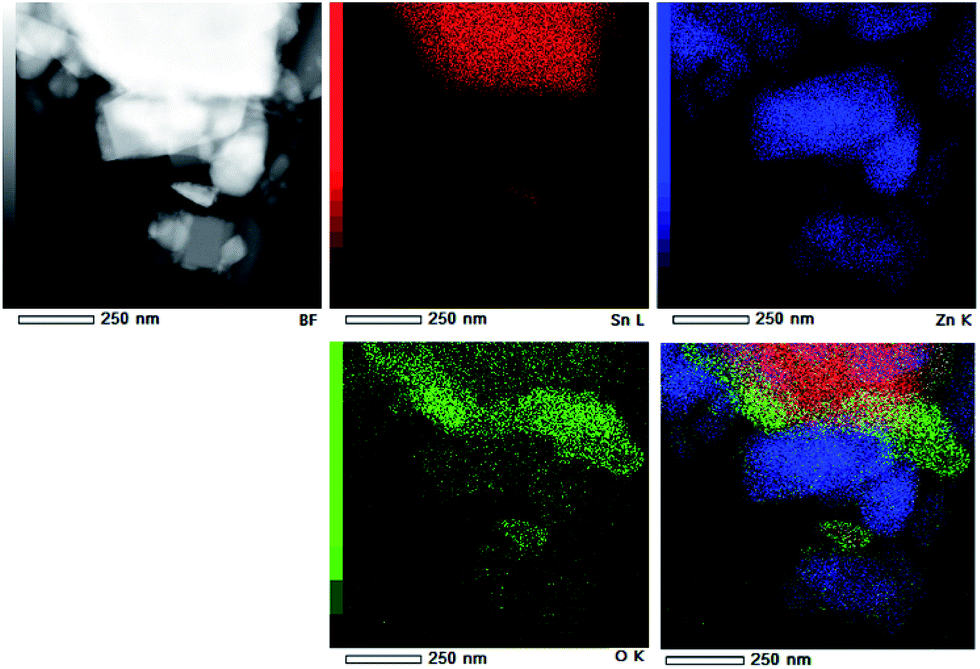 | ||
| Fig. 6 EDXS mapping of Zn, Sn, and O concentration in ZnO/SnO2-400 powder. | ||
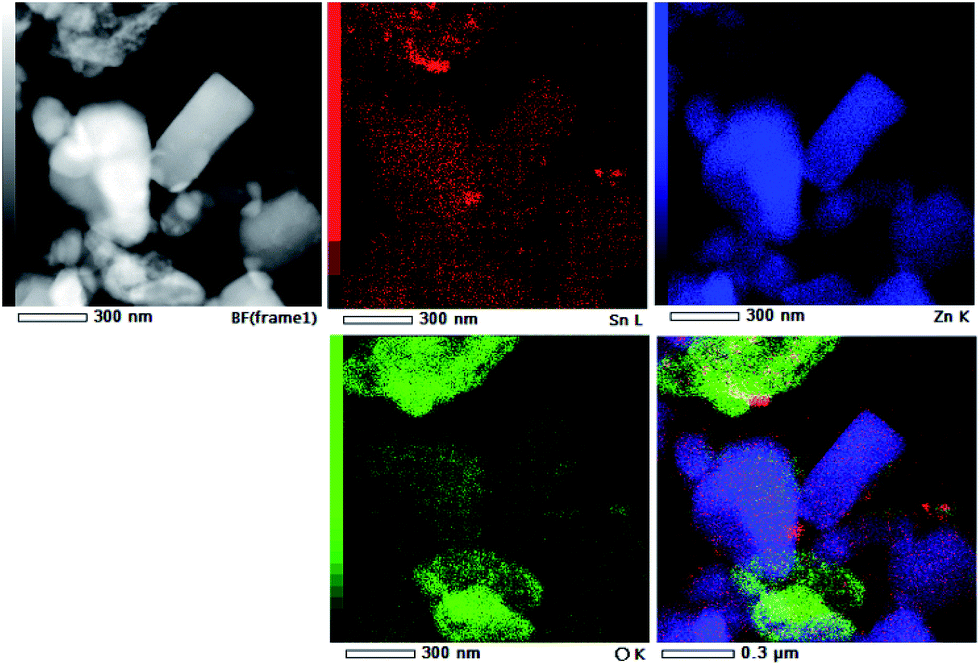 | ||
| Fig. 7 EDXS mapping of Zn, Sn, and O concentration in ZnO/SnO2-700 powder. | ||
The optical properties of pristine ZnO and SnO2 powders, also, the effects of mechanical milling and subsequent annealing on the capacity of visible light absorption and band gap energy of photocatalysts were examined by UV-Vis DRS, plots are presented in Fig. 8. Diffuse reflectance spectra, Fig. 8(a), reveal characteristic R curves for all the examined powders. It can be observed that the absorption edge for SnO2 is near 300 nm, while for all the other powders is near 380 nm. Besides, metal oxides have similar reflectance in the visible light region, between 85 and 95%, which is much larger than reflectance of composite powders. The lowest reflectance in the spectral region 380–800 nm shows ma-ZnO/SnO2 and ZnO/SnO2-400 composites, while ZnO/SnO2-700 has the lowest reflectance (below 25%) in the range 380–500 nm, with further tendency to increase up 45% between 500 and 800 nm. It should be highlighted that the absorption capacity of composites is almost three times improved in comparison with pristine metal oxides. The improved absorption capacity of composite may be attributed to a large number of surface defects introduced by mechanical activation; on this way, profound influence of mechanical milling on optical properties is confirmed. (Here, the absorption capacity can be correlated with reflectance since the measurements were done on pellets with thickness of 1 mm, thus, transparence could be neglected).
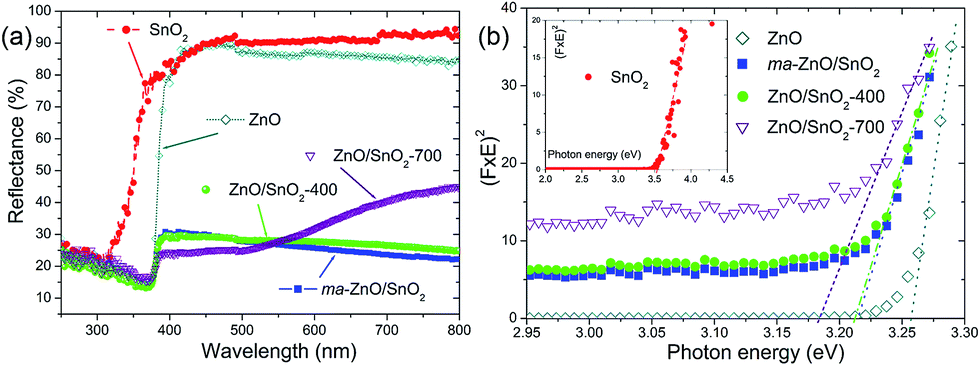 | ||
| Fig. 8 (a) The UV-Vis diffuse reflectance spectra of pristine metal oxides and photocatalysts, and (b) Kubelka–Munk curves for determination of the band gap energies. The band gaps are attained by the extrapolation procedure. | ||
The direct band gap energies (Ebg) of the photocatalysts were determined from the plots of Kubelka–Munk function versus photon energy (eV).36,40 First of all, the diffuse reflectance R is correlated to the Kubelka–Munk function F(R) by relation F(R) = (1 − R2)/(2R); then, band gap energies were estimated from a plot of (F(R)·hν)2 = f(hν) as intercepts obtained by the extrapolation of the linear part of the curves to (F(R)·hν)2 = 0, as it is shown in Fig. 8(b). Determined Ebg values are 3.55 eV for SnO2, 3.26 eV for ZnO, 3.21 eV for ma-ZnO/SnO2 and ZnO/SnO2-400 composites, and 3.18 eV for ZnO/SnO2-700.
The red shift of ma-ZnO/SnO2 band gap energy of 0.05 eV as compared to pristine ZnO can be attributed to surface defects achieved during mechanical activation. Further annealing at 400 °C did not influences crystal structure nor phase composition, thus neither influence the band gap energy. However, annealing at 700 °C red-shifted band gap energy for 0.08 eV as compared to ZnO; it is probably due to both, existence of the surface defects and diffusion of tin cations into ZnO lattice, which also promote formation of VO.
Photoluminescence study was used to determine type of defects in pristine metal oxides and ZnO/SnO2 composites. It is known that ZnO and SnO2 particles have rich defect chemistry41,42 and variety of defects may exist in these crystals, in particular, cation vacancy, oxygen vacancy, cation interstitial, oxygen interstitial, as well as antisites. As have been shown, the presence of different defects can result in both, improvement and deterioration of the photocatalytic activity, depending on the type and location of the defects. It is generally accepted that surface defects are favourable, whereas bulk ones only can worsen the photocatalytic activity of ZnO. Thus, determination of defects in photocatalysts can be useful for understanding and further improving of their photoactivity.
The room temperature PL spectra of the photocatalysts are presented in Fig. 9(a). It can be seen that all of the PL spectra show UV emission band, near the band-edge, and a broad visible emission band; however, the spectra vary with milling and annealing. To reveal positions and area (%) of the hidden emission bands, PL spectra were deconvoluted with multiple Gaussian functions; the data obtained by deconvolution are listed in Table 3, while deconvoluted spectra are presented in Fig. 9(b–f). The PL spectrum of pristine ZnO is found to be convolution of six Gaussian components centered at 385, 409, 435, 454, 485 and 582 nm, Fig. 9(b). The sharp and intense band at 385 nm is typical for the near band edge emission and is due to the recombination of the self-excitons of ZnO. The violet emission at 409 nm can be attributed to the surface zinc vacancies (VZn).15 The blue emission bands at 435, 454 and 485 nm are caused by the transitions of excited electrons from the Zni level to the valence band.15 The yellow emission near 580 nm is due to the doubly charged oxygen vacancy states  , representing deep-level i.e. lattice defect. These results are in agreement with Raman spectroscopy ones (Fig. 3) which revealed the existence of oxygen vacancies and zinc interstitials. However, beside of the commonly assumed deep-level defects, the yellow emission can be also attributed to the Zn(OH)2 or OH groups at the ZnO particles surface.43 For the pristine ZnO powder, used in this study, the existence of surface OH ions is previously confirmed by XPS analysis.44
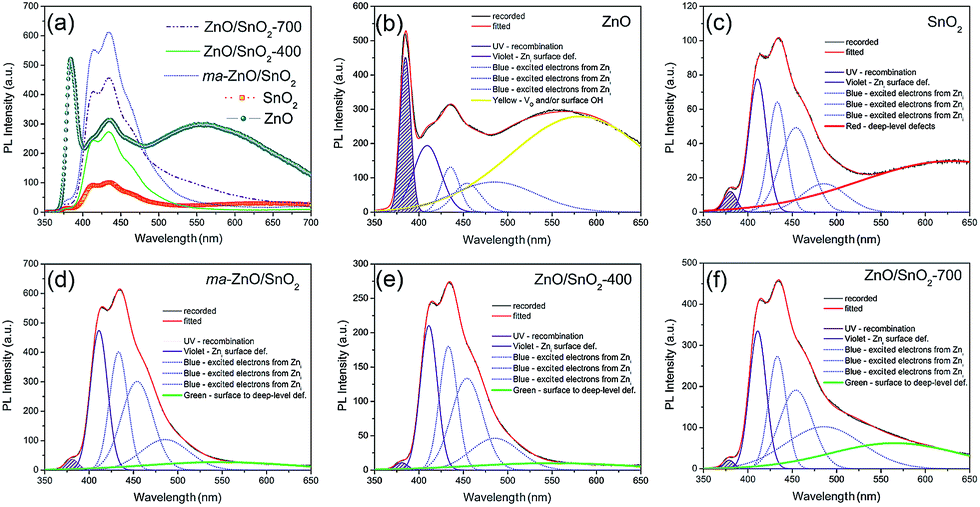 | ||
| Fig. 9 (a) Photoluminescence spectra of pristine metal oxides and photocatalysts under excitation at 325 nm, (b–f) PL spectra deconvoluted with a Gaussian function. | ||
| Peak | Emission | ||||||||
|---|---|---|---|---|---|---|---|---|---|
| UV | Violet | Blue | Green | Yellow | Red | ||||
| ZnO | Position (nm) | 385 | 409 | 435 | 454 | 485 | 582 | ||
| Area (%) | 8.85 | 10.01 | 4.49 | 4.26 | 13.75 | 58.63 | |||
| SnO2 | Position (nm) | 380 | 410 | 433 | 454 | 486 | 630 | ||
| Area (%) | 1.85 | 17.03 | 14.22 | 18.86 | 9.06 | 38.98 | |||
| ma-ZnO/SnO2 | Position (nm) | 380 | 411 | 433 | 454 | 486 | 546 | ||
| Area (%) | 1.41 | 24.10 | 21.38 | 27.96 | 14.73 | 10.42 | |||
| ZnO/SnO2-400 | Position (nm) | 380 | 411 | 433 | 454 | 485 | 549 | ||
| Area (%) | 0.88 | 24.31 | 21.79 | 28.35 | 15.28 | 9.39 | |||
| ZnO/SnO2-700 | Position (nm) | 379 | 411 | 433 | 454 | 486 | 565.5 | ||
| Area (%) | 0.68 | 17.70 | 15.24 | 19.94 | 24.33 | 22.11 | |||
Deconvoluted PL spectrum of pristine SnO2 powder shows a weak band centered at 380 nm, the violet emission at 410 nm, three blue emission bands peaking at 433, 454 and 486 nm, and a strong broad red emission band at 630 nm, Fig. 9(c). The red emission band is related to deep-level defects within the gap of SnO2, associated with oxygen vacancies and Sn interstitial formed during synthesis procedure.42 The intensities of PL bands in spectrum of SnO2 are significantly smaller as compared to those in PL spectrum of ZnO. PL spectrum of ma-ZnO/SnO2 composite, Fig. 9(d), is consisted of six bands centered at 380, 411, 433, 454, 486 and 546 nm. Comparing to PL spectra of metal oxides, composite one did not shows yellow or red emissions attributed to deep-level defects, instead, green emission appears at 546 nm. Green emission implicates to surface defects, as well as the defects just below the crystallite surface.43 These results confirmed that milling considerably influenced the relative concentration ratio of surface defects to bulk defects. PL spectra of annealed composites show almost the same emission bands as that of ma-ZnO/SnO2. However, results of the deconvolution point to different band area ratio of bulk defects to surface defect, which is somewhat higher for ZnO/SnO2-700. Slightly larger amount of the bulk defects in ZnO/SnO2-700 is due to the formation of Zn2SnO4 accompanied by VO, which is also in accordance with results of the Raman spectroscopy. Results of the PL spectroscopy clearly reveal that the relative concentration of surface defects is larger in the composites as compared to pristine ZnO while the number of exciton recombination is reduced.
Fig. 10(a and b) shows the efficiency of the photocatalytic de-colorization of MB dye in the presence of pristine ZnO and prepared composites under two different illumination sources. It was found that less than 1% of the MB was adsorbed on the photocatalysts after the equilibration of the dye-photocatalyst suspension in a dark. The neglected adsorption is due to a relatively small specific surface area. When UV light was used as illumination source composites ma-ZnO/SnO2 and ZnO/SnO2-400 show improved activity compared to pristine ZnO, while the lowest efficiency was observed when ZnO/SnO2-700 was applied, Fig. 10(a). The linear kinetic curves of the ln(C/Co) versus the illumination time plot, Fig. 10(c), implicate first order reaction kinetics. The calculated kinetic parameters, the rate constant of photo-de-colorization (K1 [min−1]) and t1/2 [min], are denoted in Table 4. When the most efficient photocatalysts, ma-ZnO/SnO2 and ZnO/SnO2-400, were used MB dye solution was completely de-colorized after 40 min, whereas the time necessary for the de-colorization of 50% of the dye was t1/2 = 9.42 and 10.86 min, respectively. When the pristine ZnO was used, MB dye was completely de-colorized after 90 min, while t1/2 = 19.47 min.
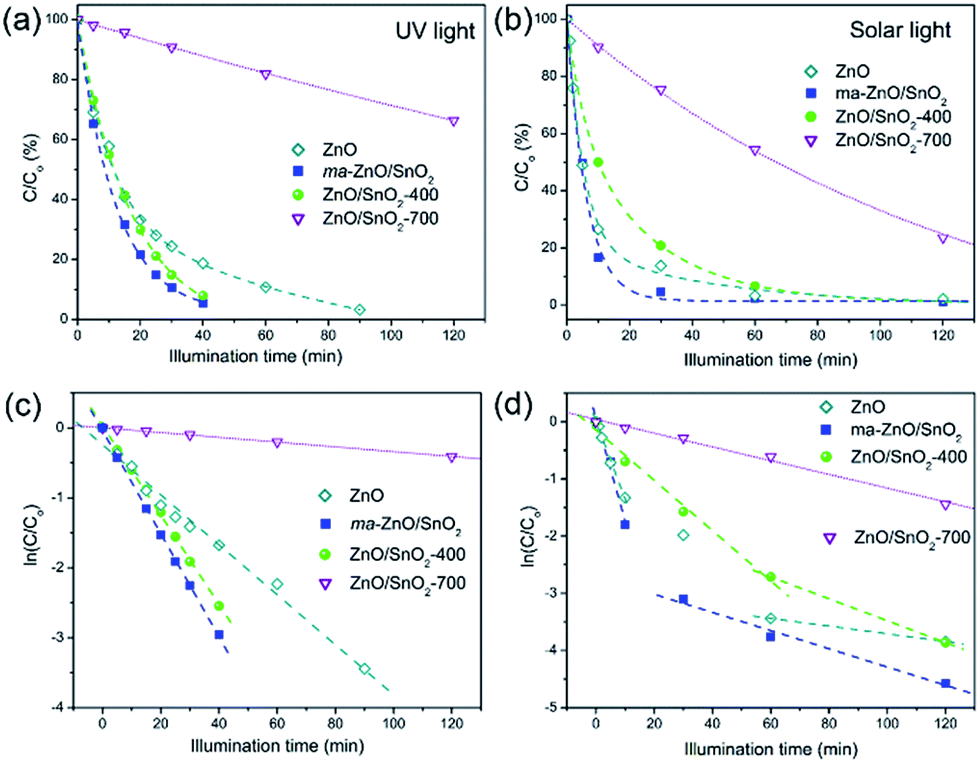 | ||
| Fig. 10 Photocatalytic efficiency, and appropriate first-order reaction kinetic plots, for de-colorization of [MB]i = 10 ppm in the presence of examined samples, under: (a, c) UV, and (b, d) natural sunlight illumination. | ||
| Sample | UV lamp | Natural sunlight | ||||
|---|---|---|---|---|---|---|
| K1 [min−1] | t1/2 [min] | K(1)1 [min−1] | t(1)1/2 [min] | K(2)1 [min−1] | t(2)1/2 [min] | |
| ZnO | 3.56 × 10⁻² | 19.47 | 1.36 × 10⁻¹ | 5.10 | 6.76 × 10⁻³ | 102.54 |
| ma-ZnO/SnO2 | 7.36 × 10⁻² | 9.42 | 1.80 × 10⁻¹ | 3.85 | 1.59 × 10⁻² | 43.59 |
| ZnO/SnO2-400 | 6.38 × 10⁻² | 10.86 | 4.40 × 10⁻² | 15.75 | 1.91 × 10⁻² | 36.29 |
| ZnO/SnO2-700 | 3.42 × 10⁻³ | 202.67 | 1.20 × 10⁻² | 57.76 | — | — |
When natural sunlight was used as the illumination source, the activity decreases in order ma-ZnO/SnO2 < ZnO < ZnO/SnO2-400 < ZnO/SnO2-700, Fig. 10(b). Fig. 10(d) shows kinetic plots for sunlight driven photocatalytic de-colorization of MB in the presence of examined samples. Each of the curves can be separated into two linear segments with different slopes. For each slope the rate constant of photo-de-colorization was calculated and denoted as K(1)1 and K(2)1, also, t(1)1/2 and t(2)1/2 were calculated and listed in Table 4. When ma-ZnO/SnO2 was used MB was almost completely (97%) de-colorized after 30 min and t(1)1/2 was equal to 3.85 min. That is significantly faster than 60 min, which is time necessary to decolorize 97% of MB in the presence of ZnO, with t(1)1/2 of 5.10 min.
In order to test photocatalytic stability of ma-ZnO/SnO2 under long run working conditions, the degradation of MB was determined in repeated cycles without the photocatalyst being subject to any cleaning treatments after degradation process was completed. The photocatalytic activity of composite was compared in three consecutive runs and obtained data are presented in Fig. 11. It should be stressed that the activity of ma-ZnO/SnO2 is preserved under long run working conditions. Moreover, after the ma-ZnO/SnO2 photocatalysts had been loaded with MB and UV light illuminated, and then consecutively recovered, the crystal structure of the photocatalyst was checked by XRD. The recovered photocatalyst showed almost the same XRD pattern as the initial one (see Fig. 2), which indicates that ma-ZnO/SnO2 has a stable crystal structure during long-term photocatalysis and is suitable for recycling and reuse with a slight loss of the photocatalytic activity.
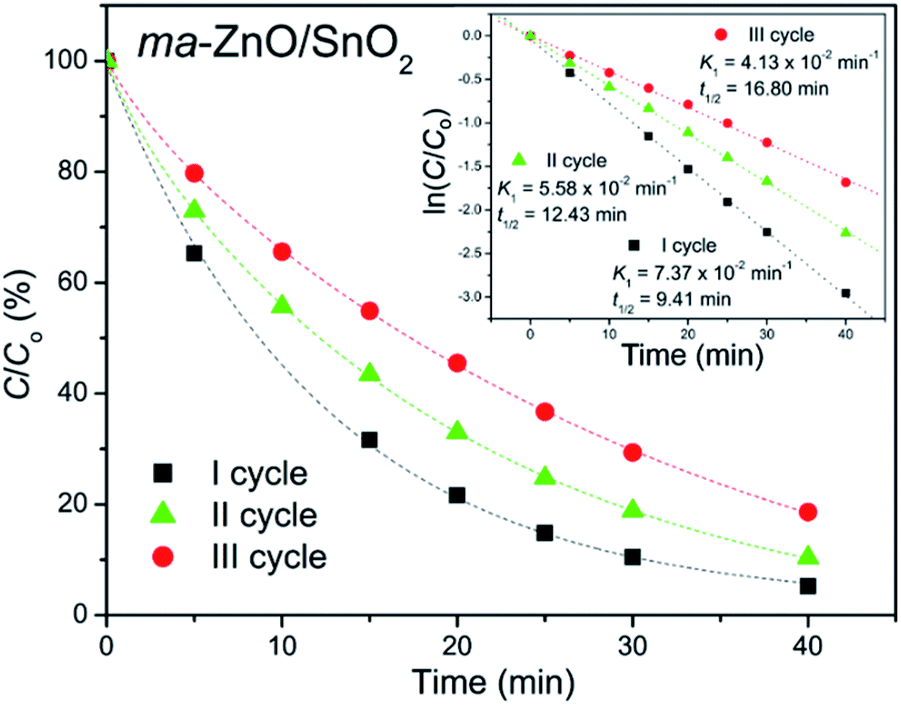 | ||
| Fig. 11 Recycling test of ma-ZnO/SnO2 photocatalyst on de-colorization of [MB]i = 10 ppm under UV light illumination. | ||
The most efficient photocatalyst, ma-ZnO/SnO2, was also tested for the degradation of phenol, as a representative of pollutants that have no absorption in the visible range. Fig. 12 shows the efficiency of the photocatalytic degradation of phenol in the presence of ma-ZnO/SnO2 photocatalysts under natural sunlight illumination. We found that less than 2% of the phenol concentration was adsorbed on the ma-ZnO/SnO2 during 1 h of the equilibration of the phenol-photocatalyst suspension in a dark. Under direct sunlight illumination the phenol concentration rapidly decreased; after 30 min, more than 60% of phenol was removed, while after 2 h phenol was completely removed from the system. Accordingly, ma-ZnO/SnO2 can be used as an effective photosensitizer for phenol, as well as for the MB dye. Besides, it was found that the decrease of the total organic carbon (TOC) via mineralization was much slower than the degradation of phenol, Fig. 12. This discrepancy was previously explained as a result of the phenol photo-oxidation to benzoquinone and its further slow degradation to CO2 and H2O.45
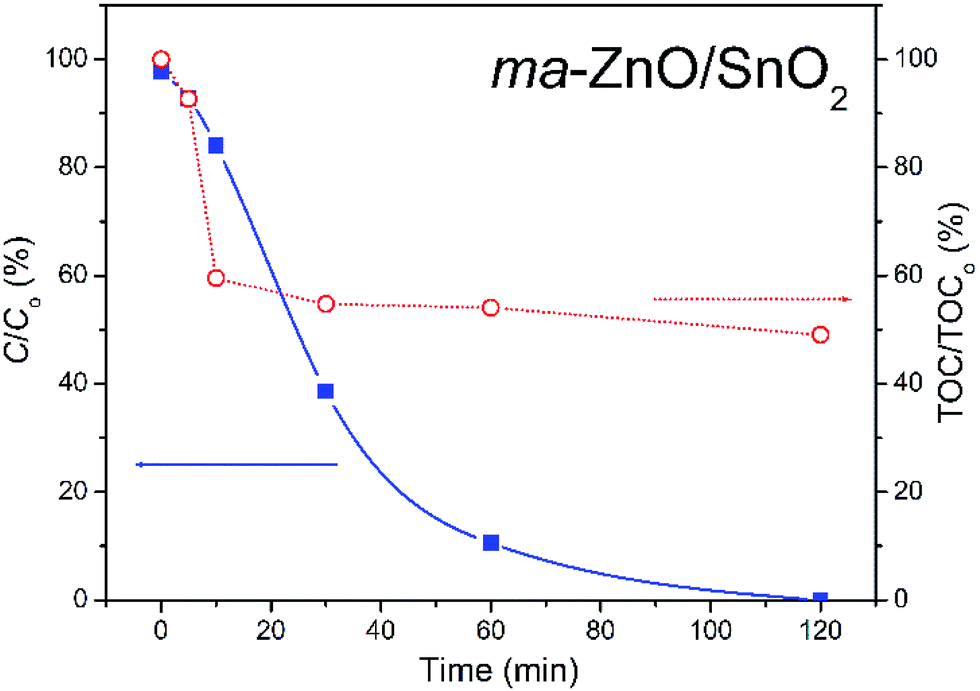 | ||
| Fig. 12 Photocatalytic efficiency for the degradation of [phenol]i = 10 ppm in the presence of ma-ZnO/SnO2, under natural sunlight illumination with TOC efficiency. | ||
Presented results promote ma-ZnO/SnO2 as efficient photocatalysts under both, UV and natural sunlight. PL results implicate that the enhanced photo-activity of ma-ZnO/SnO2 as compared to pristine ZnO is due to the surface defects. In the case of UV-light driven photoreaction, the surface defects increased the separation of photogenerated carriers, thereby hindering recombination. What's more significant, the surface defects contributes to the visible light absorption. The presence of Zni point defects contributes to the visible light absorption due to the defect level located in the band gap, at 0.22 eV below the conductive band46 (narrowing band gap to about 3.15 eV or 400 nm). This defects also promotes charge transfer and suppress electron–hole recombination.
Besides intrinsic defects, the ZnO/SnO2 heterojunction particles are involved in enhanced photocatalytic activity. A prominent role of ZnO/SnO2 heterojunction particles in the separation of photogenerated electrons and holes, which further improved photocatalytic activity, had been previously explained as a result of band energy alignment.47 Actually, both ZnO and SnO2 belong to n-type semiconductors; among them, SnO2 is a better electron acceptor than ZnO because the conduction band potential of SnO2 (0 V vs. normal hydrogen electrode (NHE) at pH 7) is more positive than that of ZnO (−0.5 V vs. NHE at pH 7), Fig. 13(a).3,48 It may be expected that a type-II heterostructure49 with a staggered alignment at the heterojunction is formed for ma-ZnO/SnO2 heterojunction particles, Fig. 13(b).47 In such a case, the electron–hole pairs generated under sunlight illumination will be separated due to thermodynamic favouring: electrons will move from the CB energy level of ZnO to the SnO2 one and holes will move from the VB level of SnO2 to the ZnO one. This process promotes the formation of a charge transfer state and the spatial separation of the photogenerated carriers within the ZnO/SnO2 heterojunction particles.47
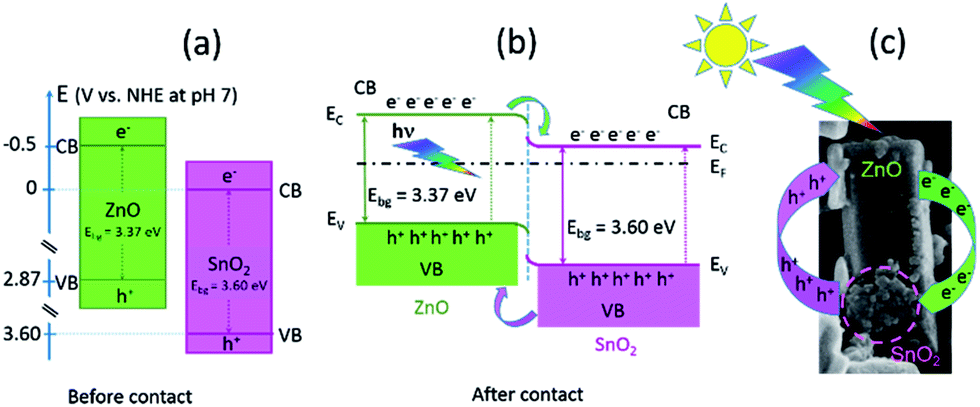 | ||
| Fig. 13 Band structures for: (a) ZnO and SnO2 before contact, (b) ZnO/SnO2 after contact, and (c) illustrative representation of the mechanism of photoexcited charge-carrier transport in the ZnO/SnO2 hetero-particle. | ||
The substitution of Zn2+ ions for Sn4+ results in surface modification and formation of more VO in order to compensate the positive charge. The surface VO act as charge carriers of holes, thus, facilitated charge separation. However, annealing at 700 °C for 2 h deteriorate the photocatalytic activity of the composite. The activity decreased due to the formation of both, photoinactive Zn2SnO4 and the bulk oxygen vacancies (with the energy level close to the middle of the gap)50 acting as a charge recombination centers.
4. Conclusions
ZnO/SnO2 composite was processed by mechanical milling of ZnO and SnO2 commercial powders. In this process, SnO2 particles were significantly reduced and decorated on the surface of larger hexagonal ZnO submicro-rods. The photocatalytic activity study showed that ZnO/SnO2 composite particles possess an enhanced efficiency for MB de-colorization as compared to pristine ZnO, under both UV and sunlight. The results of structural, morphological, textural and optical properties of ZnO/SnO2 composite and ingredients implicate to a significant contribution of surface defects in enhancement of the photoactivity. A high relative concentration ratio of surface defects to bulk defects was introduced by milling, also, by existence of ZnO/SnO2 heterojunction particles. Surface defects narrowed band gap of ZnO/SnO2 composite, thus increasing the capacity of visible light absorption as compared to ZnO. Surface defects, in particular zinc interstitials and oxygen vacancies, facilitated charge separation, thereby hindering the recombination of photogenerated carriers as compared to pristine ZnO. Annealing of composite at 700 °C stimulate diffusion of tin(IV) cations into the ZnO particles and formation of both, photoinactive Zn2SnO4 and the bulk oxygen vacancies which acts as recombination centers for carriers, resulting in the loss of photoactivity.This study aims to draw attention to the mechanical activation as an inexpensive and environmental friendly technique for the large-scale production of the long-run working composite with an enhanced photocatalytic activity under illumination of either UV or sunlight.
Conflicts of interest
There are no conflicts to declare.Acknowledgements
This study was supported by the Ministry of Education, Science and Technological Development of the Republic of Serbia under grant no III45004. The authors are grateful to Dr N. Abazović from the Vinča Institute of Nuclear Sciences, for UV-vis DRS results, Dr B. Hadžić from Institute of Physics, for Raman measurements and Prof. Dr S. Stojadinović from Faculty of Physics, for PL measurements. The authors appreciate the help of Prof. Dr Ilija Brčeski and experts in charge for TOC measurements in the MOL Institute from Stara Pazova.References
- A. Fujishima and K. Honda, Nature, 1972, 238(5358), 37–38 CrossRef CAS PubMed.
- A. Hamrouni, N. Moussa, F. Parrino, A. Di Paola, A. Houas and L. Palmisano, J. Mol. Catal. A: Chem., 2014, 390, 133–141 CrossRef CAS.
- Q. Luo, L. Wang, D. Wang, R. Yin, X. Li, J. An and X. Yang, J. Environ. Chem. Eng., 2015, 3, 622–629 CrossRef CAS.
- A. Hamrouni, H. Lachheb and A. Houas, Mater. Sci. Eng., B, 2013, 178, 1371–1379 CrossRef CAS.
- S. K. Pardeshi and A. B. Patil, Sol. Energy, 2008, 82, 700–705 CrossRef CAS.
- E. Yassitepe, H. C. Yatmaz, C. Öztürk, K. Öztürk and C. Duran, J. Photochem. Photobiol., A, 2008, 198, 1–6 CrossRef CAS.
- R. Wu, Y. Yang, S. Cong, Z. Wu, C. Xie, H. Usui, K. Kawaguchi and N. Koshizaki, Chem. Phys. Lett., 2005, 406, 457–461 CrossRef CAS.
- J. A. Duffie and W. A. Beckman, Solar engineering of thermal processes, John Wiley & Sons, Inc., Hoboken, New Jersey, 4th edn, 2013 Search PubMed.
- S. Liu, C. Li, J. Yu and Q. Xiang, CrystEngComm, 2011, 13, 2533–2541 RSC.
- S. Baruah, R. F. Rafique and J. Dutta, Nano, 2008, 3, 399–407 CrossRef CAS.
- S. Baruah, S. K. Pal and J. Dutta, Nanosci. Nanotechnol.--Asia, 2012, 2, 90–102 CrossRef CAS.
- X. Chen, L. Liu, P. Y. Yu and S. S. Mao, Science, 2011, 331, 746–750 CrossRef CAS PubMed.
- W. Li, R. Liang, A. Hu, Z. Huanga and Y. N. Zhou, RSC Adv., 2014, 4, 36959–36966 RSC.
- T. Xia, P. Wallenmeyer, A. Anderson, J. Murowchick, L. Liu and X. Chen, RSC Adv., 2014, 4, 41654–41658 RSC.
- D. Chen, Z. Wang, T. Ren, H. Ding, W. Yao, R. Zong and Y. Zhu, J. Phys. Chem. C, 2014, 118, 15300–15307 CAS.
- T. Jia, J. Zhao, F. Fu, Z. Deng, W. Wang, Z. Fu and F. Meng, Int. J. Photoenergy, 2014, 197824 Search PubMed.
- R. Lamba, A. Umar, S. K. Mehta and S. K. Kansal, Talanta, 2015, 131, 490–498 CrossRef CAS PubMed.
- Q. Wang, D. Jiao, J. Lian, Q. Ma, J. Yu, H. Huang, J. Zhong and J. Li, J. Alloys Compd., 2015, 649, 474–482 CrossRef CAS.
- C. C. Li, X. M. Yin, Q. H. Li and T. H. Wang, CrystEngComm, 2011, 13, 1557–1563 RSC.
- M. M. Rashad, A. A. Ismail, I. Osama, I. A. Ibrahim and A.-H. T. Kandil, Clean: Soil, Air, Water, 2014, 42, 657–663 CrossRef CAS.
- Y. Zhou, C. Xia, X. Hu, W. Huang, A. A. Aref, B. Wang, Z. Liu, Y. Sun, W. Zhou and Y. Tang, Appl. Surf. Sci., 2014, 292, 111–116 CrossRef CAS.
- Z. Wen, G. Wang, W. Lu, Q. Wang, Q. Zhang and J. Li, Cryst. Growth Des., 2007, 7, 1722–1725 CAS.
- T. Jia, W. Wang, F. Long, Z. Fu, H. Wang and Q. Zhang, J. Phys. Chem. C, 2009, 113, 9071–9077 CAS.
- A. Dodd, A. McKinley, M. Saunders and T. Tsuzuki, Nanotechnology, 2006, 17, 692–698 CrossRef CAS.
- A. A. Coelho, Topas-Academic, 2004 Search PubMed.
- H. P. Klug and L. E. Alexander, X-ray diffraction procedures for polycrystalline and amorphous materials, Wiley, New York, 4th edn, 1954 Search PubMed.
- S. K. Pardeshi and A. B. Patil, J. Mol. Catal. A: Chem., 2009, 308, 32–40 CrossRef CAS.
- F. Rouquerol, J. Rouquerol and K. Sing, Adsorption by powders and porous solids, Academic Press, London, 1999 Search PubMed.
- E. P. Barrett, L. G. Joyner and P. P. Halenda, J. Am. Chem. Soc., 1951, 73, 373–380 CrossRef CAS.
- W. Cun, Z. Jincai, W. Xinming, M. Bixian, S. Guoying, P. Ping'an and F. Jiamo, Appl. Catal., B, 2002, 39, 269–279 CrossRef.
- L. Ren, D. Chen, Z. Hu, Z. Gao, Z. Luo, Z. Chen, Y. Jiang, B. Zhao, C. M. Lawrence Wu and C.-H. Shek, RSC Adv., 2016, 6, 82096–82102 RSC.
- R. D. Shannon and C. T. Prewitt, Acta Crystallogr., Sect. B: Struct. Crystallogr. Cryst. Chem., 1969, 25, 925–946 CrossRef CAS.
- L. Li, J. Liu, Y. Su, G. Li, X. Chen, X. Qiu and T. Yan, Nanotechnology, 2009, 20, 155706 CrossRef PubMed.
- L. Zheng, C. Chen, Y. Zheng, Y. Zhan, Y. Cao, X. Lin, Q. Zheng, K. Wei and J. Zhu, Appl. Catal., B, 2014, 148–149, 44–50 CrossRef CAS.
- A. Sadollahkhani, I. Kazeminezhad, J. Lu, O. Nur, L. Hultman and M. Willander, RSC Adv., 2014, 4, 36940–36950 RSC.
- Y.-d. Wang, C.-l. Ma, X.-d. Sun and H.-d. Li, Nanotechnology, 2002, 13, 565–569 CrossRef CAS.
- R. Cuscó, E. Alarcón-Lladó, J. Ibáñez, L. Artús, J. Jiménez, B. Wang and M. J. Callahan, Phys. Rev. B: Condens. Matter, 2007, 75, 165202 CrossRef.
- S. Marković, V. Rajić, A. Stanković, L. Veselinović, J. Belošević-Čavor, K. Batalović, N. Abazović, S. D. Škapin and D. Uskoković, Sol. Energy, 2016, 127, 124–135 CrossRef.
- A. Londono-Calderon, F. F. Jurado-Lasso, J. D. Romero-Salazar, N. Jurado-Lasso and J. F. Jurado, J. Nanomater., 2014, 340384 Search PubMed.
- A. Stanković, Z. Stojanović, L. Veselinović, S. D. Škapin, I. Bračko, S. Marković and D. Uskoković, Mater. Sci. Eng., B, 2012, 177, 1038–1045 CrossRef.
- A. Janotti and C. G. Van de Walle, Phys. Rev. B: Condens. Matter Mater. Phys., 2007, 76, 165202 CrossRef.
- I. I. Gontia, M. Baibarac and I. Baltog, Phys. Status Solidi B, 2011, 248, 1494–1498 CrossRef CAS.
- A. B. Djurišić, Y. H. Leung, K. H. Tam, Y. F. Hsu, L. Ding, W. K. Ge, Y. C. Zhong, K. S. Wong, W. K. Chan, H. L. Tam, K. W. Cheah, W. M. Kwok and D. L. Phillips, Nanotechnology, 2007, 18, 095702 CrossRef.
- A. Peleš, V. P. Pavlović, S. Filipović, N. Obradović, L. Mančić, J. Krstić, M. Mitrić, B. Vlahović, G. Rašić, D. Kosanović and V. B. Pavlović, J. Alloys Compd., 2015, 648, 971–979 CrossRef.
- R. Qiu, D. Zhang, Y. Mo, L. Song, E. Brewer, X. Huang and Y. Xiong, J. Hazard. Mater., 2008, 156, 80–85 CrossRef CAS PubMed.
- H. Zeng, G. Duan, Y. Li, S. Yang, X. Xu and W. Cai, Adv. Funct. Mater., 2010, 20, 561–572 CrossRef CAS.
- W. Tian, T. Zhai, C. Zhang, S.-L. Li, X. Wang, F. Liu, D. Liu, X. Cai, K. Tsukagoshi, D. Golberg and Y. Bando, Adv. Mater., 2013, 25, 4625–4630 CrossRef CAS PubMed.
- S. Girish Kumar and K. S. R. Koteswara Rao, RSC Adv., 2015, 5, 3306–3351 RSC.
- M. R. Gholipour, C.-T. Dinh, F. Béland and T.-O. Do, Nanoscale, 2015, 7, 8187–8208 RSC.
- C. H. Ahn, Y. Y. Kim, D. C. Kim, S. Kumar Mohanta and H. K. Cho, J. Appl. Phys., 2009, 105, 013502 CrossRef.
| This journal is © The Royal Society of Chemistry 2017 |