 Open Access Article
Creative Commons Attribution 3.0 Unported Licence
Activity profiles of analog series containing pan assay interference compounds
Erik Gilberg,
Dagmar Stumpfe and
Jürgen Bajorath *
*
Department of Life Science Informatics, B-IT, LIMES Program Unit Chemical Biology and Medicinal Chemistry, Rheinische Friedrich-Wilhelms-Universität, Dahlmannstr. 2, D-53113 Bonn, Germany. E-mail: bajorath@bit.uni-bonn.de
First published on 17th July 2017
Abstract
Activity artifacts in assays present a major problem for biological screening and medicinal chemistry. Such artifacts are often caused by compounds that form aggregates or are reactive under assay conditions. Many pan assay interference compounds (PAINS) have been proposed to cause false-positive assay readouts. PAINS are typically contained as substructures in larger molecules. They are used as computational filters to detect compounds with potential chemical liabilities. Recent studies have shown that molecules containing the same PAINS substructure often have greatly varying hit rates in screening assays. Even the overall most frequently active PAINS substructures are found in compounds that are only rarely active or consistently inactive in many assays they are tested in. These observations suggest that the structural context in which PAINS are presented may play an important role for eliciting false-positive activities. However, this assumption remains to be investigated. Herein, we report the systematic identification of analog series of screening compounds that contain PAINS or exclusively consist of PAINS and the analysis of their activity profiles. Comparison of analogs or different series of analogs containing the same PAINS substructure provides structural context information. For many PAINS, extensively tested series with distinct activity profiles were detected. Furthermore, analogs within the same series often displayed significant differences in hit rates. The analog series reported herein organize PAINS in different structural contexts. Their activity profiles provide many opportunities for experimental follow-up investigations to better understand PAINS characteristics.
Introduction
Activity artifacts in biological screening assays can be caused by compounds that are prone to colloidal aggregation1,2 or that are chemically reactive under assay conditions.3,4 A variety of mechanisms may lead to apparent inhibition and false-positive signals including, among others, fluorescence of small molecules, redox reactivity, or covalent modifications of target proteins.4–6 Compounds with assay interference potential originate from both synthetic and natural sources7 and include molecules that are intensely investigated in pharmaceutical research.8There is no doubt that assay artifacts compromise medicinal chemistry programs and that false-positive activities cumulate in the scientific literature. This situation has triggered community efforts to raise awareness of assay interference.9 Since it often remains unclear if a compound causes an artificial activity signal, careful experimental follow-up studies are required.2,9 One way to proactively address this problem is the search for potential interference compounds that require special attention if they are found to be active in assays.10
In a landmark study, 480 chemical classes have been put forward as candidates for assay interference.3 To these ends, limited numbers of compounds were tested in AlphaScreen assays.3 This set of so-called pan assay interference compounds (PAINS)3 contains many small reactive chemical entities that often occur as substructures in larger molecules. While it cannot be expected that PAINS cover the entire spectrum of possible interference mechanisms, their identification has made it possible to implement substructure filters to flag potential interference compounds,3,10 an important step toward the identification of questionable candidates.
However, the predictive value of PAINS filters has also been called into question, given that for many of the proposed structures only limited experimental support was available.11 In general, although assay artifacts are a problematic issue, excluding any potentially reactive compound from further consideration would not be justifiable scientifically. Overestimating the magnitude of assay interference may lead to disregarding compounds that have desired activities and/or act by novel mechanisms.
Two recent studies, have systematically evaluated the activity of PAINS on the basis of publicly available screening data11,12 and other compound sources.11 Both investigations revealed substantial heterogeneity in PAINS activities and greatly varying hit rates. Furthermore, many rarely active or consistently inactive molecules with PAINS substructures were detected.11,12 While small subsets of PAINS including, for example, quinones, catechols, rhodanines, or Mannich bases often represented highly active compounds, most likely causing artifacts, other classes of PAINS did not display unusual hit rates. Moreover, even the most frequently active PAINS were also found in many consistently inactive compounds. Taken together, these observations indicated that the molecular environment11 or structural context12 in which PAINS are presented might play an important role for their ability to elicit desirable activities or artifacts. However, little has been done so far to address the question how structural embedding might modulate PAINS activity.
Therefore, we have carried out a systematic analysis of analog series containing PAINS, which provide structural context information. Analog series were systematically extracted from screening compounds. For series of extensively assayed PAINS, activity profiles were determined and studied in detail, yielding first insights into structural context-dependent modulation of PAINS actions. The results of our analysis are presented in the following.
Methods and materials
Compound activity data
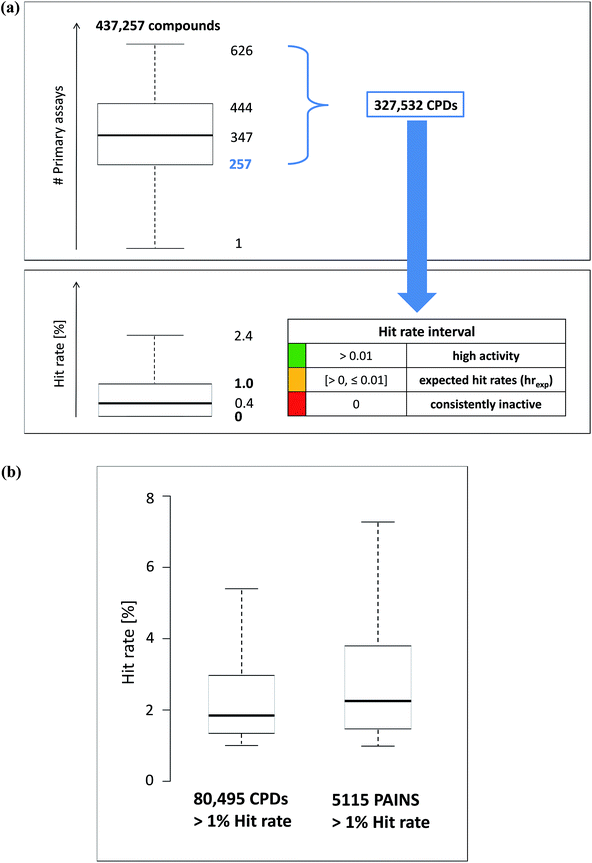
A subset of 437![[thin space (1/6-em)]](https://www.rsc.org/images/entities/char_2009.gif) 257 screening compounds from PubChem BioAssays13 that were tested in primary assays (percentage of inhibition from a single dose) and confirmatory assays (dose–response assays yielding IC50 values)14 provided our starting point. PubChem compounds for which data from both primary and confirmatory assays are available have usually been frequently tested. Hence, most of the pre-selected molecules were evaluated in more than 50 assays. For our analysis, only the most extensively assayed compounds were considered. Therefore, the global distribution of the number of assays in which the pre-selected compounds were tested was determined. Fig. 1a shows this distribution in a boxplot format. PubChem compounds that were tested in more than 257 primary assays, corresponding to the lower quartile boundary of the distribution, were selected for our analysis, yielding a total of 327
257 screening compounds from PubChem BioAssays13 that were tested in primary assays (percentage of inhibition from a single dose) and confirmatory assays (dose–response assays yielding IC50 values)14 provided our starting point. PubChem compounds for which data from both primary and confirmatory assays are available have usually been frequently tested. Hence, most of the pre-selected molecules were evaluated in more than 50 assays. For our analysis, only the most extensively assayed compounds were considered. Therefore, the global distribution of the number of assays in which the pre-selected compounds were tested was determined. Fig. 1a shows this distribution in a boxplot format. PubChem compounds that were tested in more than 257 primary assays, corresponding to the lower quartile boundary of the distribution, were selected for our analysis, yielding a total of 327![[thin space (1/6-em)]](https://www.rsc.org/images/entities/char_2009.gif) 523 compounds.
523 compounds.
Identification of analog series
From these 327![[thin space (1/6-em)]](https://www.rsc.org/images/entities/char_2009.gif) 523 compounds, analog series (ASs) were systematically extracted using a recently developed methodology,15 which is based upon the matched molecular pair (MMP) formalism.16 MMPs are pairs of compounds that are only distinguished by a chemical change at a single site,16 often termed a chemical transformation.17 To generate MMPs, exocyclic single bonds in screening compounds were systematically fragmented following retrosynthetic fragmentation rules,18 yielding RECAP-MMPs.19 Previously established transformation size restrictions were introduced to limit transformations in MMPs to chemical modifications typically observed in analogs.20 Once all possible RECAP-MMPs were generated, a global MMP network was constructed in which compounds were represented as nodes and edges accounted for pairwise MMP relationships. In this network representation, ASs form disjoint (isolated) clusters.15 Each cluster contains all possible MMP relationships within a series, which cover all substitution sites and available R-groups. For 190
523 compounds, analog series (ASs) were systematically extracted using a recently developed methodology,15 which is based upon the matched molecular pair (MMP) formalism.16 MMPs are pairs of compounds that are only distinguished by a chemical change at a single site,16 often termed a chemical transformation.17 To generate MMPs, exocyclic single bonds in screening compounds were systematically fragmented following retrosynthetic fragmentation rules,18 yielding RECAP-MMPs.19 Previously established transformation size restrictions were introduced to limit transformations in MMPs to chemical modifications typically observed in analogs.20 Once all possible RECAP-MMPs were generated, a global MMP network was constructed in which compounds were represented as nodes and edges accounted for pairwise MMP relationships. In this network representation, ASs form disjoint (isolated) clusters.15 Each cluster contains all possible MMP relationships within a series, which cover all substitution sites and available R-groups. For 190![[thin space (1/6-em)]](https://www.rsc.org/images/entities/char_2009.gif) 612 of the 327
612 of the 327![[thin space (1/6-em)]](https://www.rsc.org/images/entities/char_2009.gif) 523 extensively assayed compounds, analog relationships were detected, resulting in the formation of 34
523 extensively assayed compounds, analog relationships were detected, resulting in the formation of 34![[thin space (1/6-em)]](https://www.rsc.org/images/entities/char_2009.gif) 300 individual clusters and ASs.
300 individual clusters and ASs.
For each of the 34![[thin space (1/6-em)]](https://www.rsc.org/images/entities/char_2009.gif) 300 ASs, assay and target information was compiled. For each AS, assay overlap was determined as the number of assays shared by all analogs. In addition, for pairwise comparison of ASs, the overlap was calculated as the number of assays common to both series.
300 ASs, assay and target information was compiled. For each AS, assay overlap was determined as the number of assays shared by all analogs. In addition, for pairwise comparison of ASs, the overlap was calculated as the number of assays common to both series.
Hit rate intervals and activity profiles
The hit rate of a compound was conventionally defined as the fraction of assays in which it was active. The distribution of hit rates over all compounds was captured in a boxplot yielding a median value of 0.4% (Fig. 1a). On the basis of this distribution, the interval of expected hit rates (hrexp) for active PubChem screening compounds was defined as 0% < hrexp ≤ 1.0% covering the lower quartile, median, and upper quartile. Accordingly, hit rates exceeding 1.0% (upper whisker and outliers) were considered high. The lower whisker and lower quartile boundary of the boxplot were identical and represented consistently inactive compounds. Thus, activity profiles were defined on the basis of three hit rate intervals including consistent inactivity (0%), expected or average hit rates (0% < hrexp ≤ 1.0%), and high hit rates (>1.0%) (Fig. 1a). Given that qualifying compounds were tested in at least 258 assays, high hit rates corresponded to activity in a minimum of three assays, while expected hit rates of active compounds corresponded to activity in one or two assays. Hence, as defined, the interval of high rates predominantly focused on promiscuous compounds. Apparent promiscuity might result from true multi-target activities or assay artifacts. The distribution of hit rates exceeding 1.0% was also monitored in boxplots for screening compounds that did not contain PAINS substructures (non-PAINS) and PAINS substructures (Fig. 1b).The activity profile of an AS was then generated by combining hit rates of all participating analogs, as illustrated in Fig. 2.
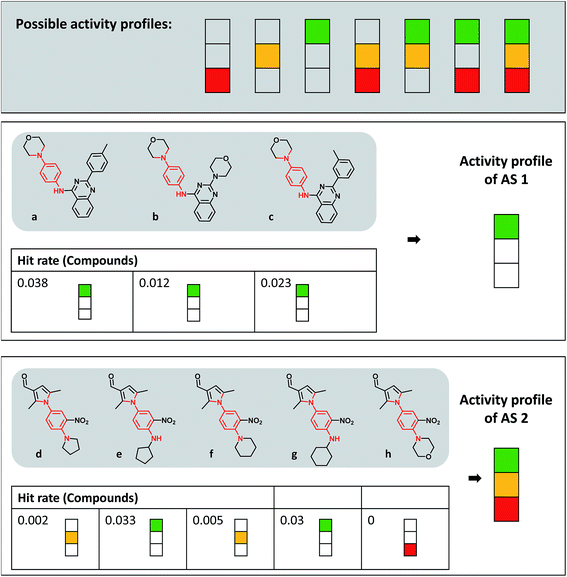 | ||
| Fig. 2 Activity profiles and exemplary analog series. At the top, all possible activity profiles are displayed that represent different combinations of the three hit rate intervals according to Fig. 1a (consistently inactive, red; expected hit rates, yellow; high hit rates, green). Below the profiles, compounds forming two different ASs containing the same PAINS substructure (red) are shown. For each analog, the hit rate and corresponding interval are given and the resulting activity profile of the series is displayed. | ||
Detection of pan assay interference compounds
Analog series were screened in silico for PAINS using three public filters available in ChEMBL (481 substructures),21 RDKit (480),22 and ZINC (480).23 For screening compounds, canonical SMILES representations24 were generated. Compounds were classified as PAINS if a PAINS substructure was detected by at least one of the three filters (considering possible implementation discrepancies of substructure strings). Filtering identified 177 different PAINS substructures in 3473 ASs.All calculations were performed using in-house Java and R scripts with the aid of KNIME25 protocols, the OpenEye26 chemistry toolkit, and RStudio.27
Control calculations
As a control, the analysis was repeated for ASs originating from compounds tested in 65-247 confirmatory assays. In this case, 3459 ASs with PAINS substructures were identified, 1865 of which exclusively consisted of PAINS. The analysis of the activity profiles of this set of series yielded results that were readily comparable to those obtained for ASs originating from primary assays. In the following, we therefore concentrate on the results for ASs from primary assays.Results and discussions
Analog series with PAINS
For 190![[thin space (1/6-em)]](https://www.rsc.org/images/entities/char_2009.gif) 612 of 327
612 of 327![[thin space (1/6-em)]](https://www.rsc.org/images/entities/char_2009.gif) 532 PubChem compounds tested in at least 257 primary assays, analog relationships were identified, yielding a total of 34
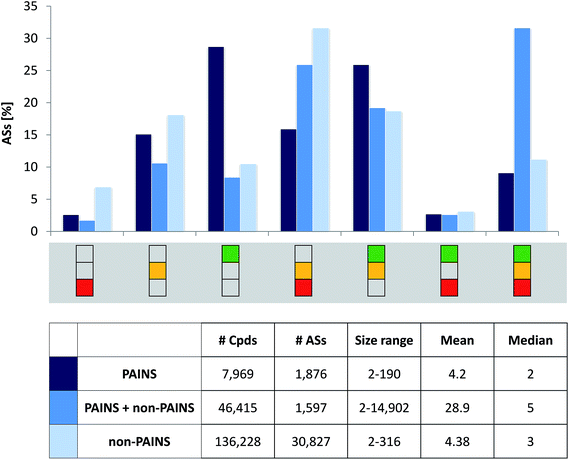
532 PubChem compounds tested in at least 257 primary assays, analog relationships were identified, yielding a total of 34![[thin space (1/6-em)]](https://www.rsc.org/images/entities/char_2009.gif) 300 ASs. Compound and AS statistics are reported in Fig. 3 (bottom). PAINS were detected in 13
300 ASs. Compound and AS statistics are reported in Fig. 3 (bottom). PAINS were detected in 13![[thin space (1/6-em)]](https://www.rsc.org/images/entities/char_2009.gif) 018 compounds from 3473 ASs. More than half of these ASs, i.e. 1876 series comprising 7969 compounds, exclusively consisted of PAINS. These ASs contained two to 190 analogs with on average four PAINS per series. In all ASs with PAINS, 177 of the 480 PAINS substructures were detected. ASs exclusively consisting of PAINS covered 140 different substructures. Furthermore, for 32 PAINS substructures, at least 10 ASs were identified. Thus, overall, a large number of PAINS-containing ASs was available, providing an extensive structural organization of PAINS and a sound basis for our analysis.
018 compounds from 3473 ASs. More than half of these ASs, i.e. 1876 series comprising 7969 compounds, exclusively consisted of PAINS. These ASs contained two to 190 analogs with on average four PAINS per series. In all ASs with PAINS, 177 of the 480 PAINS substructures were detected. ASs exclusively consisting of PAINS covered 140 different substructures. Furthermore, for 32 PAINS substructures, at least 10 ASs were identified. Thus, overall, a large number of PAINS-containing ASs was available, providing an extensive structural organization of PAINS and a sound basis for our analysis.
Targets
For the ASs belonging to the three different categories according to Fig. 3 target statistics were determined. We found that 7.3% of the ASs exclusively consisting of PAINS and 6.9% of ASs comprising PAINS and non-PAINS were only active against a single target (ST-ASs). For ASs only consisting of non-PAINS, the proportion of ST-ASs was 13.6%. Thus, most ASs in all three categories were multi-target ASs (MT-ASs). ST- and MT-ASs exclusively consisting of PAINS were active against a total of 385 unique targets, while ST- and MT-ASs with PAINS and non-PAINS covered 401 targets. In addition, non-PAINS ST- and MT-ASs were active against a total of 418 targets. Thus, target coverage of all three categories of ASs was extensive and comparable in magnitude. Notably, the 1873 ASs only consisting of PAINS were active against nearly as many targets (92.1%) as the ∼16-fold larger number of non-PAINS ASs.Hit rates
Fig. 1a shows the distribution of hit rates of extensively assayed PubChem compounds on the basis of which hit rate intervals were determined, as detailed above. In addition, Fig. 1b compares the distribution of hits rates for those non-PAINS and PAINS having rates exceeding 1.0%. More than 75![[thin space (1/6-em)]](https://www.rsc.org/images/entities/char_2009.gif) 000 non-PAINS had hit rates greater than 1.0% compared to 5115 compounds with PAINS substructures. Thus, 60.7% of all PAINS from ASs (7903 compounds) were consistently inactive or only active in one or two assays. As one would anticipate, within the hit rate interval exceeding 1.0%, PAINS had overall higher hit rates than non-PAINS but the differences were only small. As shown in Fig. 1b, the hit rate distributions were similar for PAINS and non-PAINS, with median values of slightly above and below 2.0%, respectively. Taken together, these observations made for PAINS with analog relationships corroborated earlier findings from global PubChem analysis.11,12 For all ASs with PAINS, activity profiles were generated from their assay data.
000 non-PAINS had hit rates greater than 1.0% compared to 5115 compounds with PAINS substructures. Thus, 60.7% of all PAINS from ASs (7903 compounds) were consistently inactive or only active in one or two assays. As one would anticipate, within the hit rate interval exceeding 1.0%, PAINS had overall higher hit rates than non-PAINS but the differences were only small. As shown in Fig. 1b, the hit rate distributions were similar for PAINS and non-PAINS, with median values of slightly above and below 2.0%, respectively. Taken together, these observations made for PAINS with analog relationships corroborated earlier findings from global PubChem analysis.11,12 For all ASs with PAINS, activity profiles were generated from their assay data.
Activity profiles
Fig. 2 depicts the seven possible activity profiles for ASs that account for hit rate intervals and their combinations. Two exemplary ASs are shown. All analogs belonging to AS 1 were active and had high hit rates, resulting in the ‘green-only’ profile of the series. By contrast, four of five analogs of AS 2 were active and one consistently inactive. Two of the active analogs had high and two others expected hit rates. Thus, the activity profile of the series was the combination of all three intervals (‘green-yellow-red’).Activity profiles were systematically determined for all 34![[thin space (1/6-em)]](https://www.rsc.org/images/entities/char_2009.gif) 300 ASs extracted from extensively assayed PubChem compounds. Therefore, the ASs were divided into three subsets: analogs having no PAINS substructures (30
300 ASs extracted from extensively assayed PubChem compounds. Therefore, the ASs were divided into three subsets: analogs having no PAINS substructures (30![[thin space (1/6-em)]](https://www.rsc.org/images/entities/char_2009.gif) 827 series), analogs with and without PAINS substructures (1597), and analogs always containing PAINS (1876). Fig. 3 reports the distribution of these AS subsets over different activity profiles in a histogram. Consistently inactive ASs (‘red-only’ profile) and ASs containing compounds having high rate rates and inactive analogs (‘green-red’) were rare. By contrast, nearly 30% of ASs exclusively consisting of PAINS displayed the ‘green-only’ (high hit rate) profile, which was a much larger proportion than obtained for the other two AS subsets (with close to 10%). Essentially inverse proportions were observed for ASs containing consistently inactive as well as active compounds with expected hit rates (‘yellow-red’). Furthermore, more than 30% of ASs with non-PAINS and PAINS yielded the complete (‘green-yellow-red’) activity profile. Hence, these series contained analogs covering all hit rate intervals. Notably, about 55% of ASs exclusively consisting of PAINS yielded activity profiles covering multiple hit rate intervals, revealing that analogs with a given PAINS substructure often had different activities.
827 series), analogs with and without PAINS substructures (1597), and analogs always containing PAINS (1876). Fig. 3 reports the distribution of these AS subsets over different activity profiles in a histogram. Consistently inactive ASs (‘red-only’ profile) and ASs containing compounds having high rate rates and inactive analogs (‘green-red’) were rare. By contrast, nearly 30% of ASs exclusively consisting of PAINS displayed the ‘green-only’ (high hit rate) profile, which was a much larger proportion than obtained for the other two AS subsets (with close to 10%). Essentially inverse proportions were observed for ASs containing consistently inactive as well as active compounds with expected hit rates (‘yellow-red’). Furthermore, more than 30% of ASs with non-PAINS and PAINS yielded the complete (‘green-yellow-red’) activity profile. Hence, these series contained analogs covering all hit rate intervals. Notably, about 55% of ASs exclusively consisting of PAINS yielded activity profiles covering multiple hit rate intervals, revealing that analogs with a given PAINS substructure often had different activities.
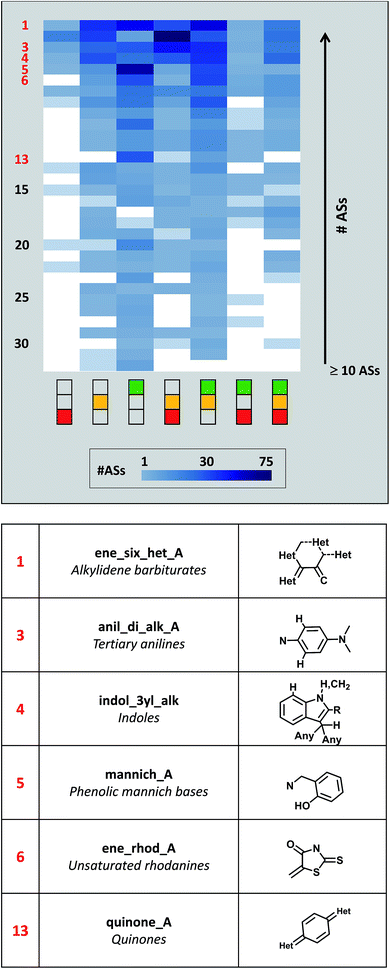
Fig. 4 shows the distribution of activity profiles for 32 PAINS for which 10 or more ASs were available that exclusively contained this PAINS substructure. Thus, this subset of PAINS was most frequently found in ASs. It included widely recognized PAINS such as anilines, rhodanines, or quinones.4 The heatmap reveals the prevalence of the ‘green-only’ and ‘green-yellow’ profiles among the ASs of this subset of PAINS. However, the heatmap also shows that activity profiles were variably distributed across ASs with different PAINS. For example, the ‘yellow-red’ and complete activity profiles were also frequently observed. Hence, prevalent PAINS also displayed varying activities in ASs.
Context-dependent structure–activity relationships
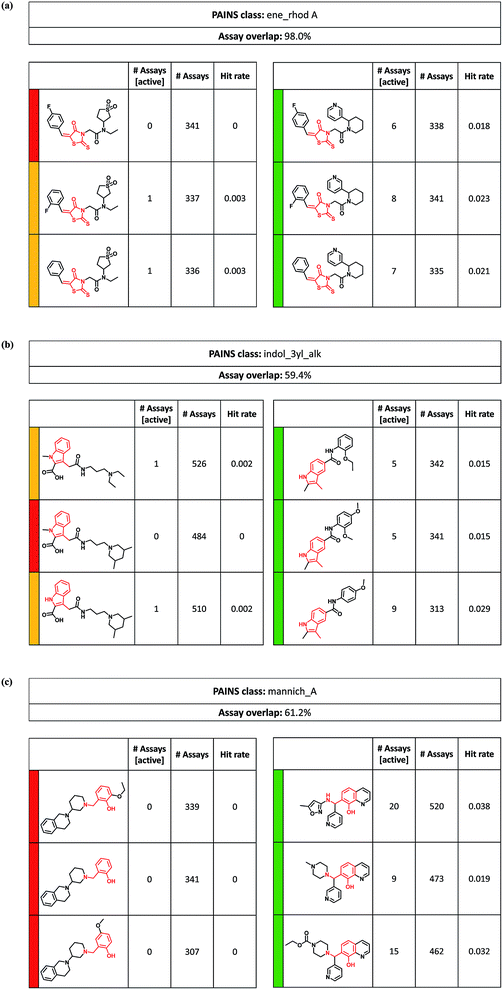
The ASs containing PAINS substructures provided a series-based organization and reference frame for analyzing and comparing the activity of PAINS in different structural environments. A variety of interesting and in part puzzling relationships was observed.Fig. 5a compares two rhodanine-based series with distinct hit rates and activity profiles. These ASs were tested in more than 300 assays with an assay overlap of 98%. Compounds forming the series on the left were at most active in a single assay, whereas compounds in the series on the right were active in six to eight assays. Both ASs shared a 5-phenylmethylen-3-rhodanine acetamide substructure that was modified at the nitrogen of the acetamide. Analogs in the series on the left had a tetrahydrothiophene-1,1-dioxide substituent in common, while the frequently active compounds in the ASs on the right shared a 2-(3-pyridinyl)-piperidine. Biologically relevant reactivities of rhodanines and related heterocycles have been intensely investigated and several plausible mechanisms of action have been proposed.28 Often considered is a Michael addition via the exocyclic double bond.29 In this case, observed differences in activity could not be attributed to a Michael-type reaction because the same rhodanine derivative occurred in both ASs. Instead, possible photochemical30 or hydrolytic31 reactivity might be modulated by different substituents at the acetamide.
Fig. 5b depicts two ASs sharing a 3-methyl-indole core. Similar to the previous example, analogs forming the series on the left were only active in at most one assay, while analogs of the series on the right were active in five to nine assays. This was the case although the AS on the left was more extensively tested than the one on the right (in more than 500 vs. 300 assays). Different from the previous example, substitution patterns were more diverse here. Baell et al. discussed that 3-alkylindoles and indole-3-acetamide-2-carboxylic acids likely act as Michael acceptors and thereby cause artifacts.3 However, in this case, the rarely active analogs in the ASs on the left contained a carboxylic acid function, which was replaced by a methyl group in the frequently active series on the right. Thus, the activity profiles of these ASs were opposite to expectations considering potential Michael acceptor reactivity.
Fig. 5c compares two series of 2-hydroxybenzylamine derivatives, one of which was consistently inactive in many assays (left), whereas analogs forming the other (right) were active in nine, 15, and 20 assays, respectively. Such high hit rates are likely to involve artifacts. The 2-hydroxybenzylamines may act as Mannich bases and elicit undesired activities by forming reactive quinone methides32 or by chelating metal ions.33 However, the striking difference in activity between these two ASs was not straightforward to rationalize. Notably, the 2-hydroxybenzylamine moiety in the series on the left was located at the terminus of the analogs, whereas it was fused with a pyridine ring in the compounds on the right and, in addition, bound to two other rings. Thus, the structural context in which the PAINS substructure was presented in these two ASs was distinct and one may hypothesize that a more or less constrained structural environment affects Mannich base reactivity.
In addition to comparing different ASs containing the same PAINS, it is also informative to analyze individual series with different activity profiles. For example, Fig. 6a shows a series of alkylidene thiobarbiturates with varying hit rates. Here, replacement of a 1-methyl-pyrrol with a 3-pyridinmethanamine group greatly reduced hit rates or completely abolished activity. In addition, replacing the aromatic (4-fluorophenyl)-methyl substituent with increasingly aliphatic moieties might also contributed to a loss in activity. Hence, on the basis of these observations, several experimentally testable hypotheses can be formulated.
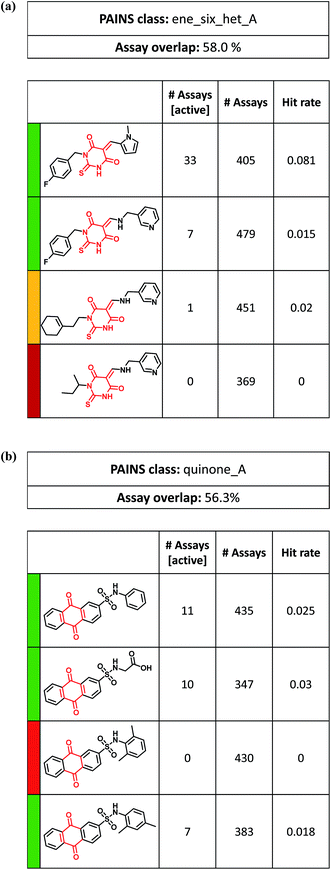 | ||
| Fig. 6 Analog series with PAINS having large variations in hit rates. Exemplary ASs are shown in which compounds display significantly different hit rates. The representation is according to Fig. 5. (a) Alkylidene thiobarbiturates, (b) quinone derivatives. | ||
Fig. 6b depicts an AS of 9,10-dihydro-9,10-dioxo-2-anthracenesulfonamides containing a quinone substructure, a notorious PAINS4 with one of the highest hit rates overall. However, in this AS having an unusual ‘green-red’ activity profile, one of the analogs was found to be consistently inactive in 430 assays. Compared to a closely related compound with activity in seven assays, the only modification was a para-to-ortho repositioning of methyl substituents at the phenyl moiety; a puzzling observation.
So far, only ASs exclusively consisting of PAINS were considered. However, series containing analogs with and without PAINS substructures also revealed interesting relationships. For example, Fig. 7a shows an ASs with a ‘red-only’ activity profile in which consistently inactive analogs contained a 1,4-diphenyl-2,6-piperidinedione core. Three of four analogs had different phenyl derivatives as substituents at the 2,6-piperidinedione nitrogen. Replacement of these groups with a N,N-dimethylaniline PAINS substructure also produced a completely inactive analog, although several likely interference mechanisms were proposed for tertiary anilines.34 Thus, in this case, the 1,4-diphenyl-2,6-piperidinedione core restricted possible reactivity of different substituents.
 | ||
| Fig. 7 Analog series comprising PAINS and non-PAINS. Examples of ‘mixed’ ASs are shown that consist of compounds with and without PAINS substructures (red). The representation is according to Fig. 5. PAINS include (a) tertiary anilines, (b) amino imidazoles, and (c) phenolic Mannich bases. | ||
Fig. 7b shows an ASs with a ‘green-only’ activity profile containing different amino imidazole derivatives, only one of which was a PAINS substructure. However, all analogs were active in seven to nine assays. Finally, Fig. 7c depicts an AS with three compounds containing a phenolic Mannich base that were active in 19 or 25 assays. In a fourth analog, methylation of the phenolic hydroxyl group of the Mannich base led to consistent inactivity. The only caveat in interpreting these results was that the inactive analog was tested in 268 assays, while the remaining active compounds were tested in more than 400 or 500 assays (mostly including the 268 assays). Thus, these differences in assay frequency might influence hit rates. Nonetheless, analysis of this series immediately provides the experimentally testable hypothesis that methylation of the reactive phenolic hydroxyl might ‘disable’ this PAINS structure. Many other ASs including PAINS are available to explore the dependence of assay interference on the structural context in which PAINS are presented.
Conclusions
In this work, we have systematically extracted ASs with PAINS substructures from extensively assayed compounds, analyzed their activity profiles, and explored structure–activity relationships. These ASs provided an organization of PAINS according to varying structural contexts and a reference frame for studying PAINS actions in different environments. A number of instructive examples have been identified, providing first insights into the structural context dependence of PAINS activities. As a part of our study, all ASs containing PAINS are made freely available (in an open access deposition referring to this work) to aid in theoretical and experimental follow-up investigations to further explore PAINS characteristics and the influence of structural embedding.35Conflict of interest
There are no conflicts of interest to declare.Acknowledgements
The use of OpenEye's toolkits was made possible by their free academic licensing program. D. S. is supported by Sonderforschungsbereich 704 of the Deutsche Forschungsgemeinschaft.References
- S. L. McGovern, E. Caselli, N. A. Grigorieff and B. K. Shoichet, J. Med. Chem., 1996, 45, 1712–1722 CrossRef.
- B. K. Shoichet, Drug Discovery Today, 2006, 11, 607–615 CrossRef CAS PubMed.
- J. B. Baell and G. A. Holloway, J. Med. Chem., 2010, 53, 2719–2740 CrossRef CAS PubMed.
- J. Baell and M. A. Walters, Nature, 2014, 513, 481–483 CrossRef CAS PubMed.
- J. L. Dahlin, J. W. Nissink, J. M. Strasser, S. Francis, L. Higgins, H. Zhou, Z. Zhang and M. A. Walters, J. Med. Chem., 2015, 58, 2091–2113 CrossRef CAS PubMed.
- E. Gilberg, S. Jasial, D. Stumpfe, D. Dimova and J. Bajorath, J. Med. Chem., 2016, 59, 10285–10290 CrossRef CAS PubMed.
- J. Bisson, J. B. McAlpine, J. B. Friesen, S. N. Chen, J. Graham and G. F. Pauli, J. Med. Chem., 2016, 59, 1671–1690 CrossRef CAS PubMed.
- K. M. Nelson, J. L. Dahlin, J. Bisson, J. Graham, G. F. Pauli and M. A. Walters, J. Med. Chem., 2017, 60, 1620–1637 CrossRef CAS PubMed.
- C. Aldrich, C. Bertozzi, G. I. Georg, L. Kiessling, C. Lindsley, D. Liotta, K. M. Merz Jr, A. Schepartz and S. Wang, ACS Cent. Sci., 2017, 3, 143–147 CrossRef CAS PubMed.
- S. Saubern, R. Guha and J. B. Baell, Mol. Inf., 2011, 30, 847–850 CrossRef CAS PubMed.
- S. J. Capuzzi, E. N. Muratov and A. Tropsha, J. Chem. Inf. Model., 2017, 57, 417–427 CrossRef CAS PubMed.
- S. Jasial, Y. Hu and J. Bajorath, J. Med. Chem., 2017, 60, 3879–3886 CrossRef CAS PubMed.
- Y. Wang, J. Xiao, T. O. Suzek, J. Zhang, J. Wang, Z. Zhou, L. Han, K. Karapetyan, S. Dracheva, B. A. Shoemaker, E. Bolton, A. Gindulyte and S. H. Bryant, Nucleic Acids Res., 2012, 40, D400–D412 CrossRef CAS PubMed.
- S. Jasial, Y. Hu and J. Bajorath, PLoS One, 2016, 11, e0153873 Search PubMed.
- D. Stumpfe, D. Dimova and J. Bajorath, J. Med. Chem., 2016, 59, 7667–7676 CrossRef CAS PubMed.
- E. Griffen, A. G. Leach, G. R. Robb and D. J. Warner, J. Med. Chem., 2011, 54, 7739–7750 CrossRef CAS PubMed.
- X. Q. Lewell, D. B. Judd, S. P. Watson and M. M. Hann, J. Chem. Inf. Comput. Sci., 1998, 38, 511–522 CrossRef CAS PubMed.
- A. de la Vega de León and J. Bajorath, MedChemComm, 2014, 5, 64–67 RSC.
- J. Hussain and C. Rea, J. Chem. Inf. Model., 2010, 50, 339–348 CrossRef CAS PubMed.
- X. Hu, Y. Hu, M. Vogt, D. Stumpfe and J. Bajorath, J. Chem. Inf. Model., 2012, 52, 1138–1145 CrossRef CAS PubMed.
- A. Gaulton, L. J. Bellis, A. P. Bento, J. Chambers, M. Davies, A. Hersey, Y. Light, S. McGlinchey, D. Michalovich, B. Al-Lazikani and J. P. Overington, Nucleic Acids Res., 2012, 40, D1100–D1107 CrossRef CAS PubMed.
- . RDKit: Cheminformatics and Machine Learning Software, 2013, http://www.rdkit.org Search PubMed.
- T. Sterling and J. J. Irwin, J. Chem. Inf. Model., 2015, 55, 2324–2337 CrossRef CAS PubMed.
- D. Weininger, J. Chem. Inf. Comput. Sci., 1988, 28, 31–36 CrossRef CAS.
- M. R. Berthold, N. Cebron, F. Dill, T. R. Gabriel, T. Kötter, T. Meinl, P. Ohl, C. Sieb, K. Thiel and B. Wiswedel, KNIME: The Konstanz Information Miner, in Studies in Classification, Data Analysis, and Knowledge Organization, ed. C. Preisach, H. Burkhardt, L. Schmidt-Thieme and R. Decker, Springer, Berlin, Germany, 2008, pp. 319–326 Search PubMed.
- OEChem TK, OpenEye Scientific Software, Inc., Santa Fe, NM, U.S., 2012 Search PubMed.
- RStudio: Integrated Development Environment for R, RStudio, Inc., Boston, MA, 2016 Search PubMed.
- T. Mendgen, C. Steuer and C. D. Klein, J. Med. Chem., 2012, 55, 743–753 CrossRef CAS PubMed.
- J. P. Powers, D. E. Piper, Y. Li, V. Mayorga, J. Anzola, J. M. Chen, J. C. Jaen, G. Lee, J. Liu, M. G. Peterson, G. R. Tonn, Q. Ye, N. P. C. Walker and Z. Wang, J. Med. Chem., 2006, 49, 1034–1046 CrossRef CAS PubMed.
- M. E. Voss, P. H. Carter, A. J. Tebben, P. A. Scherle, G. D. Brown, L. A. Thompson, M. Xu, Y. C. Lo, G. Yang, R. Liu, J. Strzemienski and G. Everlof, Bioorg. Med. Chem. Lett., 2003, 13, 533–538 CrossRef CAS PubMed.
- J. Brem, S. S. van Berkel, W. Aik, A. M. Rydzik, M. B. Avison, I. Pettinati, K. Umland, A. Kawamura, J. Spencer, T. D. W. Claridge, M. A. McDonough and C. J. Schofield, Nat. Chem., 2014, 6, 1084–1090 CrossRef CAS PubMed.
- Y. Herzig, L. Lerman, W. Goldenberg, D. Lerner, H. E. Gottlieb and H. E. Nudelman, J. Org. Chem., 2006, 71, 4130–4140 CrossRef CAS PubMed.
- M. J. Caulfield, D. J. McAllister, T. Russo and D. H. Solomon, Aust. J. Chem., 2001, 54, 383–389 CrossRef CAS.
- R. H. Young, D. Brewer, R. Kayser, R. Martin, D. Feriozi and R. A. Keller, Can. J. Chem., 1974, 52, 2889–2893 CrossRef CAS.
- http://zenodo.org/, data release upon publication.
| This journal is © The Royal Society of Chemistry 2017 |

