
 Open Access Article
 This Open Access Article is licensed under a
 Creative Commons Attribution 3.0 Unported Licence
Metabolic profiling of myrislignan by UPLC-ESI-QTOFMS-based metabolomics
Xiao-Nan Yang†
a,
Qian-Qian Lv†ab,
Qi Zhaoac,
Xin-Mei Lia,
Dong-Mei Yan*d,
Xiu-Wei Yange and
Fei Li *a
*a
aState Key Laboratory of Phytochemistry and Plant Resources in West China, Kunming Institute of Botany, Chinese Academy of Sciences, Kunming 650201, China. E-mail: lifeib@mail.kib.ac.cn; Tel: +86-871-65216953
bResearch Center for Differentiation and Development of Basic Theory of Traditional Chinese Medicine, Jiangxi University of Traditional Chinese Medicine, Nanchang 330004, China
cUniversity of Chinese Academy of Sciences, Beijing 100049, China
dSchool of Pharmacy, Jiangxi University of Traditional Chinese Medicine, Nanchang 330004, China. E-mail: yanli1999@163.com; Tel: +86-791-87118995
eSchool of Pharmaceutical Sciences, Peking University Health Science Center, Peking University, Beijing 100191, China
First published on 16th August 2017
Abstract
Myrislignan (MRL) is a bioactive 8-O-4′-neolignan distributed in nutmeg that is an official Traditional Chinese Medicine used for the treatment of gastrointestinal diseases in China. In the present study, the metabolic map of MRL was determined in mouse by ultra-performance chromatography electrospray ionization quadrupole time-of-flight mass spectrometry (UPLC-ESI-QTOFMS)-based metabolomics. A total of 23 MRL metabolites (19 were newly identified) were determined in both in vivo and in vitro metabolism of MRL. It was found that hydroxylation and demethylation were the major metabolic pathways for MRL metabolism in vitro and in vivo, respectively. Recombinant cytochrome P450s (CYPs) screening revealed that CYP3A4 and CYP3A5 played a crucial role in the metabolism of MRL. Interestingly, MRL and its metabolites were prone to generate the high abundance ions of Na+ adducts due to one 8-O-4′ type bond in their molecular structures. Taken together, these data reveal the metabolic map of MRL, contributing to the understanding of the metabolism and disposition of 8-O-4′-neolignans in nutmeg.
Introduction
Lignans are natural polyphenolic compounds found in plants, which are commonly derived from two molecules of phenylpropanoids via dimerization of monolignols to a dibenzylbutane skeleton. Generally, the plant lignans are two phenylpropanoid units linked by a bond connect to each central (8–8′) carbon atom of the side chain,1 however, the two phenylpropanoid units are joined to other carbon atom in neolignans.2 Studies revealed that lignans possess anticancer, antimicrobial, antiviral, anti-fungal and antiatherosclerotic effects.3 Additionally, lignans can suppress lipid peroxidation and free radical-mediated process, and show antioxidant activity.4Nutmeg is the dried seed of Myristica fragrans Houtt. which contains lignans and neolignans.5 Nutmeg has been used as folk medicine for treatment of rheumatic disorders,6 hyperglycaemia, hyperlipidaemia,7 diarrhea,8 flatulence9 and toxoplasmosis10 for a long time. Many lignan and neolignan compounds have been isolated and identified from nutmeg11. Myrislignan (MRL), erythro-(1R,2S)-2-(4-allyl-2,6-dimethoxyphenoxyl)-1-(4-hydroxy-3-methoxyphenyl)propan-1-ol, is a major and representative 8-O-4′-neolignan in nutmeg (Fig. 1). Studies have demonstrated the MRL may affect hepatic mixed function oxidase enzyme activity.12 It also exhibits multiple biological activities, including the decrease of lipopolysaccharide-induced nitric oxide production,13 inhibition of vascular smooth muscle contraction14 and antifungal properties.15 Using Caco-2 cell monolayer model revealed that 8-O-4′-neolignans have high permeability in the intestine.16 Pharmacokinetics, distribution, and metabolism of MRL in the rats have been investigated.17,18 Seven metabolites of MRL have been identified following the incubation with rat liver microsome.19 There are limited studies to determine its in vivo metabolism and which cytochrome P450s (CYPs) are involved in MRL metabolism. Metabolic profiling of the major components is important to explain the efficacy of Traditional Chinese Medicine and predict its toxicity. Therefore, a more sensitive and efficient approach used to determine the metabolic map of MRL is required.
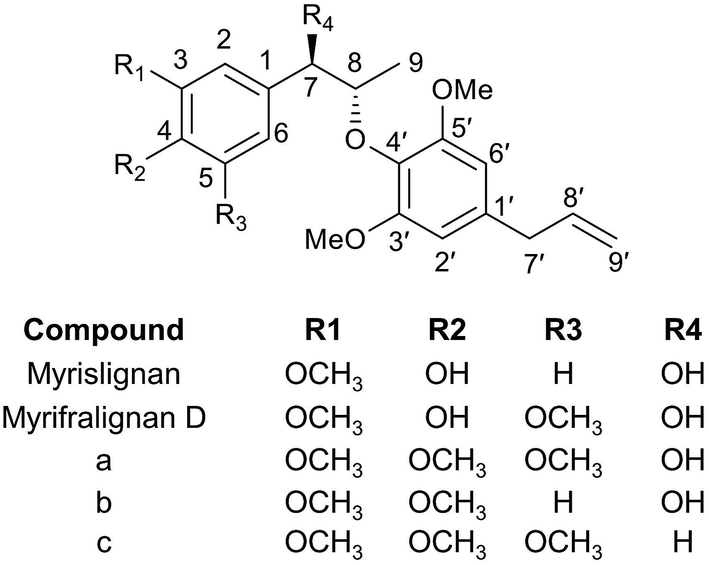 | ||
| Fig. 1 Chemical structures of typical 8-O-4′-neolignans in nutmeg. (a) erythro-2-(4-Allyl-2,6-dimethoxyphenoxy)-1-(3,4,5-trimethoxyphenyl)propan-1-ol; (b) erythro-2-(4-allyl-2,6-dimethoxyphenoxy)-1-(3,4-dimethoxyphenyl)propan-1-ol; (c) erythro-2-(4-allyl-2,6-dimethoxyphenoxy)-1-(3,4,5-trimethoxyphenyl)propan. | ||
Ultra-performance chromatography electrospray ionization quadrupole time-of-flight mass spectrometry (UPLC-ESI-QTOFMS)-based metabolomics has been widely used for the comprehensive profiling of xenobiotic metabolism. Due to its high sensitivity and selectivity, the metabolic behaviors of many clinical drugs including procainamide,20 gefitinib,21 and noscapine22 have been determined by UPLC-ESI-QTOFMS-based metabolomics, yielding new insights on their efficacy and side-effects. Using this powerful technology, the metabolic maps of many bioactive natural compounds have been described, such as arecoline23 and osthole.24 The aims of the present study were performed by metabolomics approach based on UPLC-ESI-QTOFMS, and (i) to identify the metabolites of MRL in vivo and in vitro; (ii) to determine the drug-metabolizing enzymes involved in MRL metabolism; (iii) to draw the metabolic map of MRL. These results reveal the metabolism and disposition of MRL following its exposure to the human and animal.
Experimental
Chemicals and reagents
MRL was purchased from Beta Biotechnology Co., Ltd (Nanchang, China). NADPH, chlorpropamide, and formic acid were obtained from Sigma-Aldrich (St. Louis, MO, USA). Mouse liver microsome (MLM) and human liver microsome (HLM) for in vitro metabolism were provided by Bioreclamationivt Inc. (Hicksville, NY, USA). Recombinant human CYPs were purchased from Xenotech, LLC (Kansas City, KS, USA). All other reagents were of analytical grade or chromatographically pure when appropriate.Animal experiment and biological samples preparation
C57BL/6 mice (6–7 weeks, 20–22 g) were provided by Slaccas Laboratory Animal Co., LTD. (Hunan, China). The animals were acclimatized to the facilities for 1 week in a room at 23 ± 1 °C with a light/dark cycle of 12/12 h and humidity 50–60%. Sterile tap water and standard rodent chow were allowed ad libitum. Then the mice were randomly divided into two groups with four animals in each group. MRL was suspended in 0.5% sodium carboxymethylcellulose (CMC-Na). One group of animals was administered by intragastrically with 200 mg kg−1 of MRL, and another group of animals received 0.5% CMC-Na used as the control group. The animals were immediately put in metabolism cages individually after treatments. Urine and feces were collected for a period of 0–24 h. Samples were stored at −80 °C until analysis. Animals were maintained in accordance with the guidelines of the Chinese Academy of Sciences, Kunming, China, and approved by the institutional ethical committee (IEC) of Kunming Institute of Botany.Samples preparation were carried out according to the report of Zhao, et al.24 Urine samples were prepared by adding 20 μL of urine into 180 μL of 50% aqueous acetonitrile containing 5 μM of chlorpropamide as the internal standard. After vortexing for 1 min, the urine samples were centrifuged at 18![[thin space (1/6-em)]](https://www.rsc.org/images/entities/char_2009.gif) 000g for 20 min to remove proteins and particulates. For feces samples, 20 mg of feces were homogenized with 10 fold of 50% aqueous acetonitrile, and shaken at room temperature for 20 min. The samples were centrifuged at 18000g for 20 min. Subsequently, 100 μL of each supernatant from feces sample was transferred to a new Eppendorf tube and diluted with 200 μL of 50% aqueous acetonitrile containing 5 μM chlorpropamide. The diluted solutions were again centrifuged at 18000g for 20 min. A 5 μL aliquot of each sample was injected for UPLC-ESI-QTOFMS analysis to identify the potential metabolites of MRL.
000g for 20 min to remove proteins and particulates. For feces samples, 20 mg of feces were homogenized with 10 fold of 50% aqueous acetonitrile, and shaken at room temperature for 20 min. The samples were centrifuged at 18000g for 20 min. Subsequently, 100 μL of each supernatant from feces sample was transferred to a new Eppendorf tube and diluted with 200 μL of 50% aqueous acetonitrile containing 5 μM chlorpropamide. The diluted solutions were again centrifuged at 18000g for 20 min. A 5 μL aliquot of each sample was injected for UPLC-ESI-QTOFMS analysis to identify the potential metabolites of MRL.
In vitro metabolism of MRL
The metabolism of MRL in vitro was conducted in 96 wells plate. Briefly, 180 μL of incubation system contained 50 mM of MRL, 0.5 g mL−1 of MLM or HLM or 2 pmol mL−1 of each c-DNA-expressed CYPs (control, CYP1A1, 1A2, 1B1, 2A6, 2B6, 2C19, 2C8, 2C9, 2D6, 2E1, 3A4, 3A5, and 4A11) was pre-incubated at 37 °C for 5 min. After that, the reaction was initiated by adding 20 μL of NADPH (10 mM) into the system. The absence of NADPH in system was incubated separately as vehicle control. Incubations were carried out at 37 °C and 800 rpm for 40 min in a MicBio II incubator (Abson). After incubation, each liquid was transferred to 1.5 mL centrifuge tube, and then reactions were completed by adding 200 μL of ice cold acetonitrile. The solution was followed by centrifuged at 18000g for 20 min at 4 °C, and 5 μL aliquot of the supernatant was prepared for UPLC-ESI-QTOFMS injection. The incubations were conducted in triplicates.
UPLC-ESI-QTOFMS analysis
Chromatographic analysis was performed on an Agilent 1290 Series (Agilent, Santa Clara, CA, USA) UPLC system equipped with a 1290 Quat Pump, a thermostatically controlled column apartment and an auto plate sampler. MRL and its metabolites were separated by an XDB-C18 column (2.1 × 100 mm, 1.8 μm, Agilent, Santa Clara, CA, USA) at 45 °C. The mobile phase consisted of A, 0.01% of formic acid in water and B, 0.01% of formic acid in acetonitrile. Gradient elution of 2–98% B from 0 to 12 min, 98% B from 12 to 14 min and 2% B from 14 to 16 min was used for metabolites separation. Data were collected in positive mode by the electrospray ionization 6530 QTOFMS (Agilent, Santa Clara, CA, USA). Nitrogen was used as collision gas and drying gas (9 L min−1) which was set at 350 °C. The nebulizer pressure was kept at 35 psi, and 3.5 kV was set for capillary voltage. Chlorpropamide (5 μM) was used as the internal standard.Identification of xenobiotic metabolites
The identification and confirmation of xenobiotic metabolites (MRL metabolites) were performed according the previous descriptions.20,22 The xenobiotic metabolites were presumed and preliminary determined by OPLS-DA analysis. Tandem MS of selected metabolites was carried out in the targeted mode by collision energy of 20 eV. The chemical structures of MRL metabolites were deduced based on their MS/MS fragmentation patterns. Mass error based on the elemental compositions of each metabolite was calculated by Seven Golden Rules.25Data analysis
Chromatographic and spectral data were acquired by MassHunter Workstation data Acquisition software (Agilent, Santa Clara, CA, USA). Mass Profiler Professional software (Agilent, Santa Clara, CA, USA) was used for data alignment, and to generate a data matrix containing peak areas corresponding to a sample ID, unique m/z and retention time. Then the generated data matrix was further introduced to SIMCA-P+13.0 software (Umetrics, Kinnelon, NJ, USA) for principal component analysis (PCA) and orthogonal projection to latent structures-discriminant analysis (OPLS-DA). Potential metabolites of MRL were initially identified by analyzing the ions contributing to the separation from control group in the S-plot of OPLS-DA. In vivo analysis, the relative abundance was evaluated based on the peak areas of ion counts and normalized by the peak area of internal standard. In vitro analysis, the sum of peak areas of total detected ion counts was integrated as 100%. The values of experiments were presented as mean ± SEM. Statistical analysis was performed by using Prism v. 6 (GraphPad Software, San Diego, CA, USA).Results
Metabolomics profiling of MRL metabolites in vivo and in vitro
The in vivo metabolism of MRL was conducted in C57BL/6 mice. Due to the weak signal of MRL in ESI− mode, the metabolites in urine and feces of MRL were analyzed by UPLC-ESI-QTOFMS in the full scan ESI+ mode. The MRL treatment group was well separated from vehicle group by both PCA and OPLS-DA models (Fig. 2A and B). To better determine the metabolites of MRL, the loadings scatter S-plot was conducted to the separation of exogenous metabolites in urine samples (Fig. 2C).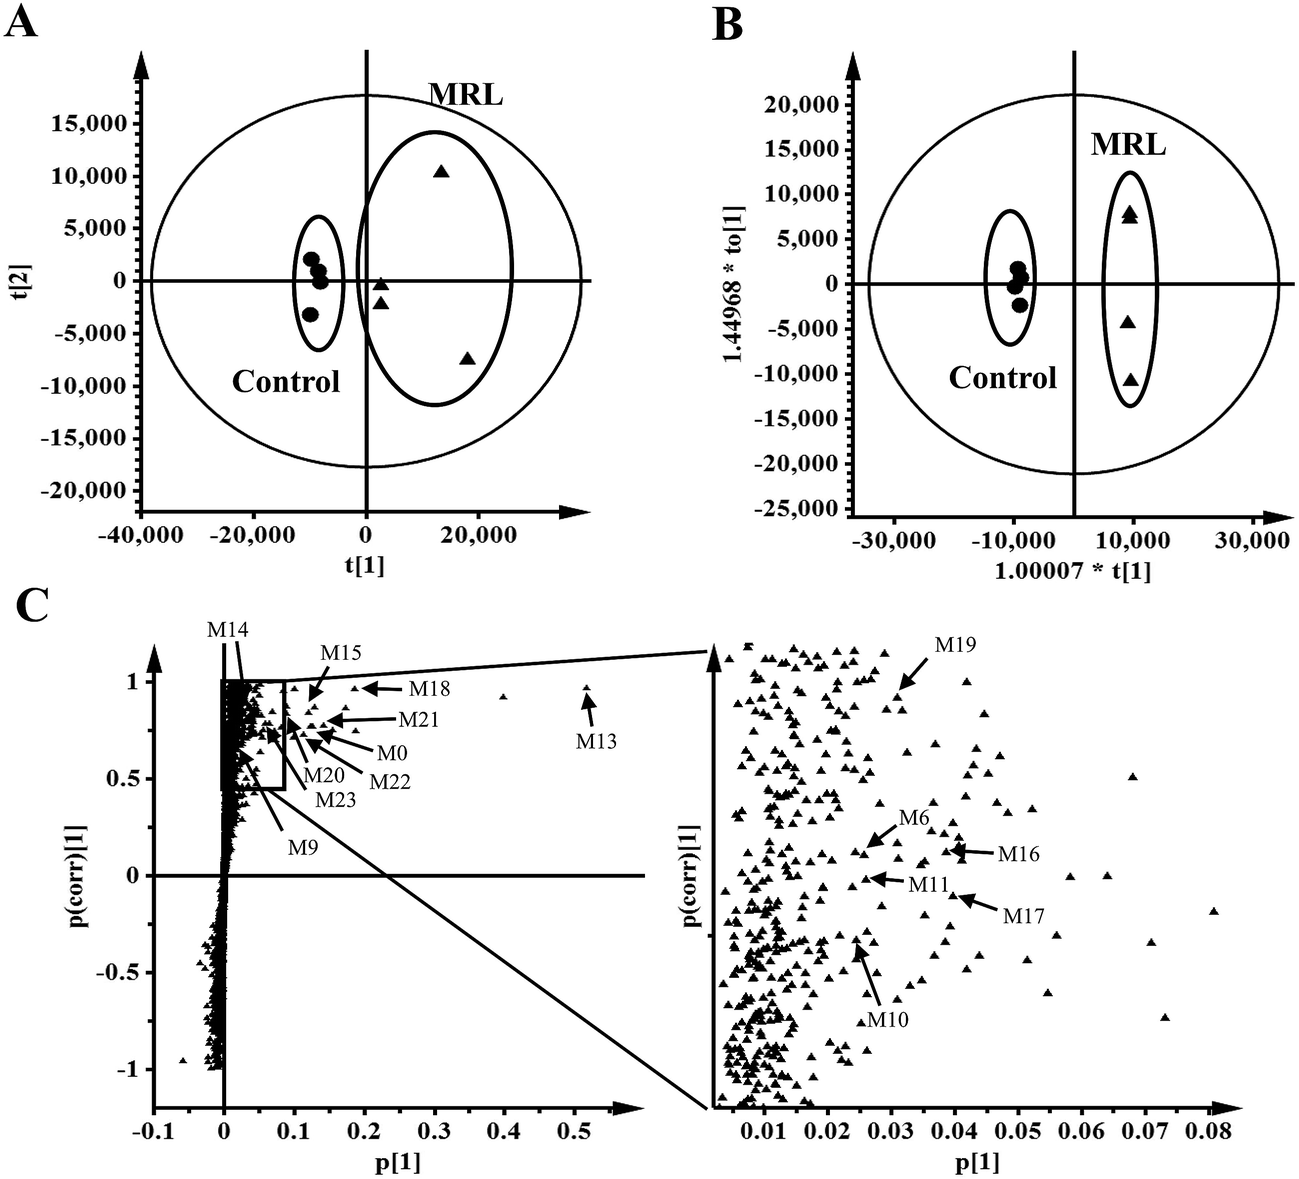 | ||
| Fig. 2 Metabolomics analysis of MRL metabolites in mouse urine. (A) Scores scatter plot of PCA model to characterize control group of mice (without MRL) and MRL-treated mice (200 mg kg−1). (B) Analysis of control and MRL-treated mice urine by OPLS-DA score plots (●, vehicle-treated mice in score plots; ▲, MRL-treated mice in score plots). (C) OPLS loading S-plot. In PCA scores plot, the t[1] and t[2] correspond to principal components 1 and 2, respectively. In the OPLS-DA scores plot, the t[1] and to[1] values represent the score of each sample in principal component 1 and 2. The p(corr)[1] and p[1] values in S-plot represent the interclass difference and the relevant abundance of ions, respectively. Metabolites are labeled in S-plot. | ||
Total four phase I metabolites of MRL were determine from urine sample including M6, M9, M10 and M11, and parent MRL also existed in urine. Eleven phase II metabolites of MRL (M13–M23) were detected in urine sample. Most of these metabolites were the glucuronide adducts of phase I metabolites (M13–M22), and M23 was a sulfated product of parent MRL (Fig. 3A). Only three metabolites (M9, M10 and M11) with parent MRL were found from feces sample (Fig. 3A). All of these metabolites were identified as the new metabolites of MRL. Combined the metabolites generated from the same type of metabolic reaction, demethylation was found to be the major metabolic reaction of MRL revealed by the total relative abundance of demethylated metabolites and demethylation followed by glucuronidated metabolites was the highest (Fig. 3B). The observed m/z coupled with major fragment ions, retention time, mass error, molecular formula and the source of the metabolites are listed in Table 1.
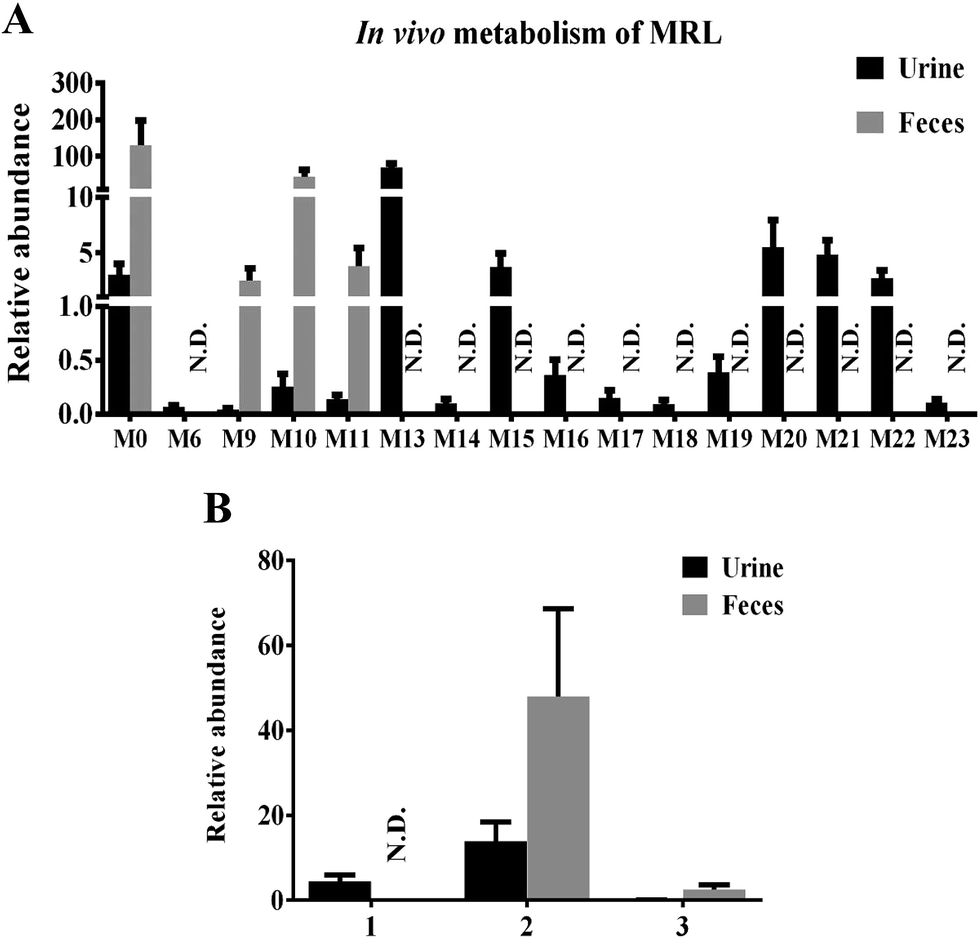 | ||
| Fig. 3 Excretion of MRL metabolites in mouse urine and feces. (A) Contents of MRL metabolites in mouse urine and feces. (B) Comparison of the major metabolic pathway in vivo. Reaction types: (1) hydroxylation and hydroxylation followed by glucuronidation; (2) demethylation and demethylation followed by glucuronidation; (3) oxidation. N.D., not detected. Data were presented as mean ± SEM. | ||
| Metabolites (ID) | Rt (min) | Observed m/z [M + Na]+ | Major fragment ions (m/z) | Mass error (ppm) | Molecular formula | Source |
|---|---|---|---|---|---|---|
| a Indicate novel metabolites found in this study. | ||||||
| M0 | 9.7 | 397.1623 | 326, 283, 216, 173 | 0.35 | C21H26O6 | MLM, HLM, urine, feces |
| M1 | 8.9 | 275.1258 | 216, 176 | −1.53 | C14H20O4 | MLM, HLM |
| M2a | 6.2 | 291.1203 | 242, 232, 215, 199 | 0.03 | C14H20O5 | MLM, HLM |
| M3 | 6.8 | 291.1198 | 245, 231, 181, 153 | −1.68 | C14H20O5 | MLM, HLM |
| M4 | 7.7 | 291.1202 | 273, 251, 216, 194 | −0.31 | C14H20O5 | MLM, HLM |
| M5a | 7.1 | 413.1569 | 381, 339, 308, 232 | −0.41 | C21H26O7 | MLM, HLM |
| M6a | 7.3 | 413.1571 | 396, 337, 277, 232, 215 | 0.07 | C21H26O7 | MLM, HLM, urine |
| M7 | 7.9 | 413.1577 | 324, 232, 204 | 1.52 | C21H26O7 | MLM, HLM |
| M8a | 8.7 | 413.1571 | 384, 302, 216 | 0.07 | C21H26O7 | MLM, HLM |
| M9a | 8.6 | 289.1048 | 251, 229, 204 | 0.56 | C14H18O5 | MLM, HLM, urine, feces |
| M10a | 8.8 | 383.1450 | 325, 261, 216 | −3.94 | C20H24O6 | MLM, HLM, urine |
| M11a | 9.0 | 383.1468 | 365, 323, 277, 229, 202 | 0.72 | C20H24O6 | MLM, HLM, urine, feces |
| M12a | 8.2 | 261.1110 | 202, 168 | 4.87 | C13H18O4 | MLM, HLM |
| M13a | 7.5 | 573.1925 | 397, 379, 216 | −3.05 | C27H34O12 | Urine |
| M14a | 6.8 | 451.1582 | 275, 216, | 7.76 | C20H28O10 | Urine |
| M15a | 5.7 | 589.1881 | 413, 381, 232 | −1.80 | C27H34O13 | Urine |
| M16a | 6.0 | 589.1901 | 413, 396, 307, 232, 215 | 1.60 | C27H34O13 | Urine |
| M17a | 6.9 | 589.1866 | 413, 370, 317, 232 | −4.34 | C27H34O13 | Urine |
| M18a | 7.2 | 589.1877 | 413, 391, 362, 216 | −2.48 | C27H34O13 | Urine |
| M19a | 6.3 | 559.1771 | 383, 216 | −1.61 | C26H32O12 | Urine |
| M20a | 7.3 | 559.1776 | 383, 216 | −1.79 | C26H32O12 | Urine |
| M21a | 6.6 | 559.1773 | 383, 202 | −2.32 | C26H32O12 | Urine |
| M22a | 7.1 | 559.1780 | 383, 202 | −1.07 | C26H32O12 | Urine |
| M23a | 8.4 | 477.1186 | 397, 379 | −0.07 | C21H26SO9 | Urine |
To clarify the metabolic pathway and predict the metabolic differences between human and mouse, the phase I metabolisms of MRL were performed in mouse liver microsome (MLM) and human liver microsome (HLM) incubation systems. The MRL treatment and control group could be well separated from each other by PCA model (Fig. 4A), and the potential metabolites were primarily determined from S-plot (Fig. 4B). The phase I metabolites of MRL were further separated from endogenous metabolites by the trend plots which was generated from S-plot (example of Fig. 4C and D). Overall, twelve MRL metabolites (M1–M12) were identified in MLM incubation system (Table 1). Among these metabolites, M1, M3, M4 and M7 have been reported in the previous study.19 The structures of other eight metabolites (M2, M5, M6, and M8–M12) were found in this study and determined as novel MRL metabolites. The metabolites of MRL in HLM incubation system were similar to that in the MLM incubation system (Table 1). The percentage of whole detected metabolites of MRL is shown in Fig. 5A. The percentage of parent MRL was 71.16% in MLM and 42.73% in HLM, indicating that mice liver microsome shows lower metabolic rate than human liver microsome.
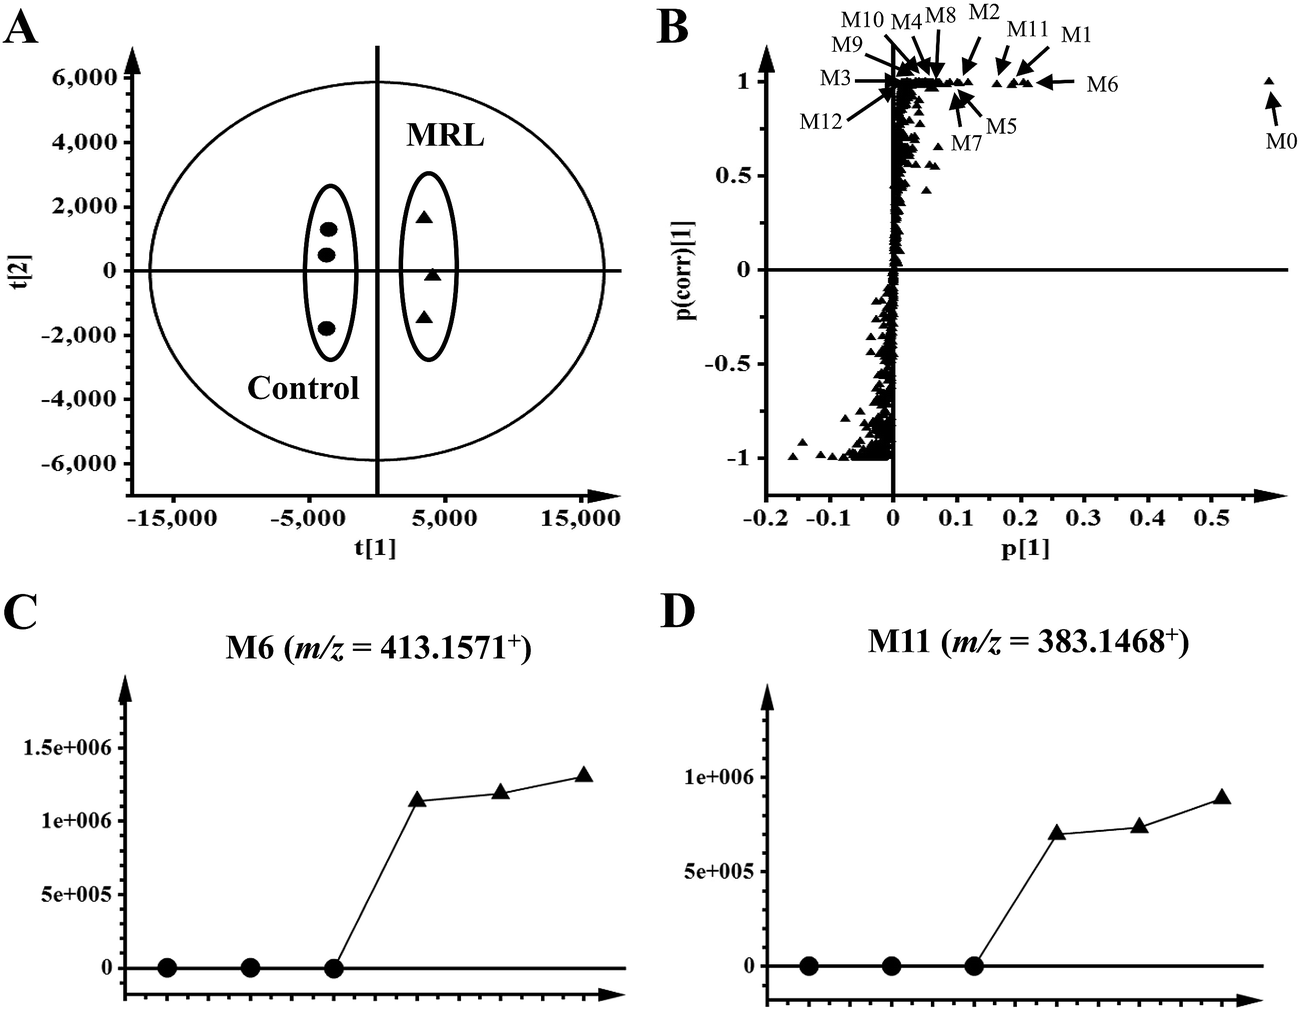 | ||
| Fig. 4 Metabolomics analysis of MRL metabolites in mouse liver microsome. (A) Scores plot of an OPLS-DA model from MLM incubation mixture without drug (control) and with MRL. (B) OPLS-DA loading S-plot. (C) Trend plot of M6 in MLM with and without MRL. (D) Trend plot of M11 in MLM with and without MRL. (●, control-treated MLM; ▲, MRL-treated MLM). Metabolite codes correspond to those in Table 1. | ||
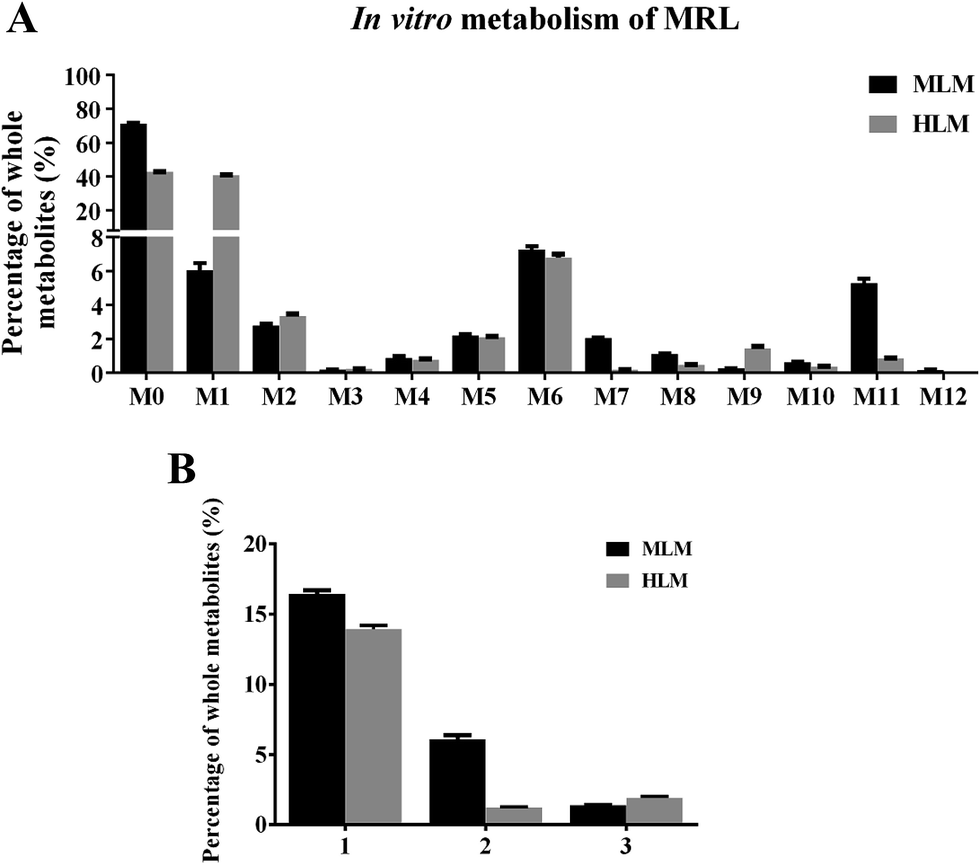 | ||
| Fig. 5 In vitro metabolisms of MRL by liver microsomes. (A) Metabolites of MRL in mouse liver microsome (MLM) and human liver microsome (HLM) incubation systems. (B) Comparison of the major metabolic pathway in vitro. Reaction types: (1) hydroxylation; (2) demethylation; (3) oxidation. Data were presented as mean ± SEM. | ||
In MLM incubation system, the hydroxylated metabolites of MRL presented as the major metabolites (16.45% of total identified metabolites) and followed by demethylated metabolites (6.08% of total identified metabolites). In HLM incubation system, the hydroxylated metabolites of MRL were the highest among all the identified metabolites (Fig. 5B). This result demonstrated that hydroxylation is a crucial metabolic pathway for MRL in both MLM and HLM metabolism.
Identification and structural elucidation of phase I metabolites of MRL
PCA analysis initially suggested some potential phase I metabolites of MRL. The chemical structures of these metabolites were further identified by the accurate mass measurement and tandem MS fragmentography. Positive ion mode ESI mass spectra were used to collect data. The precursor ions [M + Na]+ of these metabolites were selected and subsequently fragmented in MS/MS mode to obtain product ions spectra and yield useful structural information. The observed m/z of MS/MS fragments ions are shown in Table 1.MRL was calculated as C21H26O6 based on the accurate mass measurement [M + Na]+ ion (m/z 397.1623+), and the main MS/MS fragmentation ions of MRL were 326, 283, 216, 173 and 108. The m/z 216 had the highest response in the secondary mass spectrometry, which was eliminated the group of C7H7O2, CH3O, and C2H3.
Metabolite M1 was calculated as C14H20O4 based on the accurate mass measurement [M + Na]+ ion (m/z 275.1258+). Compared with the [M + Na]+ ion (m/z 397.1643+) of parent MRL, M1 was 122 Da (C7H6O2) lower than MRL. In addition, the m/z 216 fragment ion by M1 is consistent with the main fragment ion of MRL. M1 is a metabolite obtained by decomposing the left benzene ring fraction (C7H6O2) of MRL.
The excimer ions of M2, M3 and M4 were m/z 291 ([M + Na]+), which were 16 Da larger than M1. Neutral losses of 28 (C2H4) suggested the existence of vinyl group in metabolites M2 and M3, and M3 subsequently neutral losses of 28 (CO) fragment ion, suggested that its structure contains 1-hydroxyallyl. M4 was eliminated the group of C2H4O, and speculated that its structure contains 3-hydroxy-prop-1-enyl. According to above reasoning, M2, M3 and M4 were the hydroxylation products of M1, and their hydroxylation occurs on the benzene ring, position C7′ and C9′, respectively. The tandem MS spectra and fragmentation pattern of M2 was shown in Fig. 6A.
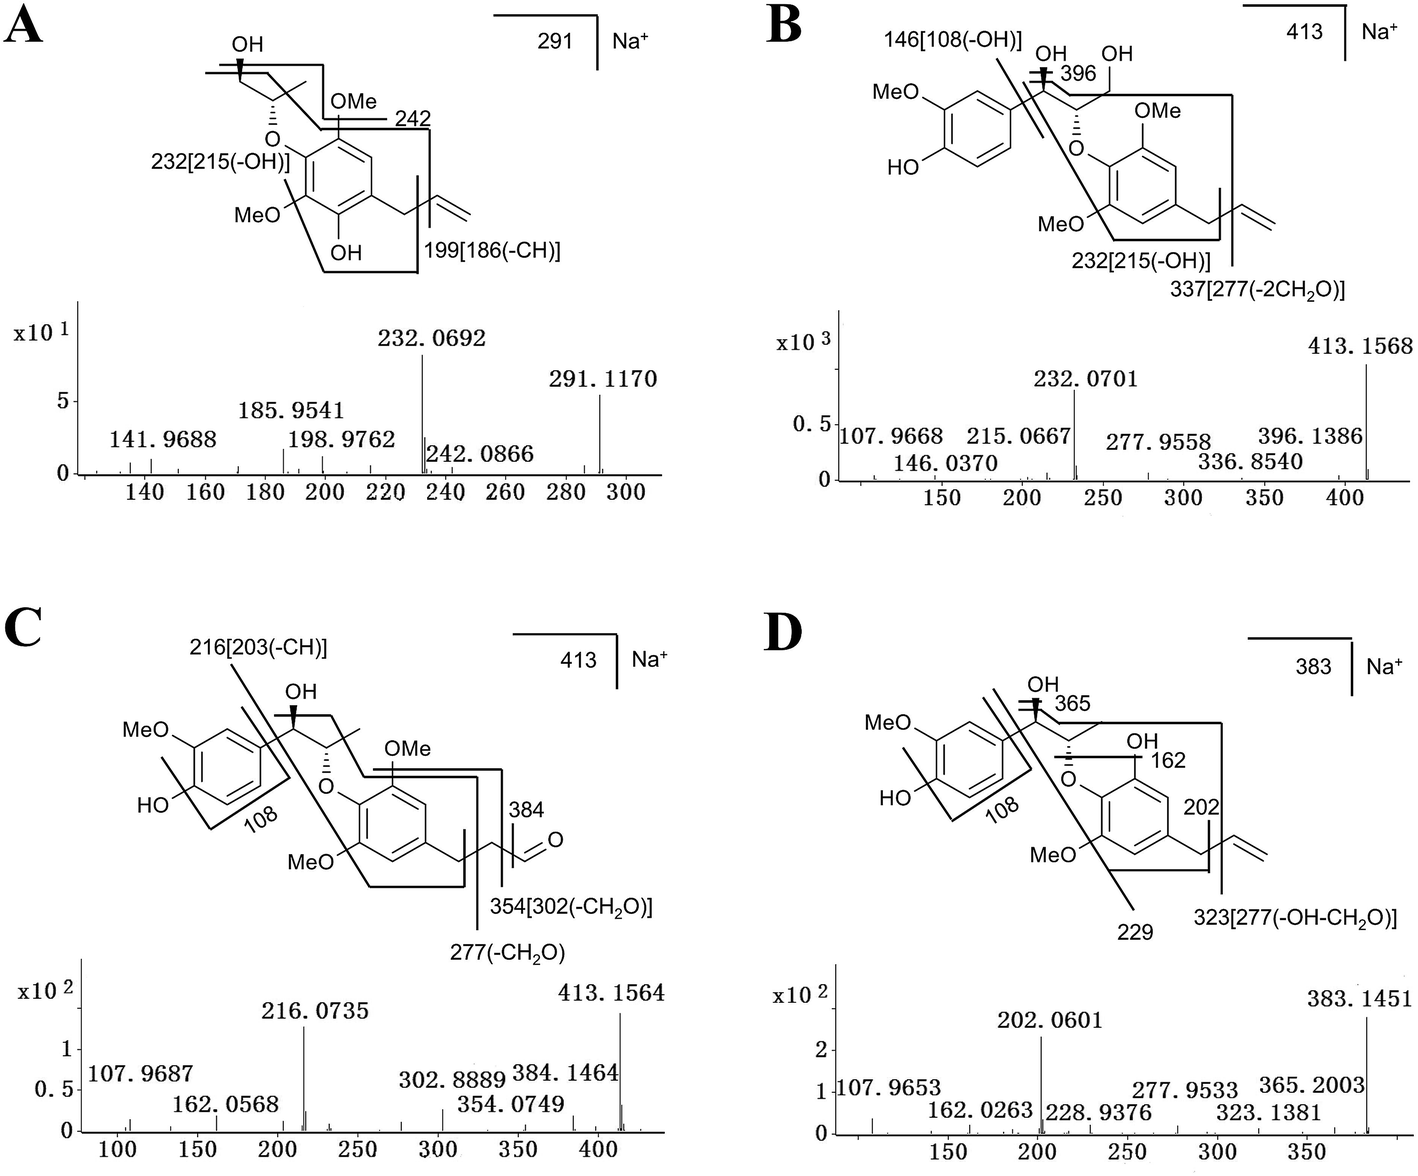 | ||
| Fig. 6 Tandem MS spectra and fragmentation pattern of some representative metabolites of MRL. (A) Tandem MS spectra and chemical structure of M2. (B) Tandem MS spectra and chemical structure of M6. (C) Tandem MS spectra and chemical structure of M8. (D) Tandem MS and chemical structure of M11. MS/MS fragmentation was conducted with collision energy at 20 eV. | ||
Metabolites M5, M6, M7 and M8 were calculated as C21H26O7 based on their excimer ions ([M + Na]+), and higher by 16 Da (O) than MRL, indicating that they were the hydroxylation products of MRL. The product ions at m/z 232 of M5, M6 and M7 were higher by 16 Da than the product ion of MRL at m/z 216, suggesting that M6, M7 and M5 may be the hydroxylation products of MRL on C9, C7′ and benzene ring on the C2′ or C6′ position. M5 was eliminated the groups of CH3 and C3H6, thus indicating that M5 was hydroxylation metabolite on the benzene ring of MRL. The elimination of the group of 27 (C2H3) suggested the existence of vinyl group in metabolites M6 and M7, and M7 also neutral losses of 28 (CO) fragment ion, suggested that its structure contains 1-hydroxyallyl. Therefore, M6 and M7 were determined as C9-hydroxyl and C7′-hydroxyl metabolites of MRL. The elimination of the group of 29 (CHO) suggested the existence of aldehyde group in metabolite M8, and the m/z 216 fragment ion by M8 was consistent with the main fragment ion of MRL, suggesting that M8 was the C9′-hydroxylation and rearrangement product of MRL. The tandem MS spectra and fragmentation pattern of M6 and M8 were shown in Fig. 6B and C.
Metabolite M9 was deduced as C14H18O5 based on the accurate mass measurement [M + Na]+ ion (m/z 289.1048+), and was 2 Da (H2) lower than M4. The elimination of the group of 29 (CHO) suggested the existence of aldehyde group in metabolite M9, indicating that M9 was the oxidation product of M4.
The elimination of the group of 27 (C2H3) or 28 (C2H4) suggested the existence of vinyl group in metabolites M10, M11 and M12. Metabolites M10 and M11 were calculated as C20H24O6 based on the accurate mass of [M + Na]+ ions (m/z 383.1451+ and m/z 383.1468+), and both lower by 14 Da (CH2) than MRL. Additionally, the product ion at m/z 216 of M10 was the same as the product ion found in MRL and the product ion at m/z 202 of M11 was lower by 14 Da than the product ion of MRL at m/z 216, indicating that M10 was the C3–O-demethylation metabolite of MRL and M11 was the C3′-demethylation or C5′-demethylation metabolite of MRL. Metabolite M12 was deduced as C13H18O4 based on the accurate mass of [M + Na]+ ion (m/z 261.1110+), and lower by 14 Da (CH2) than M1, and the product ion at m/z 202 of M12 was lower by 14 Da than the product ion of M1 at m/z 216, suggesting that M12 was the demethylation product of M1. The tandem MS spectra and fragmentation pattern of M11 was shown in Fig. 6D.
Identification of phase II metabolites of MRL
Metabolite M13 was deduced as C27H34O12 based on the accurate mass of [M + Na]+ ion (m/z 573.1925+), and was 176 Da (C6H8O6) higher than MRL. The product ions at m/z 397 and 216 of M13 were similar to the product ions found in MRL (Table 1), indicating that M13 was glucuronic acid-conjugated product of MRL. After elimination of the glucuronic acid group (C6H8O6), metabolites M14, M15, M16, M17, and M18 yielded fragment ions at m/z 275, 413, 413, 413 and 413 that were similar to the mass of M1, M5, M6, M7 and M8, respectively. Therefore, metabolites M14–M18 were glucuronic acid-conjugated products derived from M1, M5, M6, M7 and M8, respectively. Metabolites M19, M20, M21 and M22 were calculated as C26H32O12 based on their excimer ions ([M + Na]+). M19 and M20 were eliminated the group of glucuronic acid (C6H8O6), and the product ions at m/z 383 and 216 were similar to the product ions found in M10, indicating that M19 and M20 were glucuronic acid-conjugated product of M10. Similarly, M21 and M22 were eliminated the group of glucuronic acid (C6H8O6), and the product ions at m/z 383 and 202 were similar to the product ions found in M11, indicating that M21 and M22 were glucuronic acid-conjugated product of M11. Metabolite M23 was deduced as C21H26SO9 based on the accurate mass of [M + Na]+ ion (m/z 477.1186+), and was 80 Da (SO3) higher than MRL. The product ions at m/z 397 and 216 of M23 were similar to the product ions found in MRL, indicating that M23 was sulfuric acid-conjugated product of MRL.Screening the CYPs involved in the metabolism of MRL
To date, there is no study reported which CYPs are involved in the metabolism of MRL. To verify the phase I enzymes involved in the metabolism, MRL was incubated with a panel of recombinant human P450s including CYP1A1, 1A2, 1B1, 2A6, 2B6, 2C19, 2C8, 2C9, 2D6, 2E1 3A4, 3A and 4A11. Among them, CYP3A4 and 3A5 were the most active enzymes of all the P450s for MRL metabolism (Table 2). The secondary enzymes for MRL metabolizing were CYP1A1 and 1A2 evidenced by CYP1A1 contributed to nine metabolites (M1, M2, M4–M8, M10 and M11) generation and CYP1A2 corresponded to eight metabolites (M1, M2, M5–M8, M10 and M11) of MRL, respectively. All recombined human CYPs were responsible for the formation of monohydroxylated MRL metabolites M5 and M6. Among them, CYP1A1 and 2C19 exhibited highest catalytic activities towards the formation of M6, while CYP2C19 acted the key role in M5 formation. Another monohydroxylated metabolite M7 was produced by CYP2C8 mostly. CYP3A4 and 3A5 were the primary enzymes that cleaved parent MRL and formed metabolite M1 followed by hydroxylation. Through this pathway, M2, M3 and M4 were mainly produced by CYP3A4/5. The demethylated metabolite M10 was mainly transformed by CYP1A1, 3A5 and 1A2, and M11 was mainly transformed by CYP2C9 and 1A2.| No. | Enzyme | M1 | M2 | M3 | M4 | M5 | M6 | M7 | M8 | M9 | M10 | M11 | M12 |
|---|---|---|---|---|---|---|---|---|---|---|---|---|---|
| a cDNA-expressed CYPs (control, CYP1A1, 1A2, 1B1, 2A6, 2B6, 2C19, 2C8, 2C9, 2D6, 2E1, 3A4, 3A5, and 4A11) were used to examine the roles of in individual CYPs in MRL metabolism. All samples were analyzed by UPLC-ESI-QTOFMS. The total peak areas of each metabolite of MRL from all the CYPs were set as 100%. All data are expressed as mean (n = 3). | |||||||||||||
| 0 | Control | 0.11 | — | — | — | 1.36 | 0.12 | — | — | — | — | — | — |
| 1 | CYP1A1R | 3.67 | 7.60 | — | 9.39 | 6.11 | 32.73 | 3.89 | 18.37 | — | 32.20 | 6.34 | — |
| 2 | CYP1A2R | 1.01 | 5.39 | — | — | 2.44 | 1.68 | 1.09 | 19.87 | — | 15.07 | 36.52 | — |
| 3 | CYP1B1R | 0.35 | — | — | — | 1.58 | 0.32 | 0.22 | — | — | 0.46 | — | — |
| 4 | CYP2A6R | 0.09 | — | — | — | 1.54 | 0.13 | — | — | — | — | — | — |
| 5 | CYP2B6R | 0.16 | — | — | — | 1.55 | 0.19 | 1.06 | — | — | — | — | — |
| 6 | CYP2C19R | 0.45 | — | — | — | 51.36 | 24.36 | 8.94 | — | — | 4.26 | — | — |
| 7 | CYP2C8R | 1.01 | — | — | — | 2.41 | 6.51 | 53.90 | — | — | 1.01 | 4.20 | — |
| 8 | CYP2C9R | 0.05 | — | — | — | 14.83 | 5.05 | 6.57 | — | — | 1.31 | 45.73 | — |
| 9 | CYP2D6R | 0.29 | — | — | — | 3.68 | 8.08 | 10.17 | — | — | 1.62 | — | — |
| 10 | CYP2E1R | 0.11 | — | — | — | 1.57 | 0.19 | — | — | — | — | — | — |
| 11 | CYP3A4R | 41.81 | 30.68 | 46.95 | 52.98 | 2.04 | 4.81 | 4.26 | 15.95 | — | 12.70 | 1.73 | — |
| 12 | CYP3A5R | 50.76 | 56.32 | 53.05 | 37.63 | 7.81 | 15.69 | 9.90 | 45.81 | — | 31.37 | 5.48 | — |
| 13 | CYP4A11R | 0.13 | — | — | — | 1.73 | 0.13 | — | — | — | — | — | — |
Discussion
MRL shows various biological activities and preliminary in vitro metabolism of MRL has been investigated,19 however, the systematic in vivo metabolism of this compound and the CYPs involved in its metabolism are still not clear. The present study was aimed to decipher the metabolic map of MRL using metabolomics approach. By using this strategy, a series of hydroxylation, hydrogenation, demethylation, oxidation, glucuronidation, and sulfation metabolites of MRL were determined in vivo and in vitro. Combined with OPLS analysis, total fifteen metabolites (M6, M9–M11, M13–M23) were determined in mouse urine samples and three (M9, M10 and M11) of them were found in feces samples. Parent MRL was also found in both of feces and urine samples and it was the most abundant metabolite in feces. The structures of these metabolites were further identified by MS/MS fragmentography. All of these phase II metabolites were novel metabolites of MRL. The main metabolic pathway in vivo was demethylation followed by glucuronidation (–CH3 + C6H8O6), and all of these glucuronidated metabolites were excreted in urine but not in feces. The secondary in vivo metabolic pathway was hydroxylation plus glucuronidation, and these metabolites were also mainly excreted in urine but not in feces. In the phase II metabolism, some charged species such as glutamine, glycine, sulfate, or glucuronic acid could be conjugated with the metabolites of xenobiotics.26 The addition of these groups produces more polar metabolites and increases the hydrophilicity of the metabolites of xenobiotics. Previous study has revealed that the level of phase I metabolites obviously increased in urine of rats, human and rabbits after the catalyzing of β-glucuronidase.27 In this study, most of the phase II metabolites, including eleven corresponding glucuronides of phase I metabolites were discovered in urines of C57/BL6 mice (Fig. 3A). Among them, M13 (glucuronidation of parent MRL) shows the highest abundance in urine. However, the parent MRL was excreted as the highest abundance in feces. The results indicate that MRL could be excreted through both urine and feces in which hydrophilic glucuronidated products are mainly excreted in urine and the hydrophobic phase I metabolites are mainly excreted through feces.Drug metabolism is a complex process and plays essential role in determining the efficiency and safety of drugs.28 Numerous metabolites were produced following the phase I metabolism and part of them are inactive substances which may lead to significant decrease of therapeutic potential of drugs. On the other hand, some active metabolites formed by phase I metabolic enzymes could induce adverse effects. Thus, systematically determination of the metabolic map of drugs is required. To elucidate the metabolic pathway of MRL in vivo, MLM and HLM was incubated with MRL, respectively. In this study, total twelve phase I metabolites were identified by MLM metabolism. The cleavage of left aromatic ring (1, 7 C–C bond broken) of MRL (Fig. 7) leading to the formation of M1 was discovered, which is consistent with the previous report.19 Furthermore, other phase I metabolites from M1 were identified, including the hydroxylation at position C2′ of the aromatic ring leading to the generation of M2, the hydroxylation at position C7′ leading to the formation of M3, the hydroxylation of position C9′ subsequently to rearrangement of allyl group leading to the generation of M4, oxidation of 9′-OH group of M4 resulting in the formation of M9, and cleavage of methyl group (position C5′-O) leading to the generation of M12. Using the present strategy, several phase I metabolites were newly identified. M6, the most abundant phase I metabolite of MRL was identified as hydroxylation at position C9 of the side chain (Fig. 6B). The hydroxylated metabolites M5 and M8, and demethylated metabolites M10 and M11 were also identified. To compare MRL metabolism in human and mice, HLM metabolic system incubated with MRL was also performed in this study. As shown in Fig. 5A, the metabolites of HLM were similar to MLM. The relative contents of M1 and M9 from HLM metabolism were significantly higher than that of MLM, conversely, the percentage of M7, M8 and M11 were significantly lower than that of MLM metabolism. These data suggest that human and mice liver P450s shows the metabolic differences for MRL metabolism.
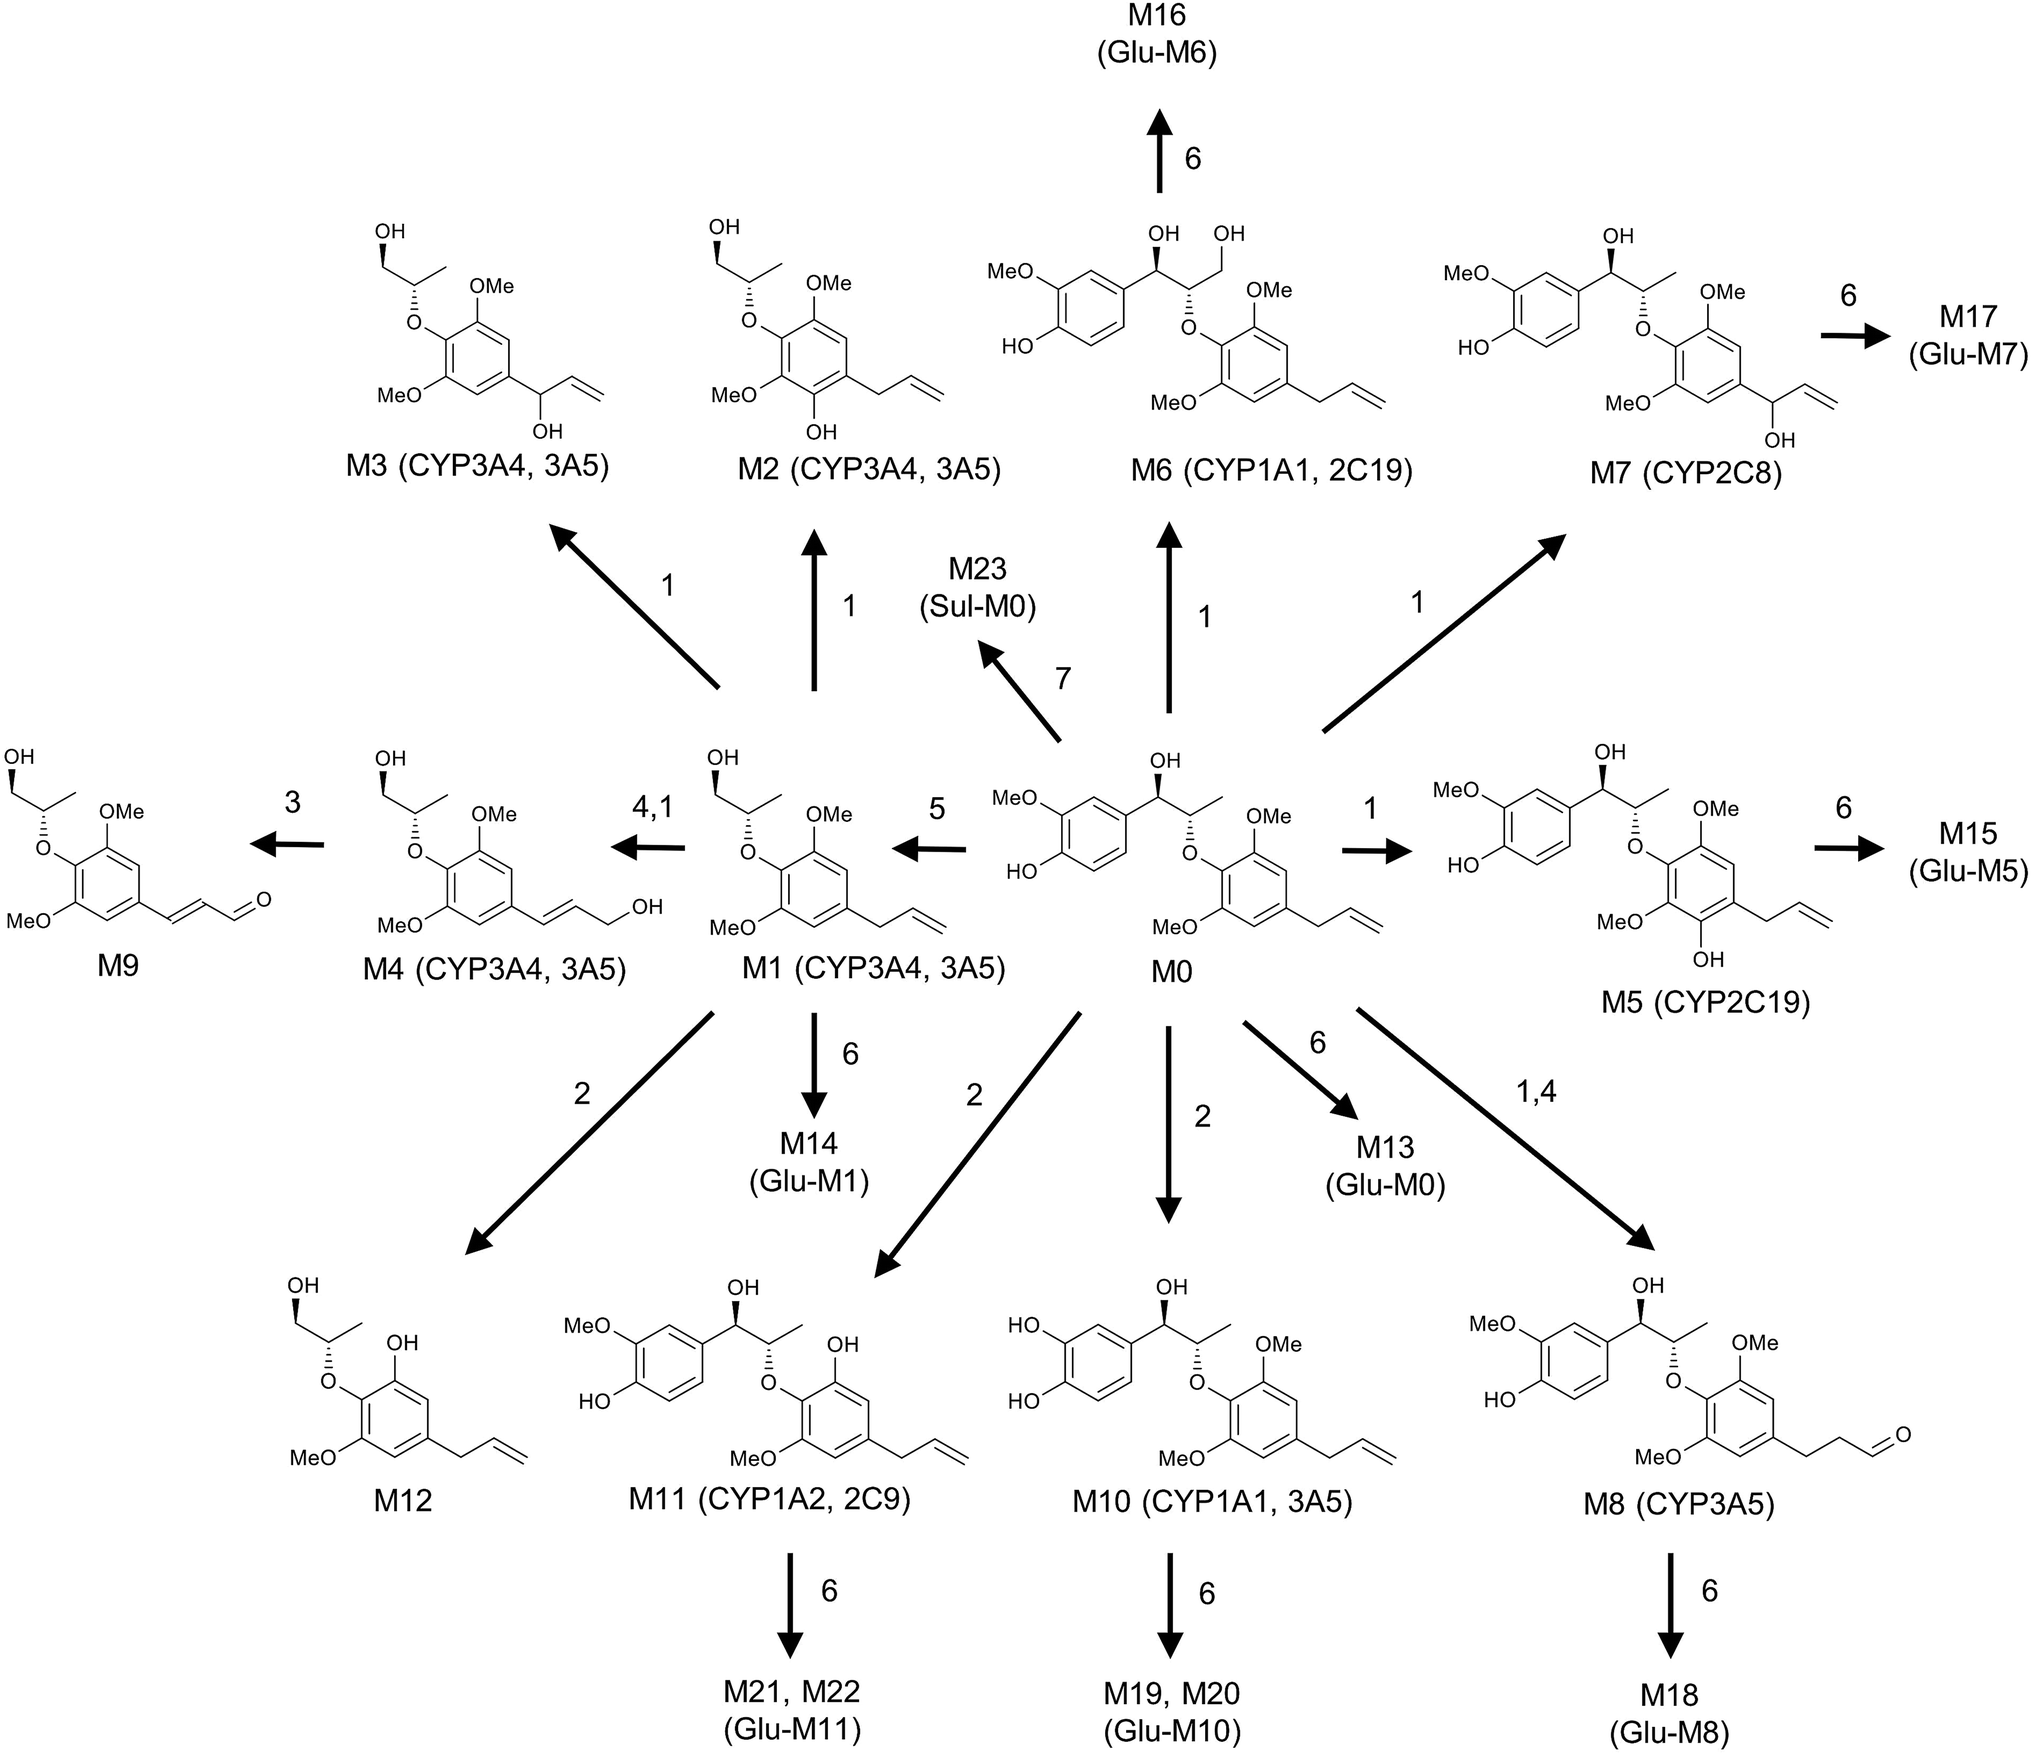 | ||
| Fig. 7 Metabolic map of MRL. All structures of these metabolites were determined based on the exact mass measurement (mass error less than 10 ppm) and MS/MS fragments. Reaction types: (1) hydroxylation; (2) demethylation; (3) oxidation; (4) rearrangement; (5) decomposing; (6) glucuronidation; (7) sulfation. | ||
It was found that hydroxylation was the major phase I metabolic reaction in both mouse and human liver microsomes (Fig. 5B), followed by demethylation and oxidation. Recent years, human recombined cytochrome P450 enzymes (CYP450s) were used in vitro metabolism to discover the isoenzyme responsible for the metabolism of drugs.29,30 To determine the role of individual CYP450 in MRL metabolism, parent MRL was incubated with a panel of recombinant human P450s including CYP1A1, 1A2, 1B1, 2A6, 2B6, 2C19, 2C8, 2C9, 2D6, 2E1 3A4, 3A and 4A11. CYP3A4 and 3A5 played the crucial roles in MRL metabolism evidenced by they involved in generation of most metabolites (Table 2). CYP3A4 and 3A5 is responsible for the metabolism of more than 50% of current drugs on the market and dietary polyphenols.31 Qin et al. (2014) reported that lignans in WZ were the substrate of CYP3A, and the lignans competitive bound with CYP3A lead to increasing the plasma concentration of tacrolimus.32 The high activities of CYP3A4 and 3A5 towards MRL biotransformation indicated that MRL may be the substrate of CYP3A4 and 3A5. Furthermore, the major metabolite M6 was mainly produced by CYP1A1 and 2C19 (32.73 and 24.36%, respectively), and the high abundant metabolite M11 was mainly formed by CYP1A2 and 2C9. The CYP2C19 is also an important drug metabolic enzyme.33 The present study clarifies the subtype of CYPs involved in the metabolism of MRL.
Interestingly, MRL and its metabolites were prone to generate the high abundance ions of Na+ adducts due to one 8-O-4′ type bond in the molecular structure. In addition, most of the daughter ions of these [M + Na]+ were also observed as Na+ adducts. Previous study shown that MRL could form a stable adduct ion ([M + Na]+) in positive full-scan mode, nevertheless, it could not form the distinct product ions in MS/MS mode by using triple quadrupole mass spectrometer because in this mode, the energy is not enough to obtain fragments.18 It was reported that Phillyrin that contains the ether bond in its molecular structure gave high abundance Na+ adducts of parent ions and its fragment ions in positive MS/MS mode.34 The MS/MS fragmentations of phillyrin were generated in ESI+ mode when collision energy was set at 27 eV. The ether bond compounds 3-hydroxybutylphthalide-3-O-β-D-glucuronide and 3-hydroxybutylphthalide-3-S-acetylcysteine from Danggui Buxue Tang also could produce high abundance Na+ adducts.35 In our experiment, the signals of MRL and its metabolites in the ESI− mode were extremely weak. The tandem MS of selected metabolites was preliminary conducted in the targeted mode by ramping collision energies from 5 to 25 eV in positive ESI mode. The appropriate collision energy was finally set at 20 eV because the daughter fragment ions of MRL metabolites could not be obtained below 20 eV, and the parent ions of MRL metabolites could not be detected when the collision energy was higher than 20 eV. Therefore, the relative high concentration of compounds and appropriate energy voltage of bombardment are essential for the generation of ions fragmentation of MRL metabolites.
Conclusion
In summary, the metabolism of MRL was investigated by UPLC-ESI-QTOFMS-based metabolomics in mouse model and liver microsomal incubation system. Total 23 MRL metabolites were identified in vivo and in vitro metabolism, including 19 newly identified metabolites. The comprehensive metabolic pathway of MRL was described (Fig. 7). Hydroxylation and demethylation were the major metabolic pathways for MRL metabolism in vitro and in vivo, respectively. The P450 enzymes involved in MRL metabolism were determined by recombinant cytochrome CYPs screening. CYP3A4 and 3A5 are found to be the major enzymes responsible for MRL metabolism. Our findings provide important information for the metabolism and disposition of 8-O-4′-neolignans in nutmeg. These results are essential for understanding MRL metabolism in mice, and provide fundamental for the investigation of MRL metabolism in humans.Conflicts of interest
The authors have declared no conflict of interest.Acknowledgements
This work was supported by the Thousand Young Talents Program of China, National Natural Science Foundation of China (81360509), State Key Laboratory of Phytochemistry and Plant Resources in West China (52Y67A9211Z1) and Postdoctoral targeted funding, Ministry of Human Resources and Social Security of Yunnan Province, China (39Y732921261).References
- R. S. Ward, Chem. Soc. Rev., 1982, 11, 75–125 RSC.
- G. P. Moss, Pure Appl. Chem., 2000, 72, 1493–1523 CrossRef CAS.
- W. D. MacRae and G. N. Towers, Phytochem. Rev., 1984, 23, 1207–1220 CrossRef CAS.
- J. L. Ríos, R. M. Giner and J. M. Prieto, Stud. Nat. Prod. Chem., 2002, 26, 183–292 Search PubMed.
- X. W. Yang, X. Huang and M. Ahmat, China J. Chin. Mater. Med., 2008, 33, 397–402 CAS.
- M. Adams, C. Berset, M. Kessler and M. Hamburger, J. Ethnopharmacol., 2009, 121, 343–359 CrossRef PubMed.
- M. A. Kareem, S. G. Krushna, S. A. Hussain and K. L. Devi, Trop. J. Pharm. Res., 2009, 8, 337–344 Search PubMed.
- H. Kim, Y. Bu, B. J. Lee, J. Bae, S. Park, J. Kim, K. Lee, J. M. Cha, B. Ryu, S. J. Ko, G. Han, B. Min and J. W. Park, J. Med. Food, 2013, 16, 953–956 CrossRef PubMed.
- S. Chatterjee, Z. Niaz, S. Gautam, S. Adhikari, P. S. Variyar and A. Sharma, Food Chem., 2007, 101, 515–523 CrossRef CAS.
- S. Pillai, R. Mahmud, W. C. Lee and S. Perumal, APCBEE Proc., 2012, 2, 92–96 CrossRef CAS.
- Y. Wang and X. W. Yang, Mod. Chin. Med., 2008, 2, 004 CrossRef PubMed.
- K. H. Shin and W. S. Woo, Korean Biochem. J., 1990, 23, 122–127 CAS.
- G. Y. Cao, W. Xu, X. W. Yang, F. J. Gonzalez and F. Li, Food Chem., 2015, 173, 231–237 CrossRef CAS PubMed.
- K. Nakajima, T. Yamazaki, K. Kawashima, Y. Shinho, T. Kurashige, T. Nohara and M. Nishimura, Vascular smooth muscle contraction inhibitors from Myristica, JP 11080013, Jpn. Kokai Tokkyo Koho, 1999, p. 8.
- M. Miyazawa, H. Kasahara and H. Kameoka, Nat. Prod. Lett., 1996, 8, 271–273 CrossRef CAS.
- X. W. Yang, X. Huang, L. Ma, Q. Wu and W. Xu, Planta Med., 2010, 76, 1587–1591 CrossRef CAS PubMed.
- Y. Wang, J.-X. Liu, Y.-B. Zhang, F. Li and X.-W. Yang, Chromatographia, 2012, 75, 541–549 CAS.
- Z. Zhu, S. Yang, W. Zhao, R. Li and C. Zhao, J. Chromatogr. Sci., 2016, 54, 689–696 CAS.
- F. Li and X. W. Yang, Phytochemistry, 2008, 69, 765–771 CrossRef CAS PubMed.
- F. Li, A. D. Patterson, K. W. Krausz, B. Dick, F. J. Frey, F. J. Gonzalez and J. R. Idle, Biochem. Pharmacol., 2012, 83, 1435–1444 CrossRef CAS PubMed.
- X. Liu, Y. Lu, X. Guan, B. Dong, H. Chavan, J. Wang, Y. Zhang, P. Krishnamurthy and F. Li, Biochem. Pharmacol., 2015, 97, 111–121 CrossRef CAS PubMed.
- Z. Z. Fang, K. W. Krausz, F. Li, J. Cheng, N. Tanaka and F. J. Gonzalez, Br. J. Pharmacol., 2012, 167, 1271–1286 CrossRef CAS PubMed.
- S. Giri, J. R. Idle, C. Chen, T. Mark Zabriskie, K. W. Krausz and F. J. Gonzalez, Chem. Res. Toxicol., 2006, 19, 818–827 CrossRef CAS PubMed.
- Q. Zhao, X. M. Li, H. N. Liu, F. J. Gonzalez and F. Li, Xenobiotica, 2017, 1–38 CrossRef PubMed , just-accepted.
- T. Kind and O. Fiehn, BMC Bioinf., 2007, 8, 105 CrossRef PubMed.
- C. Xu, C. Y. T. Li and A. N. T. Kong, Arch. Pharmacal Res., 2005, 28, 249–268 CrossRef CAS.
- N. Tsunoda and H. Yoshimura, Xenobiotica, 1981, 11, 23–32 CrossRef CAS PubMed.
- J. H. Lin and A. Y. H. Lu, Pharmacol. Rev., 1997, 49, 403–449 CAS.
- J. H. Kim, H. S. Kim, T. Y. Kong, J. Y. Lee, J. Y. Kim, M. K. In and H. S. Lee, J. Pharm. Biomed. Anal., 2016, 119, 50–58 CrossRef CAS PubMed.
- J. Vrba, B. Papouskova, M. Pyszkova, M. Zatloukalova, K. Lemr, J. Ulrichova and J. Vacek, J. Pharm. Biomed. Anal., 2015, 102, 193–198 CrossRef CAS PubMed.
- K. E. Thummel and G. R. Wilkinson, Annu. Rev. Pharmacol. Toxicol., 1998, 38, 389–430 CrossRef CAS PubMed.
- X. L. Qin, X. Chen, G. P. Zhong, X. M. Fan, Y. Wang, X. P. Xue, Y. Wang, M. Huang and H. C. Bi, Phytomedicine, 2014, 21, 766–772 CrossRef CAS PubMed.
- D. L. Thacker, A. Modak, P. D. Nguyen, D. A. Flockhart and Z. Desta, Chirality, 2011, 23, 904–909 CrossRef CAS PubMed.
- Z. G. Lin, Z. W. Lin, Y. D. Mu and D. Yan, Spectrochim. Acta, Part A, 2016, 167, 84–88 CrossRef CAS PubMed.
- C. Y. Li, L. W. Qi, P. Li, X. D. Wen, Y. F. Zhu, E. H. Liu, Z. Gong, X. L. Yang, M. T. Ren, Y. J. Li and X. X. Ge, Rapid Commun. Mass Spectrom., 2009, 23, 1977–1988 CrossRef CAS PubMed.
Footnote |
| † These authors contributed equally to this work. |
| This journal is © The Royal Society of Chemistry 2017 |