 Open Access Article
Microcosmic understanding on thickening capability of copolymers in supercritical carbon dioxide: the key role of π–π stacking
Wenchao Sun a,
Baojiang Sun*a,
Ying Lib,
Haiming Fana,
Yonghai Gaoa,
Haoyang Sunb and
Guangchao Lic
aSchool of Petroleum Engineering, China University of Petroleum, Qingdao, Shandong 266580, P. R. China. E-mail: sunbj1128@vip.126.com; Fax: +86 0532 86983137; Tel: +86 0532 86981707
bKey Laboratory of Colloid and Interface Chemistry of Staten Education Ministry, Shandong University, Jinan, Shandong 250100, P. R. China
cBeijing Xingyou Project Management Co., Ltd, China National Petroleum Corporation, Beijing 100083, P. R. China
First published on 10th July 2017
Abstract
In this study, styrene/heptadecafluorodecyl acrylate (St–HFDA) copolymers of different compositions were synthetized for the purpose of thickening supercritical carbon dioxide (SC-CO2). The cloud point pressures of the copolymer–CO2 mixtures and the thickening effects of these copolymers for SC-CO2 were measured. Molecular dynamics (MD) simulations were used to evaluate the intermolecular interactions and microstructures of polymer–CO2 systems, the copolymer–CO2 interaction energy, cohesive energy density (CED), solubility parameter, equilibrium conformations and radial distribution functions (RDFs) were obtained, which provided useful information for microscopic understanding on the thickening capability of copolymers in SC-CO2. It was found that all the synthesized St–HFDA copolymers induced greater viscosity enhancements of SC-CO2 compared to poly(Heptadecafluorodecyl acrylate) (PHFDA), and π–π stacking of the Styrene (St) groups played a key role in thickening SC-CO2. On one hand, the introduction of the St groups into PHFDA weakened the CO2-philicity of the polymers by reducing the polymer–CO2 interaction and increasing polymer–polymer interactions, resulting in higher cloud point pressure in SC-CO2 compared to PHFDA. On the other hand, the increase of the polymer–polymer interaction via π–π stacking provided an associative force to thicken SC-CO2. The subtle relationship between the copolymer composition and thickening abilities of the copolymers in SC-CO2 were evaluated and the optimum styrene molar ratio was determined. It can be concluded that the content of the CO2-philic HFDA groups and the CO2-phobic St groups in the copolymers should be optimized to achieve the balance between the solubility and the thickening capability.
Introduction
As a green solvent that is expected to replace the conventional organic solvents, supercritical carbon dioxide (SC-CO2) has high potential in many industrial processes because of the mild critical temperature and pressure. In the oil and gas industry, CO2 is usually used in enhance oil recovery (EOR), and is considered as one type of clean fracturing fluid which is expected to replace the traditional water-based fracturing fluids.1–3 The primary disadvantage of CO2 which has limited its use in EOR is its bad spread efficiency due to the lower viscosity and the large mobility difference compared to oil.4–6 As a fracturing fluid, one of the functions of CO2 is to transport proppants into reservoir fractures to support oil–gas pathway, so enhancing the viscosity of CO2 by adding thickening agents is an urgent challenge not only for increasing the spread efficiency but also for improving the proppant carrying capacity.7However, the thickening of CO2 is difficult to achieve, because CO2 is a poor solvent for most polymers.8–10 Previous studies11–16 have showed that only silicone polymers and fluorinated polymers could be dissolved in CO2 under low pressure. In the CO2–polymer system, it is possible for the polymer to dissolve in CO2 when the polymer–CO2 interaction is greater than the polymer–polymer interaction.17,18 Thus, the strong polymer–CO2 interaction is the premise for the polymers being dissolved in CO2, and the weak polymer–polymer interaction is considered to be the basis of solvation.19–21 But on the other side, too weak polymer–polymer interaction is not favourable for increasing the viscosity of CO2 by intermolecular association. So the moderate polymer–polymer interaction is essential for polymer to dissolve in and thicken CO2.
According to the references in the literature, using copolymer obtained by copolymerizing the CO2-philic and CO2-phobic monomers is an effective strategy to form viscosity-enhancing molecular aggregates via π–π stacking, hydrogen bond and van der Waals interactions.12,22–25 For instance, Beckman et al. have attempted to thicken liquid CO2 by St–HFDA copolymers and obtained good results.4,7 But the investigations about the thickening mechanism are rare, let alone the intensive understanding from the microscopic view.
Computer simulation has provided new way to study the mechanism of intermolecular interactions in polymer–CO2 systems, and has been used to investigate the effects of microstructure variations on macroscopic properties.26–29 The most current report about simulations used for CO2–polymer systems are ab initio quantum mechanical calculations for polymer repeat unit under absolute zero. But its calculation scale is too small to simulate systems containing large number of atoms.30,31 Wang26 has calculated the bonding modes and interaction energies between polymer repeat units and CO2 by ab initio method, but the calculated results conflicted with the experimental results. Molecular dynamics simulation based on molecular mechanics could simulate the interaction of CO2 with polymer chains at actual temperatures and pressures, so its calculation results are more credible.17
This paper is devoted to the investigations for the influences of the intermolecular interactions on the thickening capability of copolymer in SC-CO2. The study will help to reveal the thickening mechanism for SC-CO2, and thereby provide design guidelines for the exploration of SC-CO2 thickening agents. Four kinds of St–HFDA copolymers and PHFDA homopolymer were synthetized by free radical polymerization. The cloud point pressures and the thickening effects of these polymers in SC-CO2 were measured. The relations of the copolymer compositions with the intermolecular interactions and thickening effects were investigated by combining MD simulations and experimental measurements. The MD simulation results of polymer–CO2 interaction energy, cohesive energy density (CED), solubility parameter, equilibrium conformations and radial distribution functions (RDFs) were used to evaluate the intermolecular interactions and microstructures of polymer–CO2 systems. The key role of π–π stacking of the St groups in thickening SC-CO2 and the optimum St molar ratio in copolymers were determined. The content optimization principle of the CO2-philic HFDA group and the CO2-phobic St group in the copolymers were explored.
Methods
Copolymers synthesis and properties measurements
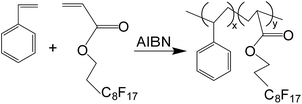
3,3,4,4,5,5,6,6,7,7,8,8,9,9,10,10,10-Heptadecafluorodecyl acrylate (HFDA, 98%, Alfa Aesar) and styrene (St, 99.5%, Alfa Aesar) were used to synthesize the copolymers. 2,2′-Azobisisobutyronitrile (AIBN, 99%) was purchased from Aldrich and purified twice by recrystallization from methanol.32 1,1,2-Trichlorotrifluoroethane (99.5%) and methanol (99.9%) were obtained from Aldrich and used as purchased.The styrene/heptadecafluorodecyl acrylate copolymer was synthesized with AIBN as initiator according to the procedure of Beckman et al., as shown in Scheme 1.7,33,34 The mixture of 33.4 g HFDA and 6.6 g styrene was bubbled with nitrogen for 30 minutes to ensure that the entire reaction was under the nitrogen atmosphere. The reaction flask was sealed after adding 0.24 g AIBN. The reaction was carried out at 65 °C for 60 hours under an oil bath. After cooling, the reaction mixture was dissolved in 1,1,2-trifluorotriochloroethane, then precipitated with methanol, washed and finally dried in vacuum oven. The copolymers synthesized were named PHFDA–xSt and the ‘x’ represents the molar ratio of styrene. The four copolymers used herein were PHFDA–0.219St, PHFDA–0.299St, PHFDA–0.501St and PHFDA–0.702St, respectively.
The copolymer sample was dissolved in 1,1,2-trifluorotrichloroethane and stirred into homogeneous. Ubbelohde viscometer was used to measure the intrinsic viscosity at 25 °C to reflect the molecular weight.7
Bruker-400 MHz NMR was used to record the 1H NMR spectrum33,34 of the mixture of copolymer with 1,1,2-trifluorotrichloroethane in a 5 mm sample tube at a resonant frequency of 400 MHz. The spectra run three times and the average was used to obtain the styrene content by investigating the peak position and intensity in the spectrum.
The 10 wt% solution of copolymer sample with 1,1,2-trifluorotriochloroethane was used to prepare a polymer film. Krishna DSAHT high temperature contact angle meter was used to measure the contact angles of water and n-hexadecane on the copolymer32 film at 25 °C. The measurements were repeated five times and the average value was used to calculate the surface tension of the copolymer by Owens two-liquid method.35–37
Cloud point and viscosity measurements
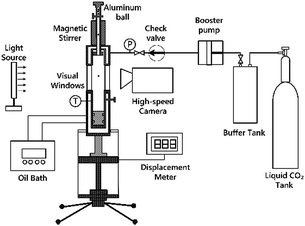
The experiments of cloud point measurement and thickening capability evaluation for the four copolymers in SC-CO2 were conducted by using the device as shown in Scheme 2. The aluminium ball could be placed into the kettle by adjusting the cuff of the pitching device. Olympus I-TR high-speed camera was used to shoot the progress of aluminium ball through the window by 2000 frames per second. After the temperature of polymer–CO2 mixture in the high pressure visual unit reached to the desired value, piston position was changed to allow the pressure reach the required value. Then the mixture was stirred for 30 minutes using the magnetic stirrer. Under constant temperature, the position of piston was changed slowly to increase the volume of the high pressure visual unit, so that the pressure decreased until the phase change formed. The pressure at which the phase change occurred was the cloud point pressure.38–41 The cloud point pressure was determined by repeating the three measurements.Viscosity is calculated by eqn (1)42–52
 | (1) |
The relative viscosity ηR which represents the ratio of the CO2–polymer mixture viscosity to CO2 viscosity measured under the same temperature and pressure was obtained according to the eqn (2) to evaluate the thickening capability of the copolymer.7 It was observed that the greater the ηR, the better thickening capability.
| ηR = ηmix/ηCO2 | (2) |
Molecular dynamics simulation
The Material Studio (MS) package was used to simulate the systems of CO2, polymers and polymer–CO2. All the force field parameters of CO2 and polymers were determined by the COMPASS force field.53 The constructed molecules of CO2 and polymer chains were optimized by the Smart Minimizer in the Discover module of MS. Five-cycle annealing calculations from 300 to 500 K in the Forcite module were carried out to delay the systems effectively.17,54 The MD simulation process was done in a run time of 2 ns with a time step of 1 fs by using the NPT ensemble at 308.2 K and 25 MPa. The temperature was controlled by the Andersen method55 and the pressure was controlled by the Berendsen method.56 The Lennard-Jones 9–6 potential was used to perform the van der Waals interaction; meanwhile, the electrostatic interaction was examined by the coulombic term. The last 500 ps were used for the analysis.Three kinds of systems were simulated by MD, respectively, the system with 2000 molecules of CO2, the system with four copolymer chains, and the polymer–CO2 system with four polymer chains and 2000 molecules of CO2. Considering the effect of molecular weight of the copolymer on the thermodynamic properties and the accuracy of the simulation results together,57,58 the PHFDA chain consisted of 10 HFDA repeating units, the PHFDA–0.219St chain consisted of 2 St repeating units and 7 HFDA repeat units, the PHFDA–0.299St chain consisted of 3 St repeating units and 7 HFDA repeating units, the PHFDA–0.501St chain consisted of 6 St repeating units and 6 HFDA repeating units, and the PHFDA–0.702St chain consisted of 12 St repeating units and 5 HFDA repeating units, to ensure that the molecular weights of different polymer chains are close to one another. The different systems of the simulation were shown in Table 1.
| System | Composition | Mn of one chain | Number of chains | Number of HFDA units | Number of St units | Number of CO2 |
|---|---|---|---|---|---|---|
| 1 | CO2 | 2000 | ||||
| 2 | CO2 + PHFDA–0.702St | 3855 | 4 | 5 | 12 | 2000 |
| 3 | CO2 + PHFDA–0.501St | 3729 | 4 | 6 | 6 | 2000 |
| 4 | CO2 + PHFDA–0.299St | 3941 | 4 | 7 | 3 | 2000 |
| 5 | CO2 + PHFDA–0.219St | 3837 | 4 | 7 | 2 | 2000 |
| 6 | CO2 + PHFDA | 4147 | 4 | 8 | 0 | 2000 |
| 7 | PHFDA–0.702St | 3855 | 4 | 5 | 12 | |
| 8 | PHFDA–0.501St | 3729 | 4 | 6 | 6 | |
| 9 | PHFDA–0.299St | 3941 | 4 | 7 | 3 | |
| 10 | PHFDA–0.219St | 3837 | 4 | 7 | 2 | |
| 11 | PHFDA | 4147 | 4 | 8 | 0 |
Results and discussion
The composition, intrinsic viscosity and surface tension measurement results of the four copolymers and PHFDA samples synthesized in this paper were shown in Table 2.| Polymer | Content of styrene (mol%) | Intrinsic viscosity (g mL−1) | γ (mN m−1) |
|---|---|---|---|
| PHFDA–0.702St | 70.2 | 166.7 | 35 |
| PHFDA–0.501St | 50.1 | 159.3 | 32 |
| PHFDA–0.299St | 29.9 | 161.5 | 29 |
| PHFDA–0.219St | 21.9 | 154.5 | 28 |
| PHFDA | 0 | 168.6 | 26 |
Solubility of copolymers in SC-CO2
Fig. 1 showed the cloud point pressures of the five polymers in SC-CO2 at 308.2 K with mass concentration (a) and the styrene molar ratio at 1 wt% of polymer (b), respectively. When the molar ratio of styrene reaches 70.2%, the maximum mass concentration of this copolymer dissolved in CO2 was 1% at the pressure of 30 MPa. As shown in Fig. 1(a), the cloud point pressures of the five polymers in SC-CO2 increased with increase of mass concentration. The differences of intrinsic viscosity which reflects the molecular weight of polymer between the five polymer samples was small as shown in Table 2, the effect of molecular weight on cloud point pressure can be ignored. So the data in Fig. 1(a) also reflected the influence of styrene molar ratio, as shown in Fig. 1(b). With the increase in the molar ratio of styrene, the cloud pressure of the copolymer in SC-CO2 increased rapidly. It could be inferred that the introduction of styrene into PHFDA may be unfavourable to the solubility of the polymer in SC-CO2.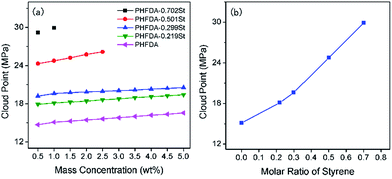 | ||
| Fig. 1 Cloud point pressures of the five polymers in SC-CO2 at 308.2 K versus mass concentration (a) and the styrene molar ratio at 1 wt% of polymer (b). | ||
In CO2–polymer system, the strong polymer–CO2 interaction is prerequisite for the polymer to be dissolved in CO2. The strength of the intermolecular interactions could be characterized by intermolecular interaction energy. The greater the absolute value of the polymer–CO2 interaction energy, the greater the CO2-philicity of the polymer. In order to compare the effect of the introduction of styrene on the CO2-philicity of copolymers quantitatively, the interaction energies between polymer chains and CO2 of systems 2–5 in Table 1 were examined with the eqn (3)17
| Einter = −Ebinding = Echain−CO2 − (Echain + ECO2) | (3) |
The results were shown in Table 3. The interaction energy of PHFDA with CO2 was significantly larger than those of the four copolymers. With the increase in styrene content of the copolymers, the absolute value of the interaction energy of the copolymers with CO2 became smaller. This indicated that the introduction of styrene into PHFDA reduced the intermolecular interaction strength of polymer–CO2, and the debilitated polymer–CO2 interaction decreased the CO2-philicity of the copolymers.
| System | Echain−CO2 | Echain | ECO2 | Einter |
|---|---|---|---|---|
| PHFDA + CO2 | −3666.75 | −1137.35 | −1820.52 | −708.88 |
| PHFDA–0.219St + CO2 | −3296.59 | −850.28 | −1848.62 | −597.69 |
| PHFDA–0.299St + CO2 | −3165.67 | −724.84 | −1866.61 | −574.22 |
| PHFDA–0.501St + CO2 | −2713.58 | −338.47 | −1853.51 | −521.60 |
| PHFDA–0.702St + CO2 | −2533.58 | −114.60 | −1939.61 | −479.37 |
The solubility of polymer in CO2 does not only depend on the polymer–CO2 interaction, but also is related to the polymer–polymer interaction. The high solubility of polymer in CO2 requires strong polymer–CO2 interaction, and weak polymer–polymer interaction which could be described by the low surface tension.32,33 The surface tension of the polymer is related to its Cohesive Energy Density (CED) and solubility parameter. The CED and solubility parameter describe the interactive strength of polymer–polymer, which is consistent with the trend of the intermolecular interactions. Previous studies have shown that polymers with higher solubility in CO2 tend to show lower surface tension and CED.59 The low surface tension is favourable to the solvation of the polymer in SC-CO2 and improves thermodynamic stability of the mixture. According to the similarity principle of solubility parameter, the smaller the solubility parameter difference |Δδ| between the polymer and the CO2, the better the miscibility of the polymer with CO2. The CED and solubility parameters of systems 1 and 7–11 in Table 1 obtained by the MD simulation were shown in Table 4. The δ of CO2 obtained by MD simulation at 25 MPa and 308.2 K was 14.02, which is slightly lower than the result of Ohashi60 (14.3 at 20 MPa and 318 K) and higher than that of Liu17 (13.15 at 20 MP and 298 K). The solubility parameter of PHFDA was closest to CO2 and its cloud point was also the lowest among the five polymers. With the increase in the molar ratio of styrene in the copolymers, the CED of the copolymers increased gradually, indicating that the polymer–polymer interactions increased gradually. The results were consistent with the results of the surface tension shown in Table 1. Therefore, it can be concluded that the introduction of CO2-phobic styrene reduced the polymer–CO2 interaction and enhanced the polymer–polymer interaction, which disfavoured the dissolution of the polymer in SC-CO2 and resulted in the increase of the cloud point pressures.
| System | Density (g cm−3) | ecoh (J m−3) | δ ((J cm−3))1/2 | |Δδ| ((J cm−3))1/2 |
|---|---|---|---|---|
| a Notice: |Δδ| = |δpolymer − δco2|. | ||||
| PHFDA | 1.69 | 2.15 × 10⁸ | 14.67 | 0.65 |
| PHFDA–0.219St | 1.64 | 2.21 × 10⁸ | 14.88 | 0.86 |
| PHFDA–0.299St | 1.62 | 2.24 × 10⁸ | 14.97 | 0.95 |
| PHFDA–0.501St | 1.53 | 2.34 × 10⁸ | 15.30 | 1.28 |
| PHFDA–0.702St | 1.40 | 2.43 × 10⁸ | 15.59 | 1.57 |
| CO2 | 0.909 | 1.97 × 10⁸ | 14.02 | 0 |
Thickening mechanism of copolymers in SC-CO2
Fig. 2 showed the variation of relative viscosities of the polymers in SC-CO2 at 308.2 K and 30 MPa with mass concentration (a) and styrene molar ratio at 1 wt% of polymer (b), respectively. Although the introduction of styrene increased the cloud point pressure of the polymer in SC-CO2, the experimental results illustrated in Fig. 2(a) indicated that all the copolymers emerged better thickening abilities than PHFDA, and PHFDA–0.299St which exhibited the best thickening effect could increase the viscosity of SC-CO2 by 352 times at the concentration of 5 wt%. As shown in Fig. 2(b), the effect of the styrene molar ratio on the thickening capability of the copolymers was not monotonically increasing or decreasing, but there existed an optimal value. It is widely known that the compounds containing phenyl groups tend to produce intermolecular association through π–π stacking. So we inferred that the π–π stacking between styrene groups played a key role7 in thickening SC-CO2 and the styrene content of the copolymers with the best thickening capability might be about 29.9 mol%. The connection of the microstructures with the copolymers thickening effects was researched below using conformation snapshots and RDF obtained by MD simulation. The role of styrene and π–π stacking on the thickening capability were confirmed.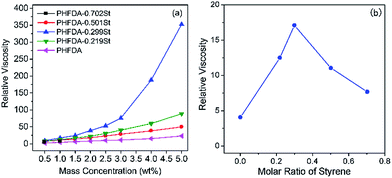 | ||
| Fig. 2 Relative viscosities of the five polymers in SC-CO2 at 308.2 K and 30 MPa versus mass concentration (a) and the styrene molar ratio at 1 wt% of polymer (b). | ||
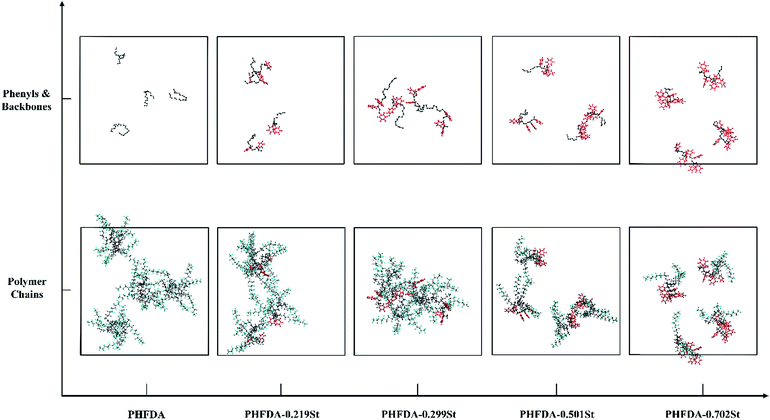
The equilibrium conformations of MD simulation for the five polymer–CO2 systems were shown in Fig. 3. The CO2 molecules were hidden to highlight the polymer chains. The phenyl group atoms were marked as red, the backbone atoms were marked as black. The most pronounced intermolecular association was initiated by PHFDA–0.299St, which formed effective molecular aggregates through π–π stacking61 and enhanced the viscosity of SC-CO2 significantly as shown in Fig. 2(a). The lack of intermolecular association of the PHFDA chains led to slight molecular aggregate, although the chains were very stretch, indicating high miscibility with SC-CO2. PHFDA–0.219St with lower styrene content showed less inter-chain associations. For PHFDA–0.501St and PHFDA–0.702St with higher styrene contents, the crispation of molecular chains resulted in less inter-chain π–π stacking and more intra-chain π–π stacking. Thickening performances of the three copolymers were not as good as PHFDA–0.299St.
To further study the microstructure of the polymer–CO2 systems, radial distribution functions (RDFs) of the systems 2–6 in Table 1 were investigated. The RDF reflects the molecular aggregation characteristics of the system.62,63 The statistical results for C–C pairs of the phenyl groups are shown in Fig. 4. The values of RDF of the four copolymer–CO2 systems increased from the value of zero at about 2.9 Å, which indicated that the intermolecular interactions of the copolymer chains was dominated by van der Waals. The RDF curve peak value of PHFDA–0.299St was the highest and also consistent with the equilibrium conformations in Fig. 3. The strongest peak appeared at the distance of 4.9 Å which is the most feasible distance between C–C of phenyl groups. The RDF curve peak values of PHFDA–0.219St and PHFDA–0.501St were relatively low and appeared at the farther distances of 6.9 Å and 10.3 Å. The above results were in agreement with the equilibrium conformations and experimental results of thickening effect evaluation.
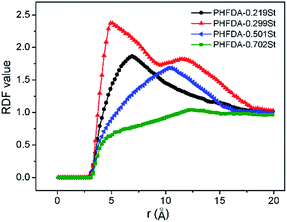 | ||
| Fig. 4 Radial distribution functions of the intermolecular carbon–carbon pairs of the copolymers phenyl groups. | ||
The ideal thickening agents should not only exhibit high solubility but also have the capability to enhance the viscosity significantly through intermolecular association in supercritical CO2. For the St–HFDA copolymers, the CO2-philic HFDA group helps to improve the solubility while the CO2-phobic St group contributes to the thickening capability for SC-CO2. The π–π stacking of styrene groups played the major role in thickening SC-CO2 by allowing the copolymer chains to aggregate effectively. The styrene content of the copolymers should be optimized to achieve a balance between solubility and thickening capability in SC-CO2, and ensure the dissolution and optimum thickening capability of the copolymer in SC-CO2.
Conclusions
In this paper, the optimum composition of St–HFDA copolymer with the highest thickening capability in SC-CO2 was obtained. The influence of the intermolecular interactions of copolymer–CO2 and copolymer–copolymer on the solubility and thickening capability of copolymers in SC-CO2 were examined. The he subtle relationships that exist among different group contents of the copolymers and intermolecular interactions were evaluated. This work provided a meaningful strategy for studying the solubility and thickening mechanism of the copolymers in SC-CO2 by combining MD simulation and experiment, which was instructive to the molecular design of SC-CO2 thickening agents. Microcosmic understanding of the intermolecular interactions in CO2–polymer systems can provide guidance for the design and optimization of polymer thickeners. It was found that:(1) The solubility of the St–HFDA copolymer in SC-CO2 decreased with the increase in styrene content. The existence of styrene weakened the CO2-philicity of the copolymer by reducing the polymer–CO2 interaction and increasing polymer–polymer interaction.
(2) According to the MD simulation results, the π–π stacking between the styrene groups enlarged the copolymer–copolymer interactions and promoted the formation of intermolecular crosslinks effectively. The optimum styrene molar ratio was about 29.9% for the copolymer thickening capability.
(3) The contents of the CO2-philic HFDA group and the CO2-phobic St group of the St–HFDA copolymer should be optimized to provide enough polymer–CO2 interaction and moderate polymer–polymer interaction, which allowed the copolymer to achieve optimum thickening capability in the premise of dissolved in SC-CO2.
Conflict of interest
The authors declare no competing financial interests.Acknowledgements
The authors acknowledge the support from the Key Program of National Natural Science Foundation of China (No. U1262202) and the National Key Basic Research and Development Program of China (973 Program, No. 2015CB251200).References
- S. Jikich, J. Pet. Technol., 2012, 64(7), 28–31 CrossRef CAS.
- L. Hou, B. Sun, X. Geng, T. Jiang and Z. Wang, J. Supercrit. Fluids, 2017, 120, 173–180 CrossRef CAS.
- L. Hou, B. Sun, Z. Wang and Q. Li, J. Supercrit. Fluids, 2015, 100, 121–128 CrossRef CAS.
- J. Xu, A. Wlaschin and R. M. Enick, SPE J., 2003, 8(2), 85–91 CrossRef CAS.
- J. P. Heller, D. K. Dandge, R. J. Card and L. G. Donaruma, SPE J., 1985, 25(5), 679–686 CrossRef CAS.
- X. Sun, Z. Wang, B. Sun and W. Wang, J. Nat. Gas Sci. Eng., 2016, 33, 1390–1401 CrossRef CAS.
- Z. Huang, C. Shi, J. Xu, S. Kilic, R. M. Enick and E. J. Beckman, Macromolecules, 2000, 33(15), 5437–5442 CrossRef CAS.
- L. L. Williams, J. B. Rubin and H. W. Edwards, Ind. Eng. Chem. Res., 2004, 43(16), 4967–4972 CrossRef CAS.
- R. D. Lousenberg and M. S. Shoichet, Macromolecules, 2000, 33(5), 1682–1685 CrossRef CAS.
- F. R. Ancisa, J. Phys. Chem., 1954, 58, 1099–1114 CrossRef.
- Z. Guan, J. R. Combes, Y. Z. Menceloglu and J. M. Desimone, Macromolecules, 1993, 26, 2663–2669 CrossRef CAS.
- R. M. Enick, D. Olsen, J. Ammer and W. Schuller, presented in part at the Eighteenth SPE Improved Oil Recovery Symposium, Tulsa, Oklahoma, USA, April 2012 Search PubMed.
- J. M. Desimone, Z. Guan and C. S. Elsbernd, Science, 1992, 257, 945–947 CAS.
- C. L. Bray, B. Tan, S. Higgins and A. I. Cooper, Macromolecules, 2010, 43(22), 9426–9433 CrossRef CAS.
- D. Denney, J. Petro. Technol., 2013, 65(1), 89–91 CrossRef.
- J. H. Bae and C. A. Irani, SPE. Adv. Tech., 1993, 1(1), 166–171 CrossRef.
- D. Hu, S. Sun, P. Yuan, L. Zhao and T. Liu, J. Phys. Chem. B, 2015, 119, 3194–3204 CrossRef CAS PubMed.
- S. Kilic, Y. Wang, J. K. Johnson, E. J. Beckman and R. M. Enick, Polymer, 2009, 50, 2436–2444 CrossRef CAS.
- G. Luna-Bárcenas, S. Mawson, S. Takishima, J. M. DeSimone, I. C. Sanchez and K. P. Johnston, Fluid Phase Equilib., 1998, 146, 325–337 CrossRef.
- J. B. McClain, D. Londono, J. R. Combes, T. J. Romack, D. A. Canelas, D. E. Betts, G. D. Wignall, E. T. Samulski and J. M. DeSimone, Neuroradiology, 1996, 118, 917–918 CAS.
- S. Kilic, S. Michalik, Y. Wang, J. K. Johnson, R. M. Enick and E. J. Beckman, Ind. Eng. Chem. Res., 2003, 42, 6415–6424 CrossRef CAS.
- M. J. O'Brien, R. J. Perry, M. D. Doherty, J. J. Lee, A. Dhuwe, E. J. Beckman and R. M. Enick, Energy Fuels, 2016, 30, 5990–5998 CrossRef.
- C. Shi, Z. Huang, E. J. Beckman, R. M. Enick, S.-Y. Kim and D. P. Curran, Ind. Eng. Chem. Res., 2001, 40(3), 908–913 CrossRef CAS.
- T. Sarbu, T. J. Styranec and E. J. Beckman, Ind. Eng. Chem. Res., 2000, 39, 4678–4683 CrossRef CAS.
- T. Sarbu, T. Styranec and E. J. Beckman, Nature, 2000, 405, 165–168 CrossRef CAS PubMed.
- Y. Wang, L. Hong, D. Tapriyal, I. C. Kim, I.-H. Paik, J. M. Crosthwaite, A. D. Hamilton, M. C. Thies, E. J. Beckman, R. M. Enick and J. K. Johnson, J. Phys. Chem. B, 2009, 113, 14971–14980 CrossRef CAS PubMed.
- A. Cece, S. H. Jureller, J. L. Kerschner and K. F. Moschner, J. Phys. Chem., 1996, 100, 7435–7439 CrossRef CAS.
- B. Baradie, M. S. Shoichet, Z. Shen, M. A. McHugh, L. Hong, Y. Wang, J. K. Johnson, E. J. Beckman and R. M. Enick, Macromolecules, 2004, 37, 7799–7807 CrossRef CAS.
- P. Raveendran and S. L. Wallen, J. Am. Chem. Soc., 2002, 124, 7274–7275 CrossRef CAS PubMed.
- P. Raveendran and S. L. Wallen, J. Phys. Chem. B, 2003, 107, 1473–1477 CrossRef CAS.
- J. R. Fried and N. Hu, Polymer, 2003, 44, 4363–4372 CrossRef CAS.
- E. Girard, T. Tassaing, C. Ladaviere, J.-D. Marty and M. Destarac, Macromolecules, 2012, 45, 9674–9681 CrossRef CAS.
- E. Girard, T. Tassaing, S. Camy, J.-S. Condoret, J.-D. Marty and M. Destarac, J. Am. Chem. Soc., 2012, 134, 11920–11923 CrossRef CAS PubMed.
- H. Lee, J. W. Pack, W. Wang, K. J. Thurecht and S. M. Howdle, Macromolecules, 2010, 43, 2276–2282 CrossRef CAS.
- B. Lavi, A. Marmur and J. Bachmann, Langmuir, 2008, 24, 1918–1923 CrossRef CAS PubMed.
- Y. Tamai, T. Matsunaga and K. Horiuchi, J. Colloid Interface Sci., 1977, 60(1), 112–116 CrossRef CAS.
- K. Katoh, T. Yu, M. Yamamoto, T. Azuma and H. Fujita, J. Colloid Interface Sci., 1998, 202(1), 54–62 CrossRef CAS.
- R. M. Enick, E. J. Beckman, A. Yazdi, V. Krukonis, H. Schonemann and J. Howell, J. Supercrit. Fluids, 1998, 13, 121–126 CrossRef CAS.
- B. Tan, C. L. Bray and A. I. Cooper, Macromolecules, 2009, 42, 7945–7952 CrossRef CAS.
- H. S. Byun and T. H. Choi, J. Appl. Polym. Sci., 2002, 86, 372–380 CrossRef CAS.
- Z. Wang, B. Sun, X. Sun, H. Li and J. Wang, Greenhouse Gases: Sci. Technol., 2015, 5, 1–11 CrossRef.
- H. Matsuda, H. Yamamoto, K. Kurihara and K. Tochigi, Fluid Phase Equilib., 2007, 261, 434–443 CrossRef CAS.
- J. L. Sutterby, AIChE J., 1966, 12(1), 63–68 CrossRef CAS.
- C. Boned, M. Moha-Ouchane, A. Allal and M. Benseddik, Int. J. Thermophys., 1998, 19(5), 1325–1341 CrossRef CAS.
- Z. Fang, Y. Qiao, Z. Di, Y. Huo, P. Ma and S. Xia, J. Chem. Eng. Data, 2008, 53(12), 2787–2792 CrossRef CAS.
- D. Papaioannou, M. Bridakis and C. G. Panayiotou, J. Chem. Eng. Data, 1993, 38(3), 370–378 CrossRef CAS.
- J. H. Dymond, K. J. Young and J. D. Isdale, Int. J. Thermophys., 1980, 1(4), 345–373 CrossRef CAS.
- R. Malhotra, W. E. Price, L. A. Woolf and A. J. Easteal, Int. J. Thermophys., 1990, 11(5), 835–861 CrossRef CAS.
- Y. Qiao, S. Xia and P. Ma, J. Chem. Eng. Data, 2008, 53(1), 280–282 CrossRef CAS.
- Z. Fang, Y. Qiao, Z. Di, Y. Huo, P. Ma and S. Xia, J. Chem. Eng. Data, 2008, 53(12), 2787–2792 CrossRef CAS.
- Y. Qiao, Y. Ma, Y. Huo, P. Ma and S. Xia, J. Chem. Thermodyn., 2010, 42, 852–855 CrossRef CAS.
- Y. Qiao, Z. Di, Y. Ma, P. Ma and S. Xia, Chin. J. Chem. Eng., 2010, 18(3), 446–454 CrossRef CAS.
- H. Sun, J. Phys. Chem. B, 1998, 102, 7338–7364 CrossRef CAS.
- D. N. Theodorou and U. W. Suter, Macromolecules, 1986, 19, 139–154 CrossRef CAS.
- H. C. Andersen, J. Chem. Phys., 1980, 72(4), 2384–2393 CrossRef CAS.
- H. J. C. Berendsen, J. P. M. Postma, W. F. V. Gunsteren, A. Dinola and J. R. Haak, J. Chem. Phys., 1984, 81, 3684–3690 CrossRef CAS.
- D. Hu, Y. Zhang, M. Su, L. Bao, L. Zhao and T. Liu, J. Supercrit. Fluids, 2016, 118, 96–106 CrossRef CAS.
- D. Hu, S. Sun, P. Yuan, L. Zhao and T. Liu, J. Phys. Chem. B, 2015, 119, 12490–12501 CrossRef CAS PubMed.
- Y. Marcus, J. Supercrit. Fluids, 2006, 38, 7–12 CrossRef CAS.
- J. Ougiyanagi, Y. Meguro, Z. Yoshida, H. Imura and K. Ohashi, Talanta, 2003, 59, 1189–1198 CrossRef PubMed.
- C. A. Hunter and J. K. M. Sanders, J. Am. Chem. Soc., 1990, 112, 5525–5534 CrossRef CAS.
- T. C. Clancy and W. L. Mattice, Macromolecules, 2001, 34, 6482–6486 CrossRef CAS.
- P. Gestoso and J. Brisson, Polymer, 2003, 44, 2321–2329 CrossRef CAS.
| This journal is © The Royal Society of Chemistry 2017 |

