 Open Access Article
Creative Commons Attribution 3.0 Unported Licence
Moisture and thermal expansion properties and mechanism of interaction between ions of a Nafion-based membrane electrode assembly†
C. Feng a and
P. F. He
 *b
*b
aSchool of Materials Science and Engineering, Shanghai Key Lab of Metal Functional Materials, Tongji University, Shanghai 201804, China
bSchool of Aerospace Engineering and Applied Mechanics, Tongji University, Shanghai 200092, China. E-mail: ph232@tongji.edu.cn
First published on 11th July 2017
Abstract
A membrane electrode assembly (MEA) is a multi-layer composite material. The different water and thermal expansion properties in MEA layers easily lead to delamination and electrode cracks, greatly decreasing the cell performance. Based on commonly used materials, we establish molecular models, investigate the coefficients of moisture and thermal expansion, and explore the diffusion mechanism and interaction behaviors of various particles. The effects of system size, oligomer chain length, and catalyst size and content are discussed. The moisture expansion properties of the membrane are verified by experimental results obtained with Nafion® 117. The differences in moisture and thermal expansion between layers can be reduced by decreasing the chain length of the oligomer and the size and content of Pt in the catalyst layer; increasing the chain length of the oligomer in the membrane; and controlling the working temperature at approximately 320 or 358 K. The introduction of Pt and graphene is also found to prevent the diffusion of water molecules and decrease water connectivity.
1. Introduction
With the increasing demand for clean energy technology and research, polymer electrolyte membrane fuel cells (PEMFCs) have undergone rapid development in recent years. Although related products have been put into production, poor durability remains a major obstacle limiting their commercialization. The membrane electrode assembly (MEA) is the most important part of a PEMFC, and its system updates at the transfer process of electrons, protons, and water, determining the electrochemical reactions and cell performance.1,2 During the long-term moisture-heat cyclic loading process, the interior of the MEA is easily subjected to mechanical damage, greatly affecting the durability of the PEMFC.3 The delamination of the electrodes and proton-exchange membrane is the main reason for MEA failure.4–6 MEA durability is affected by the preparation method7,8 along with the contents of the catalyst support, binder and ionomer.9 Some studies considered that the electrodes and proton-exchange membrane have different water and thermal expansion properties, and the unsynchronized bending and stretching of the materials in the MEA layers cause the uneven distribution of internal stress and stress concentration, leading to the splitting of the membrane from the electrode.10–12 However, to our knowledge, further studies on the water and thermal expansion properties have not been reported. Therefore, it is worth exploring the mechanism of damage and methods to eliminate or reduce the differences in expansion properties between layers.With the complexity of the work environment and limitations on MEA size, it is difficult to directly and precisely measure MEA properties using conventional macroscopic techniques and methods. In recent years, microscopic observation has become an important research tool for membranes and electrodes.13–17 For example, Shi et al. studied the tensile stress–strain response and change in microstructure of a membrane (Nafion® 212) in water-immersed conditions; they found that with increasing temperature and water uptake, the domains of the membrane became ordered and remained stable at approximately 60 °C.14 Further, Friedmann and Nguyen reported that PEMFC performance can be improved by optimizing the microstructure and composition of the cathode catalyst layer; they found that a certain amount of Nafion was needed to create a continuous ionic phase, while excessive Nafion led to poor oxygen diffusivity or particle insulation.15 Xie et al.17 found that platinum particles aggregated easily during the early period of PEMFC operation, and ionic polymers were prone to network reconfiguration in the late stage, both of which decreased PEMFC durability. These experimental studies provide a clear understanding of the microstructures of MEA and each of its layers. Computational and modeling methods are another type of accessible analysis tool, particularly for materials that are hard to measure directly. Based on the experimental data of polarization curves under controlled temperature, gas back pressure and humidity, Guarnieri et al. explored stochastic optimizers for the identification of multiple physical parameters via in situ measurements; the results can be used in the performance evaluation and optimization of fuel cells.18 Molecular dynamics (MD) simulation can also elaborate effective factor calculation to compare distinct designs and compositions of MEA layers in terms of performance effects. MD has the great advantages of predicting the time evolution of the system involving interacting atoms and providing insights into microscale structural correlations. This technique has been applied to study the thermo-mechanical properties of polymer-based compounds,19,20 the microstructure of a hydrated perfluorosulphonic acid (PFSA) membrane,21–23 and composite catalyst layers.24–26 The results provide significant insights for comparing the designs and compositions of active layers in terms of their effects on performance.
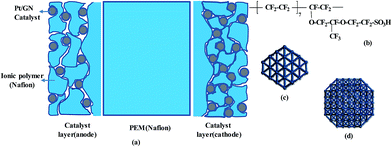
This work employs MD simulations to study the moisture and thermal expansion properties of MEA layers and aims to supply a theoretical basis for understanding their effect mechanism. The main components of the study are: (1) establishing the model of an MEA, which is composed of an anode catalyst layer, a membrane, and a cathode catalyst layer; (2) investigating the coefficients of moisture and thermal expansion of each MEA layer; (3) verifying the simulation results through a membrane layer experiment; and (4) studying the interaction mechanism of various ions in MEA layers by analyzing their dynamic diffusion processes and relative concentrations.
2. Methods and background
2.1 Model establishment
Based on commonly used materials, the models of MEA layers are established. Nafion is considered as the membrane sample owing to its excellent proton conductivity, water uptake, and mechanical characteristics. It is currently the most successful commercially applied membrane and it is often used for comparison with new membrane materials.27–29 Platinum (Pt) is used as the catalyst and graphene (GN) as the catalyst support. Compared to carbon black, GN can greatly increase the durability and Pt-extended electrochemical surface area.30–32 Nafion solution is used as the binder, and its compound with Pt/GN is used as the electrode (catalyst layer, CL) material. The nanoscale structures of the membrane and CL have been well documented.17,33–35 Based on these reports, we construct a molecular model of each MEA layer, as shown schematically in Fig. 1a.Nafion oligomer, consisting of five or ten monomers, is used for the membrane model. The chemical structure of the oligomer is shown in Fig. 1b. The CL has a multi-layer structure in which each layer is formed by GN-supported platinum and Nafion oligomers; two Pt nanoparticles with sizes of 0.2 and 1.6 nm are chosen (see Fig. 1c and d) with contents of 20–30 wt%. A four-layer GN support is used to enhance the binding strength with Pt particles compared to a support with fewer layers. The choices of Pt size, structure, and number of GN layers are explained in our previous work.36 The parameters of our models are listed in Table 1. These models are in a dry state. To differentiate these models from those in a wet environment, they are marked with the subscript ‘dry’. The effects of different sizes (Memdry I, II, and III), chain lengths (Memdry IV and CLdry IV with ten monomers), and Pt contents (CLdry I and I* for 20.3 wt%, CLdry II and II* for 29.2 wt%, and CLdry III for 25.1 wt%) are considered. The ratio of Nafion to GN-supported Pt catalyst was attributed to the ionomer/carbon weight ratio (I/C).
| Type | Model | Nc | Nm | DPt (nm) | Thickness (nm) | Nafion (wt%) | Pt (wt%) | Carbon (wt%) | I/C | Atom number |
|---|---|---|---|---|---|---|---|---|---|---|
| a Nc is the number of oligomer chains, Nm is the number of monomers in each chain, and DPt is the diameter of the Pt particles. | ||||||||||
| Memdry | I | 16 | 5 | 8.5 | 100 | 0 | 0 | 5552 | ||
| II | 32 | 5 | 8.5 | 100 | 0 | 0 | 11![[thin space (1/6-em)]](https://www.rsc.org/images/entities/char_2009.gif) 104 104 |
|||
| III | 64 | 5 | 8.5 | 100 | 0 | 0 | 22![[thin space (1/6-em)]](https://www.rsc.org/images/entities/char_2009.gif) 208 208 |
|||
| IV | 16 | 10 | 8.5 | 100 | 0 | 0 | 11![[thin space (1/6-em)]](https://www.rsc.org/images/entities/char_2009.gif) 072 072 |
|||
| CLdry | Ia | 16 | 5 | 1.2 | 4.3 | 67.3 | 20.3 | 12.4 | 2 | 4003 |
| I | 32 | 5 | 1.2&1.2 | 4.3 | 67.3 | 20.3 | 12.4 | 2 | 8006 | |
| II | 32 | 5 | 1.6&1.6 | 5.2 | 55.9 | 29.2 | 14.9 | 1.3 | 8828 | |
| IIa | 16 | 5 | 1.6 | 5.2 | 55.9 | 29.2 | 14.9 | 1.3 | 4414 | |
| III | 32 | 5 | 1.2&1.6 | 5.2 | 61 | 25.1 | 13.9 | 1.6 | 8417 | |
| IV | 16 | 10 | 1.6&1.6 | 5.2 | 55.8 | 29.2 | 15 | 1.3 | 8810 | |
The initial configuration of the CL system is obtained from the following procedure. Pt nanoparticles are initially placed onto the GN support, and the distance between each pair of adjacent particles is set within the cut-off distance. Energy minimization is performed to allow some deformations on the GN surface and close combination with Pt particles. Subsequently, various components such as Nafion oligomers, water, and hydronium ions (in wet environment) are mixed randomly in a tetragonal lattice with different individual contents. Each system has similar thickness in the z direction (i.e., the lattice parameter c). Thus, the system size mainly depends on the other two directions (x and y). The thickness of the membrane (85 Å) is approximately two times that of the CL thickness (43 Å for CL I and 52 Å for CL II). In general, the length scales of the MEA layers are on the order of ten micrometer in the experiments. In the present study, smaller length scales are used so that the ratios of thickness between each layer are similar to those of the experimental analogue. The effect of length scale is discussed in Section 3.1.
In a wet environment, all oligomers in each MEA layer are considered to be completely ionized, and hydronium ions (H3O+) are used as the counterion to sulfonate ions (SO3−) for the sake of electroneutrality. Different hydration levels λ (H2O/HSO3) are examined to reflect various water contents. The detailed compositions are listed in Table 2. Water contents ranging from 1.6 wt% (λ = 1) to 21.1 wt% (λ = 17) are modeled for the membrane system, 1.6–12.1 wt% for CLwet I (DPt = 1.2 nm), and 0.9–16.2 wt% for CLwet II (DPt = 1.6 nm). These models are indicated by the subscript ‘wet’. A minimum hydrated state of λ = 2–3 is known to be necessary for proton to be dissociated in Nafion membrane.37 In our model with smaller length, the proximity of SO3− groups is reduced; thus, proton dissociation can be viewed as starting as low as λ = 1. This assumption was also used in an MD study of 3 M PFSAs.38
| λ | H2O (n) | H3O+ (n) | Water (wt%) | Pt (wt%) | Nafion (wt%) | Atom number | |
|---|---|---|---|---|---|---|---|
| Memwet | 1 | 0 | 160 | 1.6 | No Pt | 98.4 | 11![[thin space (1/6-em)]](https://www.rsc.org/images/entities/char_2009.gif) 584 584 |
| 4 | 480 | 160 | 6 | No Pt | 94 | 13![[thin space (1/6-em)]](https://www.rsc.org/images/entities/char_2009.gif) 024 024 |
|
| 7 | 960 | 160 | 10 | No Pt | 90 | 14![[thin space (1/6-em)]](https://www.rsc.org/images/entities/char_2009.gif) 464 464 |
|
| 10 | 1440 | 160 | 13.6 | No Pt | 86.4 | 15![[thin space (1/6-em)]](https://www.rsc.org/images/entities/char_2009.gif) 904 904 |
|
| 14 | 2080 | 160 | 18.1 | No Pt | 81.9 | 17![[thin space (1/6-em)]](https://www.rsc.org/images/entities/char_2009.gif) 824 824 |
|
| 17 | 2560 | 160 | 21.1 | No Pt | 78.9 | 19![[thin space (1/6-em)]](https://www.rsc.org/images/entities/char_2009.gif) 264 264 |
|
| CLwet I | 1 | 0 | 45 | 1.6 | 20.1 | 66.5 | 4138 |
| 4 | 135 | 45 | 4.1 | 19.4 | 64.5 | 4543 | |
| 6 | 225 | 45 | 5.9 | 19.1 | 63.2 | 4813 | |
| 9 | 360 | 45 | 8.7 | 18.5 | 61.4 | 5218 | |
| 13 | 540 | 45 | 12.1 | 17.8 | 59.1 | 5758 | |
| CLwet II | 1 | 0 | 45 | 0.9 | 29.0 | 55.3 | 4549 |
| 5 | 180 | 45 | 4.2 | 28.0 | 53.5 | 5089 | |
| 8 | 315 | 45 | 6.6 | 27.3 | 52.2 | 5494 | |
| 12 | 495 | 45 | 9.5 | 26.4 | 50.5 | 6034 | |
| 17 | 720 | 45 | 13 | 25.4 | 48.6 | 6709 | |
| 22 | 945 | 45 | 16.2 | 24.5 | 46.8 | 7384 |
2.2 Simulation details
Classical MD simulations are conducted using the commercial software Materials Studio. The Dreiding39 force field (FF) is used to describe the interactions between atoms in the membrane system. It is a generic FF and useful for predicting the dynamic and transport properties of proton-exchange membranes.40–42 However, the Dreiding FF is not appropriate for describing the interactions between Pt atoms and other atoms. The universal force field (UFF)43 is also a generic FF and has yielded satisfactory results in many systems, including Pt–carbon,36,44 Pt acetylide complex,45 metal–organic,46 and organic compound systems.47,48 In the present study, UFF is employed in the CL system. Similar to the Dreiding FF, UFF also uses general force constants and geometric parameters based on simple hybridization, and they both have approximate energy expressions and corresponding parameters for the interactions between atoms of the same type. The main difference is that UFF does not include a hydrogen-bonding term when describing the nonbonded interactions; the contribution of this term to the energy of our MEA systems is low compared to those of the valence, van der Waals and electrostatic interaction terms. Moreover, the difference between the two FFs has a negligible impact on the properties of moisture and thermal expansion, which are calculated from relative values, such as the changes in energy and volume (ΔE and ΔV, respectively), for the same system at different moisture levels or temperatures.The charge equilibration (QEq) algorithm is applied to assign partial atomic charges for H3O+ and SO3−. The cut-off distance for the calculation of van der Waals interactions is set to 18.5 Å, and coulombic interaction is evaluated using the Ewald method with a convergent criterion of 10−5 kcal mol−1. All systems are in the NPT ensemble with an external pressure of 0.1 GPa. For the systems in a dry environment, the Andersen49 thermostat method is used to control temperature and pressure, whereas the Nose thermostat and Berendsen barostat methods are applied for wet systems. GN substrates are held rigid. The hydronium ions are dissociated in both the membrane and CL systems.
After the initial configurations are constructed, energy minimization and cell optimization are performed under a pressure of 0.1 GPa. A 600 ps quench simulation is performed following by a geometric optimization step for each saved intermediate structure in the entire dynamic process. This combination can greatly accelerate the system equilibrium time compared to simple MD simulation. The data generated in the last 100 ps (for the last 40 saved optimized structures) are used for further analysis. The convergence criteria for judging a system to be in equilibrium are as follows: (1) the standard deviation (SD) of potential energy is less than 0.15%; and (2) the error in temperature, density and pressure are less than 1 K, 0.01 g cm−3 and 0.01 GPa, respectively, in comparison with the target values. If the above convergence conditions are not satisfied, the simulation continues until the data of the last 100 ps meet the conditions. Generally, the second simulation time is less than 200 ps. Finally, we choose the structure with the lowest potential energy as the equilibrated one.
Preliminary simulations with different times (500 ps, 1 ns, 2 ns, 4 ns, and 5 ns) and time steps (0.1, 0.2, 0.5, 1, and 2 fs) are first performed. The optimal time step is found to be approximately 0.5 fs, and the total simulation time is approximately 600 ps for the optimal computational efficiency and accuracy. These values are used in subsequent simulations. The computation time varies with the system size and hydration level. A system with high water content requires a significant amount of computation time, reaching 10 days in some cases. At least 10 configurations for each case are constructed, and we then choose one as the initial configuration as follows: (1) the potential energy has a lower value; (2) the density gradually decreases with water content, and its value falls in the range of the literature; (3) the thickness gradually increases with water content; (4) GN and Pt have a larger binding energy. The simulation technique, including FF, methods of pressure and temperature control, system configuration and equilibrium criteria, is chosen and confirmed according to the membrane experiment in this work and reports in the literature.
2.3 Model analyses and property calculations
The coefficient of thermal expansion (CTE), γV, is a function of temperature:| γV = (1/V0)*(ΔV/ΔT)P, | (1) |
The coefficient of moisture expansion (CME) was obtained by
| α = (1/V0)*(ΔV/ΔM)PT, | (2) |
The mean square displacement (MSD) is calculated based on the following equation:
 | (3) |
The relative concentration (RC) is calculated by computing the profile of atom density within evenly spaced slices along each axis:
| rc = (Nslab/Vslab)/(Nslab/Vsystem), | (4) |
2.4 Experimental measurement of membrane
The commercial product Nafion® 117, produced by Du Pont Company, has an equivalent weight (EW) of ∼1100 g mol−1, similar to that of our oligomer model (1143 g mol−1); thus, it is used to examine our simulation results in the wet environment. The experimental procedure is as follows.The membrane films were dried at 100 °C in a vacuum oven for 24 h. The dimensions (length, width, and thickness) and weights of the dry membranes were then accurately measured. The sample films were soaked in deionized water for different times (1 m, 3, 1 h, 3 h, and 24 h) at room temperature (298 K). Before measuring the lengths and weights of the hydrated membranes, the water was removed from the membrane surface. According to the recorded data, we calculated the corresponding water content, volume, density, CME and swelling ratio (volume). Three samples of Nafion 117 with the same length scale are measured, and the average values are used.
3. Results and discussion
3.1 Validation of membrane system
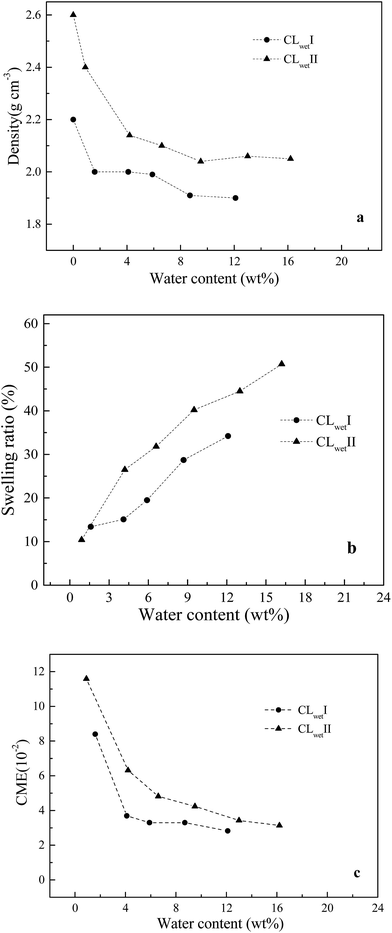
The density, swelling ratio and CME are investigated. The measured density of the Nafion® 117 dry sample is 1.95 g cm−3. The membrane models of Memdry I, II, III, and IV have densities of 1.88, 1.89, 1.89 and 1.87 g cm−3, respectively. The experimental value is slightly higher than the simulate value, which is mainly due to the discrepancy in oligomer number in the models. The simulation results also indicate that decreasing the chain length of the Nafion monomer and increasing the number of oligomer chains can enhance the system density. Fig. 2a depicts the relationship between system density and water content. Although the experimentally measured water contents are around 2.5% higher than the simulated values, both the experimental and simulated results indicate that the system density gradually decreases with increasing water content. Moreover, Fig. 2b and c show that the simulated swelling ratio and CME agree well with the experimental values. The model can better control the water content at the very low value (1.6 wt%) and the high value (21.1 wt%) compared to the experimental sample. CME is high (3.2 is10−2) in the initial wet stage, then decreases, and finally greatly increases with increasing water content, ranging from 1.1 i10−2 to 1.5 to10−2. At room temperature, Nafion® 117 has a minimum water uptake of approximately 4.2 wt% and a saturated water uptake of approximately 18.7 wt%. The saturated water uptake of the membrane corresponds to a swelling ratio of 28% in volume and 10.3% in length, similar to the results reported in the literature.27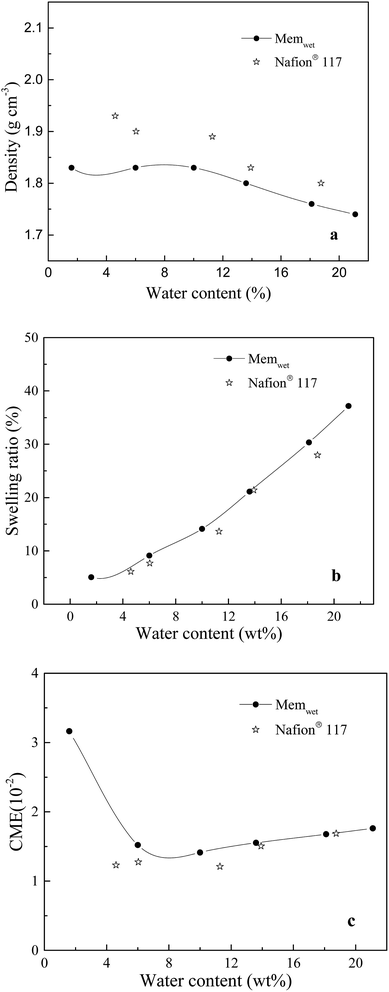 | ||
| Fig. 2 Relationships between water content and (a) density, (b) swelling ratio, (c) CME in the membrane system. | ||
Based on the above results, the membrane models with smaller length scales have less effect on the swelling ratio and CME (relative values), except for a slight effect on the system density. This result agrees well with the work of Kusoglu and Weber on the difference between thin (nm-thick) and thick films for PFSA ionomers.50
3.2 CL system
| Type | Eb (kcal mol−1) | |
|---|---|---|
| CLdry I* | 8.8 (Pt1.2) | |
| CLdry I | 16.84 (Pt1.2) | 18.12 (Pt1.2) |
| CLdry II* | 13 (Pt1.6) | |
| CLdry II | 23.18 (Pt1.6) | 25.27 (Pt1.6) |
| CLdry III | 16.87 (Pt1.6) | 12.26 (Pt1.2) |
| CLdry IV | 24 (Pt1.6) | 24.7 (Pt1.6) |
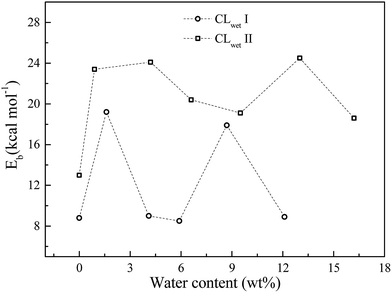
For the hydrated system, we investigate the effect of water content on the binding energy. As shown in Fig. 5, the binding energy of GN and Pt is calculated from the CL equilibrium structures at different water contents. The binding energy exhibits non-monotonic behavior as a function of water content (i.e., the humidity has a small effect on the binding energy compared to the initial configurations, where CLwet II has a larger binding energy than CLwet I at the same water content). This results demonstrate that compared to a humid environment, the initial configuration of the CL system, which mainly depends on the preparation method, has a larger influence on the binding energy of GN and Pt and also the catalyst efficiency and stability.
3.3 Coefficient of thermal expansion
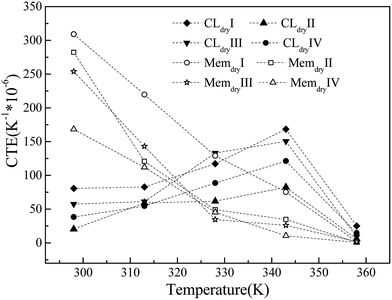
The CTEs of the membrane and CL systems are shown in Fig. 6. The CTE of the membrane system decreases linearly with increasing temperature and has a significant dependence on the chain length and system size. The membrane with the largest chain length (Memdry IV) has the lowest CTE value, and the membrane with the largest size (Memdry III) has the second-lowest CTE value. The CTE values (170 h10−6 to 310 to10−6 K−1 at 298 K) and decreasing trend are both similar to those of polytetrafluoroethylene.52 Nevertheless, the CTE of the CL shows a different trend. At the initial stage, it is lower than that of the membrane. It continuously increases with temperature up to 343 K and then decreases. In this process, the CTE values for the membrane and CL are similar at two temperatures: approximately 320 K (cross point) and 358 K, where the CLs have slightly larger values. This phenomenon is caused by the addition of Pt and GN, which have extremely low CTE values at low temperature. In particular, GN has a negative CTE value at 298 K, and the CTE values of GN increase steadily but slowly with temperature in the range of 298–400 K.53,54 However, the continuous decrease in the CTE of the Nafion oligomer resulted in a decrease in the CTE of the CL after 343 K. Thus, the CTE decreases with temperature in the range of 343–358 K. This result is similar to that reported in the literature55 for a temperature distribution of 343–350 K inside the MEA under a current of 0.3–0.7 V. It is also worth noting that for the CL system, the larger the Pt size and content, the smaller the CTE. Furthermore, the CL system with a long chain has a lower CTE and a flat change trend of CTE-temperature curve.The simulation results show that the differences in CTE values and inconsistent trends in the CTEs of the membrane and CL can be reduced by (1) decreasing the membrane CTE value and its change with temperature by increasing the chain length of the Nafion oligomer; (2) increasing the CTE values of CL layers by decreasing the Pt size, Pt content, and the oligomer chain length; (3) keeping the working temperature at approximately 320 or 358 K with little variation; and (4) using a novel, high-efficiency catalyst with a similar CTE curve as the binder in place of Pt/GN. The results also demonstrate that the changes in volume caused by differences in moisture content will have a much greater impact than temperature on the durability of the interface between the CL and the membrane.
3.4 Mean square displacement
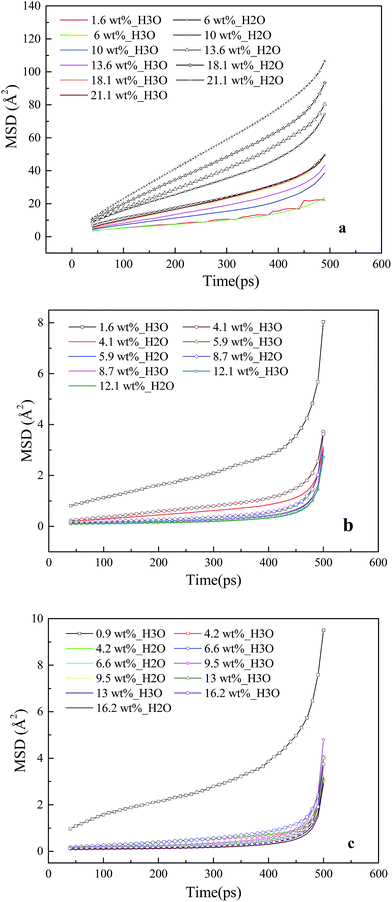
The dynamic properties of H3O+ and H2O particles in the membrane and CL systems at different hydration levels are investigated based on the MSD curve, as shown in Fig. 7. Fig. 7a shows that in the membrane system, the slopes for water molecules (line with the plus symbols) are consistently greater than those for hydronium ions (colored line) across the entire range of hydration, and both increase with water content. These trends are similar to those obtained by Cui et al.23 The diffusion coefficients are calculated within this period (40–500 ps). At a water content of 18 wt% (λ = 10), the diffusion coefficients are 2.3 = 10−6 cm2 s−1 for water molecules and 1.2 fo10−6 cm2 s−1 for hydronium ions. These values are less than the experimental values for Nafion 117,56 in agreement with a past study indicating that a thinner film ionomer exhibits lower diffusion.50The MSD curves for water molecules and hydronium ions in the CL systems are presented in Fig. 7b and c, where line with the plus symbol denotes the hydronium ions, and the colored line denotes water molecules. A large slope of the MSD curve is known to reflect high ion mobility. The MSD of the hydronium ions at low moisture (λ = 1) is larger than those of the others in the CL systems. This indicates that the mobility of the hydronium ions does not increase with increasing water content. In addition, the hydrophobicity of GN, which prevents the diffusion of water molecules and hydronium ions and decreases water connectivity,57,58 causes the slopes of the MSD curves of water molecules and hydronium ions in the CL systems to be considerably less than those in the membrane systems.
3.5 Concentration distribution
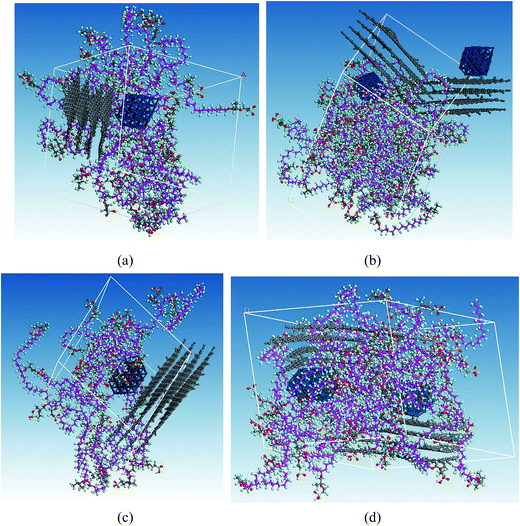
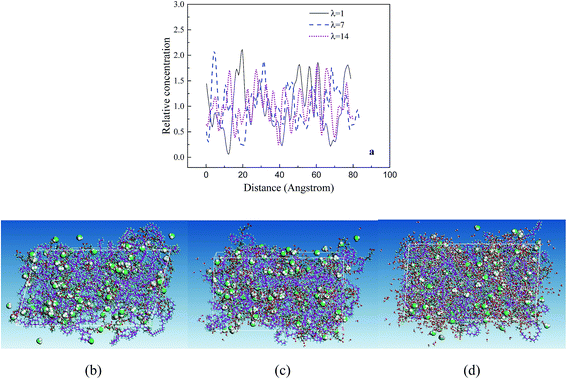
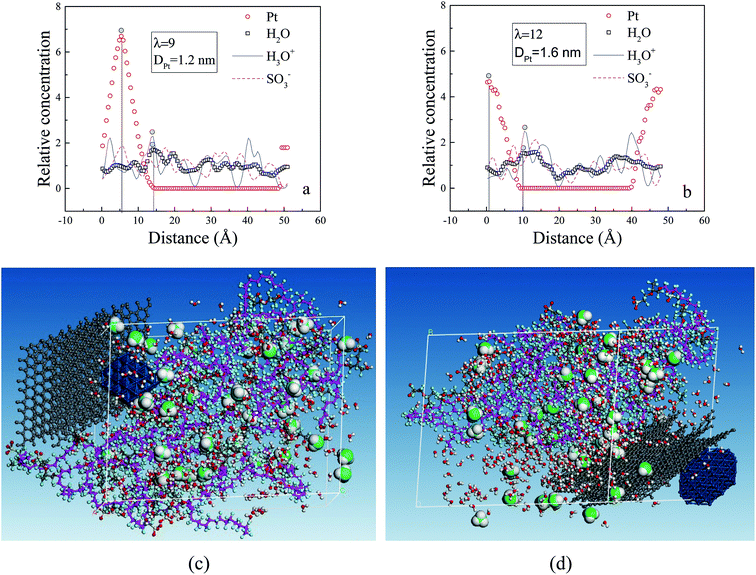
The RC distributions of various components are investigated to better understand their diffusion mechanism and interaction principle. The distributions of water molecules and hydronium ions in three axial directions are first investigated. The results demonstrate the directional consistency, and the distribution is more even in the membrane systems than in the CL systems, where special high peaks are shown. This is induced by the contribution of the Pt particles. In the following, the direction (001) is used. Fig. 8a presents the distribution of hydronium ions in the membrane at three different hydration levels. With increasing hydration level, the fluctuation in rc is relatively small (i.e., the hydronium ions distribute more evenly). The distribution can be also observed from the corresponding microstructures in the z direction (see Fig. 8b–d). This trend agrees well with the MSD result and indicates that increasing water content provides an excellent channel of water connectivity, which makes the hydronium ions migrate more smoothly (i.e., with a higher diffusion coefficient).To determine the interactions among particles (Pt, H2O, H3O+ and SO3−), we specifically examined the rc distributions of CL systems at similar hydration levels (λ = 9 for CLwet I and λ = 12 for CLwet II). Fig. 9a and b show that the highest peak of the water molecule and hydronium ion occurred at a similar position, and they basically appear near the highest peak of Pt particles at a distance of ∼0.9 nm. This value may be the best adsorption distance between Pt and H2O/H3O+. In addition, the distribution of hydronium ions is similar to that of sulfonate ions but with a certain shift in distance, which represents the electrostatic equilibrium position for the hydronium and sulfonate ions. In combination with the microstructure (Fig. 9c and d), less hydronium ions and water molecules are found around the Pt/GN catalyst (i.e., the catalyst plays a role of blocking the water connectivity). It is worth noting that the morphology of phase separation between the hydrophilic and hydrophobic domains is not evident in Fig. 9; this is because the degree of phase separation decreases with ionomer thickness and almost disappears for an ultrathin ionomer (less than 20 nm).50
4. Conclusion
This work investigated the moisture and thermal expansion properties of Nafion-based MEA layers along with the interaction mechanisms between various ions in MEA. The simulation results for the CME, swelling ratio, CTE, and diffusion coefficient of the membrane agree well with our experimental results and the results in the literature. Because of the special preparation method of the CL, it is difficult to directly measure the expansion properties of CL systems, and further verification is required. This work provides a theoretical support: (1) the catalyst utilization (proton and electron transmission) can be enhanced by ensuring that the ionomer is homogeneously distributed around the catalyst particles; (2) the difference in CTE and CME between the membrane and CL can be reduced by decreasing the Pt content and size, controlling the working temperature range, and changing the chain length of the oligomer; and (3) the catalyst Pt/GN greatly decreases the water connectivity and slows the diffusion of water molecules and hydronium ions.Acknowledgements
The work was supported by the National Natural Science Foundation of China (No. 11502170), the Specialized Research Fund for the Doctoral Program of Higher Education of China (No. 20130072120068), the Research Funds for the Central Universities, and the Research Grants Council of the Hong Kong Special Administrative Region, China (No. 9042354, CityU 11261216). It was also financially supported by the Key Laboratory for Advanced Civil Engineering Materials (Tongji University), Ministry of Education.References
- B. C. H. Steele and A. Heinzel, Nature, 2001, 414, 345–352 CrossRef CAS PubMed.
- H. W. Wu, Appl. Energy, 2016, 165, 81–106 CrossRef CAS.
- X. Y. Huang, R. Solasi, Y. Zou, M. Feshler, K. Reifsnider, D. Condit, S. Burlatsky and T. Madden, J. Polym. Sci., Part B: Polym. Phys., 2006, 44, 2346–2357 CrossRef CAS.
- D. Z. Wang, L. Wang, J. S. Liang, Z. X. Xia, S. L. Wang, Y. L. Zhu, C. Liu and G. Q. Sun, J. Power Sources, 2013, 224, 202–210 CrossRef CAS.
- Y. Wang, K. S. Chen, J. Mishler, S. C. Cho and X. C. Adroher, Appl. Energy, 2011, 88, 981–1007 CrossRef CAS.
- X. G. Yang, Y. Tabuchi, F. Kagami and C. Y. Wang, J. Electrochem. Soc., 2008, 155, B752–B761 CrossRef CAS.
- Z. X. Liang, T. S. Zhao, C. Xu and J. B. Xu, Electrochim. Acta, 2007, 53, 84–902 CrossRef.
- H. Liang, H. Su, B. G. Pollet and S. Pasupathi, J. Power Sources, 2015, 288, 121–127 CrossRef CAS.
- W. T. Wang, S. Q. Chen, J. J. Li and W. Wang, Int. J. Hydrogen Energy, 2015, 40, 4649–4658 CrossRef CAS.
- Y. Tang, M. H. Santare, A. M. Karlsson, S. Cleghorn and W. B. Johnson, J. Fuel Cell Sci. Technol., 2006, 3, 119–124 CrossRef CAS.
- A. Kusoglu, A. M. Karlsson, M. H. Santare, S. Cleghorn and W. B. Johnson, J. Power Sources, 2006, 161, 987–996 CrossRef CAS.
- S. Kundu, M. W. Fowler, L. C. Simon and S. Grot, J. Power Sources, 2006, 157, 650–656 CrossRef CAS.
- X. Yu, J. L. Yuan and B. Sunden, J. Fuel Cell Sci. Technol., 2011, 8, 034001–034013 CrossRef.
- S. W. Shi, D. Liu, D. Z. Liu, P. Tae, C. Y. Gao, L. Yan, K. An and X. Chen, Polym. Eng. Sci., 2014, 54, 2215–2221 CAS.
- R. Friedmann and T. V. Nguyen, J. Electrochem. Soc., 2010, 157, B260–B265 CrossRef CAS.
- F. Rong, H. Cheng, Z. S. Liu, D. T. Song and Q. Wang, J. Power Sources, 2008, 175, 699–711 CrossRef CAS.
- J. Xie, D. L. Wood III, K. L. More, P. Atanassov and R. L. Borup, J. Electrochem. Soc., 2005, 152, A1011–A1020 CrossRef.
- M. Guarnieri, E. Negro, V. D. Noto and P. Alotto, J. Power Sources, 2016, 332, 249–264 CrossRef CAS.
- K. Li, N. Huo, X. P. Liu, J. Cheng and J. Y. Zhang, RSC Adv., 2016, 6, 769–777 RSC.
- S. Masoumi, B. Arab and H. Valipour, Polymer, 2015, 70, 351–360 CrossRef CAS.
- J. W. Liu, N. Suraweera, D. J. Keffer, S. T. Cui and S. J. Paddison, J. Phys. Chem. C, 2010, 114, 11279–11292 CAS.
- X. F. Li, F. Li, Y. Shi, Q. Chen and H. Sun, Phys. Chem. Chem. Phys., 2010, 12, 14543–14552 RSC.
- S. Cui, J. Liu, M. E. Selvan, S. J. Paddison, D. J. Keffer and B. J. Edwards, J. Phys. Chem. B, 2008, 112, 13273–13284 CrossRef CAS PubMed.
- K. Malek, T. Mashio and M. Eikerling, Electrocatalysis, 2011, 2, 141–157 CrossRef CAS.
- C. N. Sun, K. L. More, G. M. Veith and T. A. Zawodzinski, J. Electrochem. Soc., 2013, 160, F1000–F1005 CrossRef CAS.
- J. G. Pharoah, H. W. Choi, C. C. Chueh and D. B. Harvey, ECS Trans., 2011, 41, 221–227 CAS.
- Y. Gao, G. P. Robertson, M. D. Guiver, S. D. Mikhailenko, X. Li and S. Kaliaguine, Polymer, 2006, 47, 808–816 CrossRef CAS.
- C. J. Zhang, S. Kang, X. H. Ma, G. Y. Xiao and D. Y. Yan, J. Membr. Sci., 2009, 329, 99–105 CrossRef CAS.
- I. Shabani, M. M. Hasani-Sadrabadi, V. Haddadi-Asla and M. Soleimanid, J. Membr. Sci., 2011, 368, 233–240 CrossRef CAS.
- C. H. Cheng, K. Malek, P. C. Sui and N. Djilali, Electrochim. Acta, 2010, 55, 1588–1597 CrossRef CAS.
- B. Serger and P. V. Kamat, J. Phys. Chem. C, 2009, 19, 7990–7995 Search PubMed.
- A. Marinkas, R. Hempelmann, A. Heinzel, V. Peinecke, I. Radev and H. Natter, J. Power Sources, 2015, 295, 79–91 CrossRef CAS.
- Q. P. He, N. S. Suraweera, D. C. Joy and D. J. Keffer, J. Phys. Chem. C, 2013, 117, 25305–25316 CAS.
- D. Tashima, Y. Urakawa, Y. Suenaga and J. D. W. Madden, Process Saf. Environ. Prot., 2014, 92, 879–887 CrossRef CAS.
- L. Xiong and A. Manthiram, Electrochim. Acta, 2005, 50, 3200–3204 CrossRef CAS.
- C. Feng, J. W. Wang, Y. M. Cheng, P. F. He and K. M. Liew, RSC Adv., 2014, 4, 60711–60719 RSC.
- E. Negro, M. Vittadello, K. Vezzu, S. J. Paddison and V. D. Noto, Solid State Ionics, 2013, 252, 84–92 CrossRef CAS.
- J. K. Clark and S. J. Paddison, Electrochim. Acta, 2013, 101, 279–292 CrossRef.
- S. L. Mayo, B. D. Olafson and W. A. Goddard III, J. Phys. Chem., 1990, 94, 8897–8909 CrossRef CAS.
- R. Devanathan, N. Idupulapati, M. D. Baer, C. J. Mundy and M. Dupuis, J. Phys. Chem. B, 2013, 117, 16522–16529 CrossRef CAS PubMed.
- G. Bahlakeh, M. Nikazar, M. J. Hafezi and M. M. Hasani-Sadrabadi, J. Power Sources, 2013, 243, 935–945 CrossRef CAS.
- C. H. Cheng, P. Y. Chen and C. W. Hong, J. Electrochem. Soc., 2008, 155, B435–B442 CrossRef CAS.
- A. K. Rappé, C. J. Casewit, K. S. Colwell, W. A. Goddard and W. M. Skiff, J. Am. Chem. Soc., 1992, 114, 10024–10035 CrossRef.
- D. Santiago, G. G. Rodríguez-Calero, A. Palkar, D. Barraza-Jimenez, D. H. Galvan, G. Casillas, A. Mayoral, M. Jose-Yacamán, L. Echegoyen and C. R. Cabrera, Langmuir, 2012, 28, 17202–17210 CrossRef CAS PubMed.
- H. Ito, M. Ikeda, T. Hasegawa, Y. Furusho and E. Yashima, J. Am. Chem. Soc., 2011, 133, 3419–3432 CrossRef CAS PubMed.
- J. M. Taylor, T. Komatsu, S. Dekura, K. Otsubo, M. Takata and H. Kitagawa, J. Am. Chem. Soc., 2015, 137, 11498–11506 CrossRef CAS PubMed.
- J. Hager, R. Hentschke, N. W. Hojdis and H. A. Karimi-Varzaneh, Macromolecules, 2015, 48, 9039–9049 CrossRef CAS.
- Y. Ye, M. Tian, C. Zhang, Z. J. Du and J. G. Mi, Langmuir, 2016, 32, 230–238 CrossRef CAS PubMed.
- H. C. Andersen, J. Chem. Phys., 1980, 72, 2384–2393 CrossRef CAS.
- A. Kusoglu and A. Z. Weber, Chem. Rev., 2017, 117, 987–1104 CrossRef CAS PubMed.
- H. T. Kim, 2012 fuel cell seminar & Exposition, Mohegan Sun Convention Center, Uncasville, CT, 2012 Search PubMed.
- Y. C. Chen, H. C. Lin and Y. D. Lee, J. Polym. Res., 2003, 10, 247–258 CrossRef CAS.
- S. Ono, J. P. Brodholt and G. D. Price, J. Phys. Chem. Solids, 2011, 72, 169–175 CrossRef CAS.
- N. Sorot and B. R. K. Gupta, Orient. J. Chem., 2015, 31, 1327–1330 CrossRef CAS.
- C. Y. Jung, H. S. Shim, S. M. Koo, S. H. Lee and S. C. Yi, Appl. Energy, 2012, 93, 733–741 CrossRef CAS.
- P. B. Petersen and R. J. Saykally, J. Phys. Chem. B, 2005, 109, 7976–7980 CrossRef CAS PubMed.
- V. Chabot, D. Higgins, A. P. Yu, X. C. Xiao, Z. W. Chen and J. J. Zhang, Energy Environ. Sci., 2014, 7, 1564–1596 CAS.
- O. Leenaerts, B. Partoens and F. M. Peeters, Phys. Rev. B: Condens. Matter Mater. Phys., 2009, 79, 235440–235441 CrossRef.
Footnote |
| † Electronic supplementary information (ESI) available: Experimental data of the membrane (Nafion® 117). The rc distributions of various nanoparticles at different hydration levels. See DOI: 10.1039/c7ra04191h |
| This journal is © The Royal Society of Chemistry 2017 |

