 Open Access Article
Creative Commons Attribution 3.0 Unported Licence
Cell responses on a H2Ti3O7 nanowire film
Liming Wang,
Beibei Zhou,
Xiaoxiao Huang,
Lingqing Dong ,
Kui Cheng and
Wenjian Weng
 *
*
School of Materials Science and Engineering, State Key Laboratory of Silicon Materials, Zhejiang University, Hangzhou 310027, China. E-mail: wengwj@zju.edu.cn; Fax: +86 571 87953787; Tel: +86 571 87953787
First published on 3rd July 2017
Abstract
Alkali treatment has been widely used for the surface modification of Ti and Ti alloys for clinical applications. However, the mechanism underlying the effects of the alkali-treated Ti surface on the cell response still needs to be explored. In this study, we demonstrated that the cell responses on a H2Ti3O7 nanowire film, normally titanate generated on a Ti surface via alkali treatment and ion exchange, were sensitive to the surface hydroxyl groups of the H2Ti3O7 nanowire films, i.e. the total amount as well as comparative ratio of the distinct type of surface hydroxyl groups (bridging-OH and terminal-OH). The surface hydroxyl groups of H2Ti3O7 nanowires were further controlled via heat treatment to produce anatase TiO2 nanowire films. Although there was no difference in both topographies, cells on a H2Ti3O7 nanowire film showed more elongated shape than those on an anatase nanowire film. Moreover, the expression of ALP of cells on H2Ti3O7 upregulated as compared to that on the anatase nanowire film at day 4, suggesting enhanced osteogenic capacity at an early stage. These results could be attributed to the difference in the distinct ratio of the terminal hydroxyl groups to the bridging hydroxyl groups, which was 0.42 for the H2Ti3O7 nanowire film and 0.75 for the anatase nanowire film. It appeared that the bridging hydroxyl groups on H2Ti3O7 were efficient in attracting Ca2+, which influenced the cell morphology and further upregulated the early differentiation.
1. Introduction
With excellent biocompatibility, mechanical properties, and corrosion resistance, titanium (Ti) and its alloys are desirable materials for dental and orthopaedic prostheses such as bone implants and tissue engineering scaffolds.1,2 However, recent findings indicate that the osseointegration potential of Ti implants can be further enhanced by modifying their topographical and physicochemical surface properties.3–5 Chemical surface modification, including hydrogen peroxide, acid, and alkali treatments, is considered as a promising strategy for metallic biomaterials, which depends upon the chemical reactions at the interface of biomaterials/reagents. Among different types of chemical modification methods, alkali treatment has been widely used for the surface modification of Ti and Ti alloys for biomedical purposes.6,7 The alkali-treated Ti surface provides a niche microenvironment that contains a nanowire structure and a chemically modified surface that is mainly composed of titanate.8,9 The niche microenvironment generated by the nanostructure provides a simulated 3D biomimetic situation that directs the fate of cells.10,11 Ion exchange of titanate on the surface induced the formation of a hydroxyl group that attracted Ca2+ and exhibited excellent in vitro bioactivity, osteogenic activity, in vivo osseointegration, as well as good bonding strength of the modification layer with the substrate.12Biomedical performances of the biomaterials strongly depend on the surface since the surface is in direct contact with the extracellular matrix and the interaction occurs at the very beginning stage when the material first comes in contact with the biological environment. Titanate generated via the alkali treatment can easily undergo ion exchange and get converted into H2Ti3O7.13,14 The biocompatibility of H2Ti3O7 is rarely studied, but it may have a significant impact on the alkali-treated surface because H2Ti3O7 is considered to be hydrated TiO2 and the structure of water in the H2Ti3O7 crystal can influence the distribution of the water molecules at the interface, regulating the cell response. The distribution of water molecules at the interface plays an important role in protein adsorption. TiO2 surface modified with a hydroxyl functional group showed significant enhancement in antibody immobilization.15 However, a surface with modified hydroxyl groups showed much greater affinity towards proteins via larger protein–surface electrostatic interaction and larger number of adsorbed residues.16 It has been verified that the hydroxyl groups regulate the adsorption of proteins, which guide the adhesion/growth of the surrounding cells. Hydration of H2Ti3O7 can be controlled by post thermal treatment, which can lead to the formation of different types of TiO2 depending on the thermal treatment temperature, and the topography can be well-preserved via careful treatment.17
As is well-known, hydrothermal method is of particular interest due to its low-cost and environmental friendliness.18,19 H2Ti3O7 can be synthesized via hydrothermal treatment followed by ion exchange.13 However, since the alkali-treated titanate nanowire was fine such that it could be destroyed via acid treatment, alkali treatment of the rutile nanorod film was adopted to protect the nanostructure of titanate because rutile could act as another titanium source.
In this study, a H2Ti3O7 nanowire film was prepared via a two-step hydrothermal method followed by an ion exchange process in acid solution. The H2Ti3O7 nanowire film was used to regulate the behaviour, especially the responses of MC3T3-E1, and an anatase nanowire film was used as a control to produce samples with different hydration levels but similar topography. The assessment of the fate, including cell proliferation, adhesion, morphology, and differentiation, of MC3T3-E1 on different TiO2 substrates demonstrates that the species of surface hydroxyl groups is an important factor to regulate the differentiation of MC3T3-E1, providing new insights into the modification of the surface of the titanium implants.
2. Experimental details
2.1. Materials
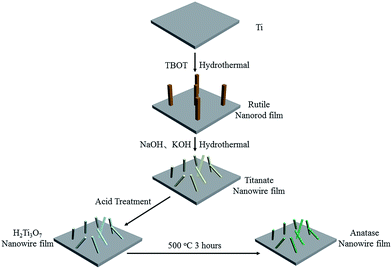
The metal titanium (titanium foils) substrates (1 cm × 1 cm × 1 mm) were polished by SiC abrasive papers of small grain size. Then, they were ultrasonically cleaned in de-ionized water and ethanol and dried in ambient air. Picric acid, tetrabutyl titanate (TBOT, Aladdin), hydrochloric acid, and ethanol were mixed to prepare rutile nanorod layers on Ti substrates. Sodium hydroxide and potassium hydroxide were used to prepare titanate nanowire films. The titania nanowire film was obtained by thermal treatment of the hydrogen titanate nanowire film. All aqueous solutions were prepared using deionized water. Process diagram is shown in Fig. 1.A rutile nanorod film was prepared according to the method reported in our previous study.20 To prepare the hydrothermal solution, 30 mL deionized water and 20 mL concentrated hydrochloric acid (36.5–38% by weight) were added to 6 mL ethanol containing 0.23 g picric acid (PA). Then, eighty millilitres of the clear solution was transferred to a 100 mL Teflon-lined stainless-steel autoclave, and a Ti substrate was placed at an angle against the wall of the Teflon liner with the coated side facing down. Hydrothermal growth was allowed to proceed for 6 h at 160 °C in an electric oven. The autoclave was then cooled down to room temperature, and the sample was removed, extensively rinsed with deionized water and ethanol, and allowed to dry in ambient air.
2.2. Hydrothermal growth of the titanate nanowire film
Sodium hydroxide and potassium hydroxide were dissolved in deionized water to prepare the hydrothermal solution. The total concentration of the alkaline solution was 6 mol L−1, and the molar ratio of sodium hydroxide and potassium hydroxide was 2![[thin space (1/6-em)]](https://www.rsc.org/images/entities/char_2009.gif) :
:![[thin space (1/6-em)]](https://www.rsc.org/images/entities/char_2009.gif) 1. Then, eighty millilitres of the clear solution was transferred to a 100 mL Teflon-lined stainless-steel autoclave, and a nanorod-coated Ti substrate was placed at an angle against the wall of the Teflon liner with the coated side facing down. The hydrothermal synthesis was performed at 200 °C for 2.5 h. After being cooled down to ambient temperature, the substrates were removed, extensively rinsed with deionized water, and allowed to dry in ambient air. To obtain a hydrogen titanate nanowire film, the as-prepared substrate was washed in 0.1 M hydrochloric acid for ion exchange. The TiO2 nanowire film was obtained via the thermal treatment of the hydrogen titanate nanowire film. The hydrogen titanate nanowire film was heated at 500 °C for 3 h to obtain the anatase nanowire film.
1. Then, eighty millilitres of the clear solution was transferred to a 100 mL Teflon-lined stainless-steel autoclave, and a nanorod-coated Ti substrate was placed at an angle against the wall of the Teflon liner with the coated side facing down. The hydrothermal synthesis was performed at 200 °C for 2.5 h. After being cooled down to ambient temperature, the substrates were removed, extensively rinsed with deionized water, and allowed to dry in ambient air. To obtain a hydrogen titanate nanowire film, the as-prepared substrate was washed in 0.1 M hydrochloric acid for ion exchange. The TiO2 nanowire film was obtained via the thermal treatment of the hydrogen titanate nanowire film. The hydrogen titanate nanowire film was heated at 500 °C for 3 h to obtain the anatase nanowire film.
2.3. Characterization of the films
The topographies and microstructures of the resulting films were characterized by scanning electron microscopy (FE-SEM, Hitachi, SU-70, 3 kV of operating voltage) and high resolution transmission electron microscopy (HRTEM) (Tecnai G2 F20 S-TWIN FEI), and the TiO2 nanowire films were characterized by X-ray diffraction (XRD) analysis (PANalytical, X'Pert PRO, Cu-Kα, λ = 1.5406 Å, 0.02° per step, 2° min−1 scanning speed, 40 kV operating voltage, 40 mA operating current, and 5–80° scanning range). X-ray photoelectron spectroscopy (XPS; Kratos AXIS Ultra DLD) with an Al Kα source (1486.6 eV) was used to characterize the surface composition of the TiO2 nanowire films. A detailed scan for oxygen was carried out, and a step of 0.1 eV was used for calibration. Thermogravimetric (TG) analysis was carried out using an SDT Q600 instrument in the temperature range from 25 °C to 500 °C at a heating rate of 10 °C min−1 and kept at 500 °C for 3 hours in air. Kelvin potential was analysed by atomic force microscopy (AFM) using a commercially available SPM microscope (VEECO, MultiMode 3) equipped with a rectangular RTESP. The scan rate was 1 Hz and the scan size was 2.5 μm × 2.5 μm. Images were obtained in the tapping mode. The average Kelvin potential was calculated using the data obtained from the images using an appropriate software. Simulated body fluid (SBF) immersion was conducted as per the reported instruction, and the results were obtained by SEM and EDS.21 SBF with ion concentrations 1.5 times those of SBF (1.5 SBF) was used in this experiment. All the samples were vertically placed in a 15 mL centrifuge tube and soaked at 37 °C.2.4. Culture of the cells
Mouse calvaria-derived pre-osteoblastic cells (MC3T3-E1, CRL-2594, ATCC) were utilized in the present study. MC3T3-E1 were cultured in Dulbecco's modified Eagle's medium (DMEM, Gibco) supplemented with 10% fetal bovine serum (FBS, PAA, Australia), 1% MEM non-essential amino acids (Gibco), 1% antibiotic solution containing 10![[thin space (1/6-em)]](https://www.rsc.org/images/entities/char_2009.gif) 000 μg mL−1 streptomycin (Gibco) and 10
000 μg mL−1 streptomycin (Gibco) and 10![[thin space (1/6-em)]](https://www.rsc.org/images/entities/char_2009.gif) 000 units per mL penicillin, and 1% sodium pyruvate (Gibco). The cells were incubated under standard cell culture conditions at 37 °C in an atmosphere of 5% CO2. The cultured cells were harvested using 0.25% trypsin/EDTA (Gibco), suspended in fresh culture media for the experiments.
000 units per mL penicillin, and 1% sodium pyruvate (Gibco). The cells were incubated under standard cell culture conditions at 37 °C in an atmosphere of 5% CO2. The cultured cells were harvested using 0.25% trypsin/EDTA (Gibco), suspended in fresh culture media for the experiments.
2.5. Cytotoxicity evaluation
Lactate dehydrogenase (LDH) is a cytoplasmic enzyme. Normally, it is not secreted outside the cells, but upon damage of the cell membrane, LDH leaks out. With the LDH test, it is possible to measure the release of LDH from the cells based on colorimetric quantitation after an enzymatic reaction. LDH that has been released from the cells catalyzes the reaction in a substrate mix solution and converts the INT-tetrazolium salt into a red formazan salt, which can be quantitated. Cytotoxicity on different samples was assessed via lactate dehydrogenase (LDH) leakage into the culture medium. LDH release was determined according to manufacturer's procedure (Dojindo). The supernatants obtained from the cell viability assay on day 1, day 4, and day 7 were used for the LDH assay. Briefly, after incubation in 96-well plates, the cells were washed twice with 100 μL of HBSS, and the test solutions were added to the wells. All the test samples were similar to those of the MTT assays. The plates were incubated at 37 °C for 3 h. After incubation, 50 μL samples were withdrawn from each well to a new plate, and 50 μL of the substrate mix solution was added. The wells were incubated with the substrate mix solution for 30 min. After incubation, the enzymatic reactions in the cells were stopped by adding stop solution (1 M acetic acid) to the wells. Absorbance values were measured within an hour at 490 nm using the ELISA reader. PS and cell lysis were used as the minimum and maximum LDH release, respectively.2.6. Cell adhesion and proliferation
A cell counting kit-8 (CCK-8) assay was used to measure cell adhesion and proliferation. In brief, cells cultured at a density of 2 × 10⁴ cells per cm2 were seeded on different TiO2 nanowire films in 24 wells. CCK-8 solution was added to the wells at a concentration ratio of 1![[thin space (1/6-em)]](https://www.rsc.org/images/entities/char_2009.gif) :
:![[thin space (1/6-em)]](https://www.rsc.org/images/entities/char_2009.gif) 10 with the culture solution. After reaction for 3 h in the incubator, the optical density (OD) value of the supernatant liquid was measured at 450 nm using a microplate reader (Multiskan MK3) after culture for different times (1 d, 4 d, and 7 d).
10 with the culture solution. After reaction for 3 h in the incubator, the optical density (OD) value of the supernatant liquid was measured at 450 nm using a microplate reader (Multiskan MK3) after culture for different times (1 d, 4 d, and 7 d).
2.7. Alkaline phosphatase (ALP) assay
To determine the osteogenic activity of the mouse MC3T3-E1 cells, ALP activity was colorimetrically assayed. The mouse MC3T3-E1 cells were cultured on different surfaces for 4, 7, and 14 days. At the end of the culture period, the cells were rinsed with PBS, vigorously lysed in PBS containing 0.2% Triton X-100 for 10 min, and then centrifuged. After centrifugation, the supernatant was used to determine the total intracellular protein and ALP activity with p-nitrophenol phosphate as the substrate. The absorbance at 405 nm was measured using a spectrophotometric microplate reader (Bio-Rad 680, USA). The ALP activity was normalized to total intracellular protein synthesis and thus expressed as U (nmol μL−1) per mg protein. The total intracellular protein content was determined using a BCA kit.2.8. Protein adsorption
Bovine serum albumin (BSA, Sigma-Aldrich) was used as a model protein. Following the previous protocol, 500 μL of BSA solution (10 mg mL−1 protein/phosphate buffered saline) was first pipetted into the samples with different surfaces. After incubation for 24 h at 37 °C, nonadherent proteins were removed and mixed with bicinchoninic acid (Pierce Biotechnology) at 37 °C for 60 min. The amount of the removed albumin as well as the total amount of albumin inoculated were quantified using a microplate reader at 562 nm. The BSA remained could be acquired by subtracting the two abovementioned values.2.9. Statistical analysis
All values are expressed as means ± standard deviation. Statistical analyses were carried out via one-way analysis of variance (one-way ANOVA) and the Scheffe's post hoc test using the SPSS software for multiple comparison tests or using the Student's t-test. Differences were considered statistically significant when P < 0.05.3. Results and discussion
3.1. Material characterization
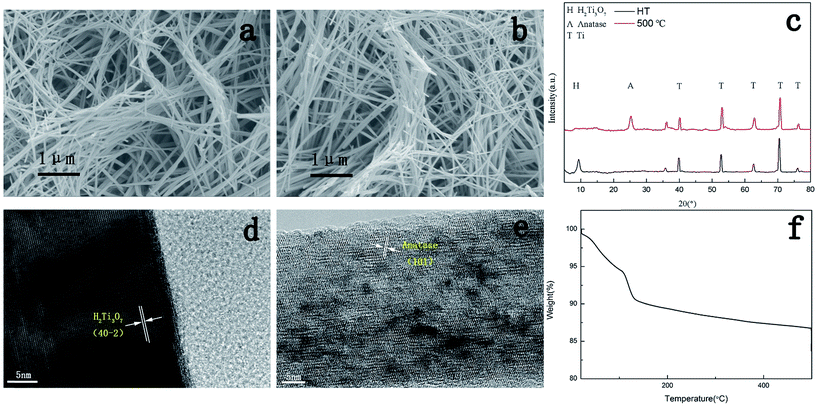
In this study, a hydrothermal sample was prepared via a two-step hydrothermal process and acid treatment. Dehydration was conducted via thermal treatment at 500 °C for 3 hours. Fig. 2a and b show typical SEM images of the as-synthesized samples. The hydrothermally synthesized nanowire had an average diameter of 100–200 nm with a length of several micrometres. Nanowires were criss-crossed between tops of the poles, forming network. The morphology of the hydrothermal sample remained almost the same after 3 hour thermal treatment. Since two samples possessed almost the same nanowire density and nanowire size, the influence of the topography in this experiment diminished so that the focus was on the character of the surface chemistry.Fig. 2c shows the typical XRD patterns of two different samples. The diffraction peaks confirmed that the hydrothermally synthesized sample was H2Ti3O7 film as the main peak at about 10° could evidently be found in the XRD pattern of the hydrothermal sample. After calcination at 500 °C for 3 hours, the sample was converted into anatase since the typical anatase XRD peak was observed in the 500 °C-treated sample.
To further confirm the crystal structure of the nanowires, HRTEM images of the single nanowire were obtained and are shown in Fig. 2d and e. Clear crystal fringes could be seen in these images. In Fig. 1d, the interplanar spacing obtained from the crystal fringe well-coincided with the crystal structure of H2Ti3O7. Moreover, Fig. 1e confirmed the 500 °C-treated nanowire as anatase, which was in accordance with the XRD results.
As abovementioned, H2Ti3O7 was considered as hydrated TiO2 due to its crystal structure. A thermogravimetric analysis test was used to further verify the hydration of H2Ti3O7. After desorption of the physically absorbed water at 100 °C, the weight of H2Ti3O7 continued to decrease with the increasing temperature, which proved the hydration of H2Ti3O7. The total weight loss was about 12%, which was just in accordance with the formula of H2Ti3O7 and reports of other groups.22,23
3.2. Surface characterization of the H2Ti3O7 nanowire films
It was considered that two types of hydroxyl groups appeared at the TiO2 surface: a bridging hydroxyl group bound to a surface Ti4+ ion, which was four coordinated with respect to the lattice, and a terminal hydroxyl group bound to a Ti4+ ion, which was five coordinated with respect to lattice oxide ions.24,25 The bridging hydroxyl groups were strongly polarized by the cations, thus easily loosening the bond to hydrogen and resulting in an acidic character; however, the terminal hydroxyl groups were expected to exhibit a basic character and might be exchangeable for other anions.26XPS was used to evaluate the surface character of both samples. Fig. 3a and b show the O 1s XPS spectra of the H2Ti3O7 film and anatase film, respectively. The hydroxide peaks observed in the XPS spectra were obtained in dried samples under an ultra-high vacuum. The spectra were deconvoluted into three Gaussian component peaks: the peak near 530.6 eV was assigned to O in the surface oxide lattices (denoted by TiO2), the peak near 531.28 eV was attributed to O in TiOHT (bridging OH), and the peak near 532.2 eV was assigned to O in TiOHT (terminal hydroxyl groups).27 About 12.5% of surface oxygen on the H2Ti3O7 nanowire film and 16.8% of surface oxygen on the anatase nanowire films were attributed to TiOHT (terminal hydroxyl groups); however, 29.8% of surface oxygen on the H2Ti3O7 nanowire film and 22.3% of surface oxygen on the anatase nanowire films were due to TiOHB (bridging hydroxyl groups). Note that there were slightly more hydroxyl groups on the H2Ti3O7 nanowire film than those on the anatase nanowire film.
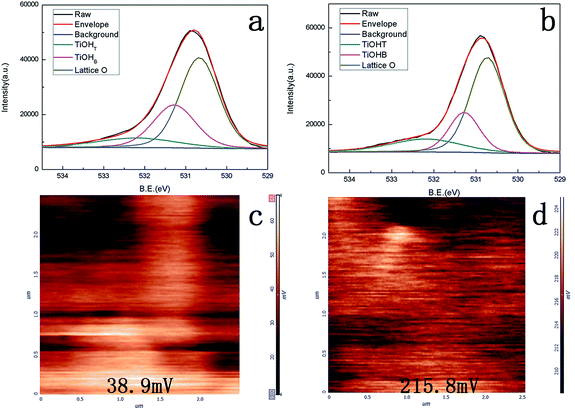 | ||
| Fig. 3 XPS spectra of the TiO2 nanowire films: (a) O 1s of the H2Ti3O7 nanowire film, (b) O 1s of the anatase nanowire film; KFM of the (c) H2Ti3O7 nanowire film and (d) anatase nanowire film. | ||
Since different kinds of hydroxyl groups can result in different polarities, it can be significant to calculate the ratio of the terminal hydroxyl groups to the bridging hydroxyl groups. The ratio is shown in Table 1. The ratio of the terminal hydroxyl groups to the bridging hydroxyl groups on H2Ti3O7 was 0.42 and increased to 0.75 after thermal treatment. There would be no doubt that H2Ti3O7 nanowire film possessed more bridging hydroxyl groups from the crystal structure of H2Ti3O7. There are two sources of hydroxyl groups on the surface of the H2Ti3O7 nanowire film: one is the structural hydrogen, which forms most of the bridging hydroxyl groups on H2Ti3O7, and the other is the surface oxygen, which forms the bridging hydroxyl groups and terminal hydroxyl groups on TiO2 depending on the species of oxygen.28,29
| TiOHT (%) | TiOHB (%) | Ti–O–Ti (%) | TiOHT/TiOHB | |
|---|---|---|---|---|
| H2Ti3O7 | 12.5 | 29.8 | 57.7 | 0.42 |
| Anatase | 16.8 | 22.3 | 60.8 | 0.75 |
Kelvin surface potential measured by Kelvin force microscopy (KFM) was considered to be an effective way to detect and map the acid–base site on the solid surface.30 Since different hydroxyl groups resulted in different polarities, Kelvin surface potential on two samples was obtained and is shown in Fig. 3c and d. Kelvin surface potential was reported to be more positive at the basic site.30 The surface potential increased from 38.9 to 215.8 mV after thermal treatment with the increase in the terminal hydroxyl groups. This further confirmed the XPS result.
3.3. Bioactivity and cell responses on the H2Ti3O7 nanowire film
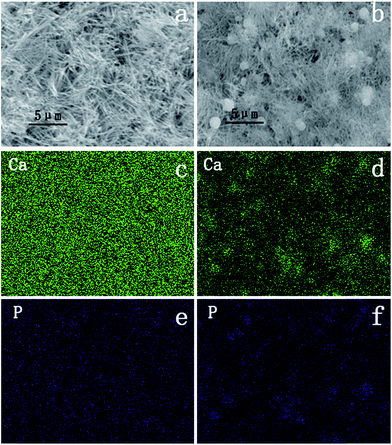
Since hydroxyl groups on the oxide surface were always considered to play an important role in attracting Ca2+ ion, SBF in this experiment was used to mimic the behaviour of Ca2+ ion in vitro.Fig. 4a and b show the typical morphologies of the H2Ti3O7 and anatase nanowire films after 12 hours of SBF immersion. Spheres of different sizes could be found on the anatase nanowire film. Calcium and phosphorus distribution detected by EDS indicated that the spheres were calcium phosphate. Although no evident spheres were found on the H2Ti3O7 nanowire film, calcium ion turned out to be distributed evenly on the surface and was not less than that on the anatase nanowire film.
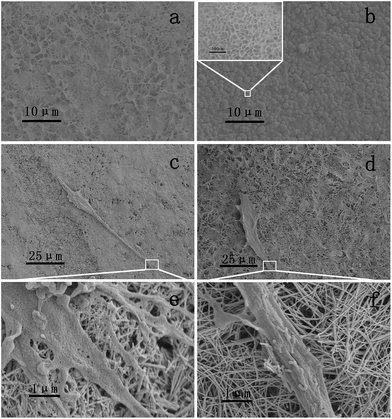
The SEM images of two samples after 4 days of immersion are shown in Fig. 5a and b. Typical calcium phosphate morphology was found on the anatase nanowire film. Calcium phosphate in a hemispherical shape was clearly observed on the surface of the anatase nanowire film, but no obvious layer of calcium phosphate was found on the surface of the H2Ti3O7 nanowire film. Since the surface of the H2Ti3O7 nanowire film was found to possess more hydroxyl groups, this phenomenon can be attributed to the polarity of the hydroxyl groups instead of the amount of the hydroxyl groups. Higher surface potential derived from the hydroxyl group facilitated calcium phosphate deposition because terminal hydroxyl group was expected to predominantly exhibit basic character that favoured the deposition of calcium phosphate.31,32 Based on the SEM images, there was no obvious increase in the deposition of calcium phosphate on the H2Ti3O7 nanowire film after 4 days of immersion. H2Ti3O7 is a layered structure composed of [TiO6] octahedra with shared edges and vertices. Hydrogen cations are located between [TiO6] layers.33 As the Ti–OH groups formed after immersion in SBF are negatively charged, they selectively combine with positively charged Ca2+ ions to form calcium titanate.34 It seemed that calcium on H2Ti3O7 was balanced due to the ion exchange property of the bridging hydroxyl groups.
Cell morphology after 1 day culture was detected via SEM. At least three cells on two nanowire films were detected and typical morphology on each film is shown in Fig. 5c and d. Cells on both films showed a large amount of pseudopodium, and pseudopodium showed good contact with the nanowire on the sample. All these findings indicated that H2Ti3O7 was biocompatible. Cell cultured on the H2Ti3O7 nanowire film was more elongated than that cultured on the anatase nanowire film, according to the SEM images.
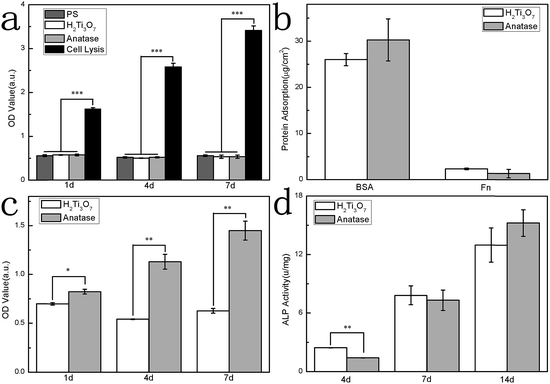
Cytotoxicity on the H2Ti3O7 nanowire film as well as anatase nanowire film was measured in this experiment, as shown in Fig. 6a, using PS as a low control and cell lysis as a high control. The H2Ti3O7 nanowire film showed no cytotoxicity during the cell culture. Protein adsorption was always considered as the first step of interaction between a biomaterial and extracellular matrix, which determined the later cell response. The adsorption of BSA determines the behaviour of later adsorption of protein since BSA is the main component of cell culture media.35 Fibronectin is responsible for key functions such as provision of a structural framework for cell attachment, migration, differentiation, and cell–cell and cell substrate adhesion through integrin receptors.36 In this experiment, BSA and Fn were used as the model protein to study protein adsorption behaviour on the H2Ti3O7 nanowire film.
Protein adsorption on two nanowire films is shown in Fig. 6b. There was no significant difference in the amount of BSA and Fn absorbed on the H2Ti3O7 nanowire films and anatase nanowire film. It has been reported that hydroxyl groups on TiO2 were able to induce protein conformation change and further influenced cell responses.36 Since cell morphology on different nanowire film was different, it could be deduced that the protein adsorbed on the surface underwent conformational changes due to different surface ion adsorption behaviours derived from hydroxyl groups.
MC3T3-E1 were cultured on two nanowire films to evaluate the viability. The OD value after 1 day, 4 day, and 7 day culture is shown in Fig. 6c. Anatase nanowire film showed better cell attachment at the 1st day as compared to the H2Ti3O7 nanowire film. This could be attributed to the calcium phosphate deposition on the anatase nanowire film since calcium phosphate was reported to promote cell adhesion.37 The OD value at day 4 was smaller than that at day 1, indicating poor proliferation on the H2Ti3O7 nanowire film. These results were in accordance with the reports stating that the alkali-treated surface always showed poor proliferation.38 However, as H2Ti3O7 showed no cytotoxicity during cell culture, the fate of the cells must be affected.
As a differentiation indicator at an early stage, ALP activity of MC3T3-E1 cells was obtained, and the results are shown in Fig. 6d. The ALP expression of the cells cultured on the H2Ti3O7 nanowire film was enhanced at day 4. It indicated that H2Ti3O7 nanowire film intrigued cell differentiation at an early stage. On combining the results of cell proliferation and differentiation, it was found that cell differentiation on the H2Ti3O7 nanowire film shifted to an earlier date than that on anatase nanowire film, which induced poor proliferation on the H2Ti3O7 nanowire film.
Although the layer of deposited calcium phosphate was not obviously observed on the H2Ti3O7 nanowire film, H2Ti3O7 was always considered to be efficient in ion exchange due to large amount of bridging hydroxyl groups on the surface.14 This ion exchange of bridging hydroxyl groups provided steady Ca2+ ion on the surface, which regulated protein conformation and further determined the cell morphology. Since elongated cell morphology was always considered to result in higher differentiation potential, ALP expression of the cells cultured on the H2Ti3O7 nanowire film was enhanced at day 4.39,40
4. Conclusions
A H2Ti3O7 nanowire film and post thermal-treated nanowire film (anatase) were prepared with almost the same topography to study the effects of the surface hydroxyl groups of the H2Ti3O7 nanowire films on the cell response. We demonstrated that higher surface potential derived from increased ratio of terminal hydroxyl groups on TiO2 promoted the calcium phosphate deposition. Calcium phosphate deposition on the anatase nanowire film facilitated cell adhesion. Bridging hydroxyl groups on the H2Ti3O7 nanowire played an important role in ion exchange, thereby attracting Ca2+ that promoted early-stage osteogenic differentiation. This study, therefore, not only provides an evaluation of cell responses on the H2Ti3O7 nanowire film but also introduces new insights into the exploration of the relationship between hydroxyl group and cell responses.Acknowledgements
This work was financially supported by the National Natural Science Foundation of China (51472216, 51372217, 31570962, 51502262), the Zhejiang Provincial Natural Science Foundation (LY15E020004), the 111 Project under Grant No. B16042, and the Fundamental Research Funds for the Central Universities (2017XZZX008-05).References
- X. Wang, S. Xu, S. Zhou, W. Xu, M. Leary, P. Choong, M. Qian, M. Brandt and Y. M. Xie, Biomaterials, 2016, 83, 127–141 CrossRef CAS PubMed.
- J. Raphel, M. Holodniy, S. B. Goodman and S. C. Heilshorn, Biomaterials, 2016, 84, 301–314 CrossRef CAS PubMed.
- D. Karazisis, S. Petronis, H. Agheli, L. Emanuelsson, B. Norlindh, A. Johansson, L. Rasmusson, P. Thomsen and O. Omar, Acta Biomater., 2017, 53, 559–571 CrossRef CAS PubMed.
- M. A. Burkhardt, J. Waser, V. Milleret, I. Gerber, M. Y. Emmert, J. Foolen, S. P. Hoerstrup, F. Schlottig and V. Vogel, Sci. Rep., 2016, 6, 15 CrossRef PubMed.
- B. van Oirschot, R. M. Eman, P. Habibovic, S. C. G. Leeuwenburgh, Z. Tahmasebi, H. Weinans, J. Alblas, G. J. Meijer, J. A. Jansen and J. van den Beucken, Acta Biomater., 2016, 37, 195–205 CrossRef CAS PubMed.
- W. A. Camargo, S. Takemoto, J. W. Hoekstra, S. C. G. Leeuwenburgh, J. A. Jansen, J. J. J. P. van den Beucken and H. S. Alghamdi, Acta Biomater., 2017, 57, 511–523 CrossRef CAS PubMed.
- Y. H. Sun, J. Tan, B. H. Wu, J. X. Wang, S. X. Qu, J. Weng and B. Feng, Colloids Surf., B, 2016, 146, 307–317 CrossRef CAS PubMed.
- H. Wang, Y. K. Lai, R. Y. Zheng, Y. Bian, K. Q. Zhang and C. J. Lin, Int. J. Nanomed., 2015, 10, 3887–3896 CrossRef CAS PubMed.
- T. Diu, N. Faruqui, T. Sjostrom, B. Lamarre, H. F. Jenkinson, B. Su and M. G. Ryadnov, Sci. Rep., 2014, 4, 7 Search PubMed.
- J. L. Wang, M. Y. Yang, Y. Zhu, L. Wang, A. P. Tomsia and C. B. Mao, Adv. Mater., 2014, 26, 4961–4966 CrossRef CAS PubMed.
- J. L. Wang, L. Wang, M. Y. Yang, Y. Zhu, A. Tomsia and C. B. Mao, Nano Lett., 2014, 14, 6850–6856 CrossRef CAS PubMed.
- Y. M. Su, S. Komasa, T. Sekino, H. Nishizaki and J. Okazaki, Mater. Sci. Eng., C, 2016, 59, 617–623 CrossRef CAS PubMed.
- A. Nakahira, T. Kubo and C. Numako, Inorg. Chem., 2010, 49, 5845–5852 CrossRef CAS PubMed.
- K. Kataoka, N. Kijima and J. Akimoto, Inorg. Chem., 2013, 52, 13861–13864 CrossRef CAS PubMed.
- W. J. Kim, S. Kim, B. S. Lee, A. Kim, C. S. Ah, C. Huh, G. Y. Sung and W. S. Yun, Langmuir, 2009, 25, 11692–11697 CrossRef CAS PubMed.
- B. Feng, J. Weng, B. C. Yang, J. Y. Chen, J. Z. Zhao, L. He, S. K. Qi and X. D. Zhang, Mater. Charact., 2002, 49, 129–137 CrossRef CAS.
- X. S. Peng and A. C. Chen, Adv. Funct. Mater., 2006, 16, 1355–1362 CrossRef CAS.
- W. Q. Wu, B. X. Lei, H. S. Rao, Y. F. Xu, Y. F. Wang, C. Y. Su and D. B. Kuang, Sci. Rep., 2013, 3, 7 Search PubMed.
- H. F. Liang, F. Meng, M. Caban-Acevedo, L. S. Li, A. Forticaux, L. C. Xiu, Z. C. Wang and S. Jin, Nano Lett., 2015, 15, 1421–1427 CrossRef CAS PubMed.
- L. Q. Dong, K. Cheng, W. J. Weng, C. L. Song, P. Y. Du, G. Shen and G. R. Han, Thin Solid Films, 2011, 519, 4634–4640 CrossRef CAS.
- T. Kokubo and H. Takadama, Biomaterials, 2006, 27, 2907–2915 CrossRef CAS PubMed.
- G. N. Zhu, C. X. Wang and Y. Y. Xia, J. Power Sources, 2011, 196, 2848–2853 CrossRef CAS.
- Y. M. Wang and H. Liu, in Emerging Focus on Advanced Materials, Pts 1 and 2, ed. S. Q. Liu and M. Zuo, Trans Tech Publications Ltd, Durnten-Zurich, 2011, vol. 306–307, p. 1233 Search PubMed.
- C. Deiana, E. Fois, S. Coluccia and G. Martra, J. Phys. Chem. C, 2010, 114, 21531–21538 CAS.
- M. Aizawa, Y. Morikawa, Y. Namai, H. Morikawa and Y. Iwasawa, J. Phys. Chem. B, 2005, 109, 18831–18838 CrossRef CAS PubMed.
- N. Yacoub, J. Ragai and S. A. Selim, J. Mater. Sci., 1991, 26, 4937–4944 CrossRef CAS.
- Y. Hong, M. F. Yu, J. Lin, K. Cheng, W. J. Weng and H. M. Wang, Colloids Surf., B, 2014, 123, 68–74 CrossRef CAS PubMed.
- A. Nakahira, T. Kubo and C. Numako, ACS Appl. Mater. Interfaces, 2010, 2, 2611–2616 CAS.
- A. H. Liu, M. D. Wei, I. Honma and H. S. Zhou, Adv. Funct. Mater., 2006, 16, 371–376 CrossRef CAS.
- R. F. Gouveia, J. S. Bernardes, T. R. D. Ducati and F. Galembeck, Anal. Chem., 2012, 84, 10191–10198 CrossRef CAS PubMed.
- T. Kokubo, H. M. Kim, M. Kawashita and T. Nakamura, J. Mater. Sci.: Mater. Med., 2004, 15, 99–107 CrossRef CAS PubMed.
- S. Jalota, S. B. Bhaduri and A. C. Tas, Mater. Sci. Eng., C, 2007, 27, 432–440 CrossRef CAS.
- Y. M. Wang, G. J. Du, H. Liu, D. Liu, S. B. Qin, N. Wang, C. G. Hu, X. T. Tao, J. Jiao, J. Y. Wang and Z. L. Wang, Adv. Funct. Mater., 2008, 18, 1131–1137 CrossRef CAS.
- C. Chen, Z. Y. Qiu, S. M. Zhang and I. S. Lee, Chem. Commun., 2011, 47, 11056–11058 RSC.
- J. Y. Tong, X. L. Xu, H. Wang, X. P. Zhuang and F. Zhang, RSC Adv., 2015, 5, 83232–83238 RSC.
- L. Lv, K. Li, Y. Xie, Y. Cao and X. Zheng, Mater. Sci. Eng., C, 2017, 78, 96–104 CrossRef CAS PubMed.
- B. Feng, J. Weng, B. C. Yang, S. X. Qu and X. D. Zhang, Biomaterials, 2004, 25, 3421–3428 CrossRef CAS PubMed.
- J. H. Li, G. F. Wang, D. H. Wang, Q. J. Wu, X. Q. Jiang and X. Y. Liu, J. Colloid Interface Sci., 2014, 436, 160–170 CrossRef CAS PubMed.
- A. B. Faia-Torres, S. Guimond-Lischer, M. Rottmar, M. Charnley, T. Goren, K. Maniura-Weber, N. D. Spencer, R. L. Reis, M. Textor and N. M. Neves, Biomaterials, 2014, 35, 9023–9032 CrossRef CAS PubMed.
- G. Abagnale, M. Steger, V. H. Nguyen, N. Hersch, A. Sechi, S. Joussen, B. Denecke, R. Merkel, B. Hoffmann, A. Dreser, U. Schnakenberg, A. Gillner and W. Wagner, Biomaterials, 2015, 61, 316–326 CrossRef CAS PubMed.
| This journal is © The Royal Society of Chemistry 2017 |

