 Open Access Article
Creative Commons Attribution 3.0 Unported Licence
One-pot synthesis of ethylbenzene/1-phenylethanol and γ-butyrolactone from simultaneous acetophenone hydrogenation and 1,4-butanediol dehydrogenation over copper based catalysts: effects of the support
Hari Prasad Reddy Kannapu *abc,
Young-Woong Suh
 *bc,
Anand Narania,
Veeralakshmi Vaddeboinaa,
David Raju Burria and
Rama Rao Kamaraju Seetha
 a
a
aCatalysis Laboratory, I&PC Division, Indian Institute of Chemical Technology, Hyderabad-500007, India. E-mail: kannapuhari@gmail.com
bDepartment of Chemical Engineering, Hanyang University, Seoul 133-791, Republic of Korea. E-mail: ywsuh@hanyang.ac.kr; Fax: +82-2298-4101; Tel: +82-2220-4329
cResearch Institute of Industrial Science, Hanyang University, Seoul 133-791, Republic of Korea
First published on 14th July 2017
Abstract
The effect of the support in the simultaneous hydrogenation of acetophenone and dehydrogenation of 1,4-butanediol was studied using supported (MgO, γ-Al2O3, MgO–Al2O3 and SiO2) copper (10 wt%) catalysts, prepared via impregnation. In this process, acetophenone was transformed to 1-phenylethanol/ethylbenzene and 1,4-butanediol converted to γ-butyrolactone/tetrahydrofuran under a hydrogen-free environment, indicating the major role of the supports. The Cu/MgO catalyst was active and highly selective towards the production of 1-phenylethanol and γ-butyrolactone. However, an adverse behaviour was observed over Cu/MgO–Al2O3. An extraordinary catalytic performance was obtained over Cu/SiO2 with high selectivity for ethylbenzene (99%) and γ-butyrolactone (99%). Contrarily, no hydrogenation of acetophenone was observed over Cu/γ-Al2O3 due to the dehydration of 1,4-butanediol, yielding tetrahydrofuran. The main advantage of this process is that no external hydrogen is required for the hydrogenation of acetophenone. Copper dispersion, the reduction behaviour of copper, copper particle size and the acidity and basicity of the catalysts play important roles in the activity. All four catalysts were characterized using BET surface area, N2O pulse chemisorption, XRD, XRF, H2-TPR, XPS, and TPD of NH3/CO2 to understand our results.
1. Introduction
Biomass is one of the most important sources for the production of chemicals and fuels.1 Lignin and cellulose are the chief source for the production of acetophenone (ACP)2 and 1,4-butanediol (BDO),3 respectively, which are potentially key platform molecules for the synthesis of value added chemicals. Hydrogenation of ACP can produce 1-phenylethanol (PhE), and ethylbenzene (EB), whereas BDO cyclodehydrogenation can form γ-butyrolactone (GBL) and its cyclodehydration can generate tetrahydrofuran (THF). PhE is industrially employed for making perfumery products4–7 whereas EB is an important starting material in the manufacturing of styrene.7 Because of the wider utility of both PhE and EB, intensive research has been conducted on the selective hydrogenation of ACP using supported noble metal catalysts8–15 and base metal catalysts such as nickel16–22 and copper23 using harsh reaction conditions such as high temperatures and high hydrogen pressures in different solvents. However, the selective formation of PhE/EB is a highly challenging task in the current research. There is a possibility of getting 100% selectivity towards PhE/EB, but high hydrogen pressures and solvents are mandatory8–23 that makes the system very complicate, expensive and not eco-friendly. Hence, an alternative and hydrogen free hydrogenation process should be developed immediately.γ-Butyrolactone (GBL), an important bio-mass derived product, has a great potential in the synthesis of N-vinylpyrrolidone, N-methylpyrrolidone, herbicides, and rubber additives and also use as a green solvent. GBL can be produced from 1,4-butanediol (BDO) through cyclodehydrogenation process.24 Commercially, the major production route for GBL is gas-phase dehydrogenation of BDO over supported copper metal catalysts, especially copper chromite catalysts, which are not environmentally friendly. At the same time tetrahydrofuran (THF) can be synthesized from BDO by employing acid catalyse systems via dehydration.25–29 The enormous importance of these chemicals, due to derive from biomass, BDO conversion has received great attention.
To minimize the severe reaction conditions and increases yield of PhE and EB from ACP hydrogenation, coupling of hydrogenation and dehydrogenation can be a promising method. Of late, coupling process has great attention due to the hydrogen economy, energy saving, operational simplicity and eco-friendly nature.30–43 Aiming at utilizing these privileges cyclohexanol dehydrogenation to cyclohexanone and furfural hydrogenation to furfuryl alcohol has been performed simultaneously using Cu–MgO and promoted Cu–MgO catalysts at atmospheric pressure38,40,43 under hydrogen free process at lower temperature than that of independent reactions. Due to more advantages of its application, we are interested to work on nitrobenzene (NB) hydrogenation with BDO dehydrogenation where aniline and GBL selectively formed over copper based catalysts.24 Moreover, coupling of nitrobenzene hydrogenation and cyclohexanol dehydrogenation was conducted over Cu/MgO–Al2O3, where selectivity of the aniline and cyclohexanone improved greatly compared to single reactions.44 Based on above studies, upgrading of bio chemicals such as ACP and BDO via coupling process would be a promising method due to hydrogen free process over copper based catalysts. To the best of our knowledge, it would be a first report on this process. It is fact that individual hydrogenation of ACP and BDO dehydrogenations is favourable over both acidic and basic supported catalysts.8–24 Thus, developing of a suitable catalyst for simultaneous hydrogenation of ACP hydrogenation and dehydrogenation of BDO could be a challenging task.
Herein, we reported ACP hydrogenation coupled with BDO dehydrogenation over various supported (MgO, Al2O3, MgO–Al2O3 and SiO2) copper catalysts in order to figure out the controlling of the product selectivity under similar reaction conditions. Activity studies have been carried out systematically over Cu/MgO, Cu/Al2O3, Cu/MgO–Al2O3 and Cu/SiO2 catalysts. Catalysts were well characterized by using BET surface area, XRD, XRF, N2O pulse chemisorption, TPR, XPS, TPD of NH3, TPD of CO2 and TGA analysis.
2. Experimental
2.1. Preparation of support
γ-Al2O3 (surface area 280 m2 g−1) and fumed silica (390 m2 g−1) are obtained from commercial source (M/s. Sigma-Aldrich, AR grade, 99%). But supports MgO and MgO–Al2O3 are prepared as described by ours earlier reports.4,44 Typically, MgO support was prepared by precipitation method, a required quantity of Mg (NO3)2⋯6H2O dissolved in de-ionised water then followed by precipitation with 10 wt% aq. solution of K2CO3 with pH of 9. After the complete precipitation, the obtained gel was separated by filtration subsequently washed with distilled water till the attainment of neutral pH. Subsequently, the sample was dried at 373 K for 12 h and calcined at 723 K for 5 h at a ramping rate of 5 K min−1. The resulting white MgO powder is used as a support. For the preparation of MgO–Al2O3 mixed oxide catalyst, we prepared Mg–Al hydrotalcite as stated in one of our publications.44 In a typical procedure, solution A containing 256 g of Mg (NO3)2·6H2O (1 mol.) and 185.7 g of Al (NO3)3·9H2O (0.5 mol.), with Mg/Al molar ratio of 2 was prepared. Solution B was prepared by dissolving 280 g of 50 wt% NaOH (140 g in 140 mL distilled water) and 100 g of Na2CO3 in 1000 mL distilled water. Here NaOH provides OH− while Na2CO3 delivers CO3−2 ions to form a hydrotalcite structure. In order to prepare the MgO–Al2O3 hydrotalcite, solution A was added to solution B under constant stirring while maintaining the pH in the range of 11–12. The resulting gel was transferred to an autoclave and allowed to crystallise at 333 K for 18 h. Then, the sample is filtered and washed several times with hot water until the pH reached to neutral which ensure the total removal of Na+. The final sample was dried in an oven at 373 K for 12 h and then calcined at 723 K in air for 18 h in order to obtain the MgO–Al2O3 mixed oxide.2.2. Catalysts preparation
A certain amount of copper (10 wt%) was deposited on the above mentioned supports. Typically, for Cu/MgO catalyst, a required quantity of aqueous nitrate solution of Cu (NO3)2·3H2O was added to MgO support. The resulting slurry was stirred well on hot plate until removing excess water then subsequently dried in an oven at 373 K for 12 h. The solid residue was crushed to fine particles, sieved <200 μm and finally calcined in air at 723 K for 5 h. Similar procedures were applied to the rest of the catalysts and designated as Cu/Al2O3, Cu/MgO–Al2O3 and Cu/SiO2.2.3. Catalysts characterization
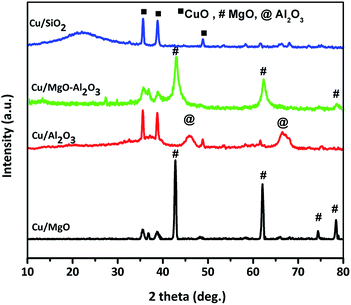
Catalysts were characterized using different analytical technique. BET surface area of the catalysts was measured on an Autosorb Automated Gas Sorption System (M/s. Quantachrome, USA) with N2 as adsorbate at liquid nitrogen temperature. X-ray powder diffraction (XRD) patterns were recorded on a Rigaku Miniflex (M/s. Rigaku Corporation, Japan). X-ray diffractometer using Ni filtered Cu Kα radiation (λ = 1.5406 Å) with a scan speed of 2° min−1 and a scan range of 10–80°at 30 kV and 50 mA. The copper content of the catalysts was measured using a Wavelength Dispersive S4-Pioneer X-ray Fluorescence spectroscope (M/s. Bruker, Germany). N2O pulse chemisorption was carried out at 303 K on a homemade pulse reactor to evaluate the copper dispersion and particle size. Typically, about 100 mg of the catalyst was placed in a reactor of 8 mm i.d., and then the catalyst was first reduced under a hydrogen flow at 523 K for 3 h, and then pre-treated at 523 K for 1 h under helium gas flow subsequently cool down to 303 K under same helium flow. The outlet of the reactor was connected to a micro-thermal conductivity detector (TCD) equipped GC-17A (M/s. Shimadzu Instruments, Japan) through an automatic six-port valve (M/s. Valco Instruments U.S.A). After cooling the reactor to the required temperature, pulses of 10% N2O (balanced He) were injected to the catalysts at room temperature through a 1 mL loop connected to the six-port valve until no further change in the intensity of the outlet N2O (from GC-software), assuming N2O![[thin space (1/6-em)]](https://www.rsc.org/images/entities/char_2009.gif) :
:![[thin space (1/6-em)]](https://www.rsc.org/images/entities/char_2009.gif) Cu stoichiometry of 1
Cu stoichiometry of 1![[thin space (1/6-em)]](https://www.rsc.org/images/entities/char_2009.gif) :
:![[thin space (1/6-em)]](https://www.rsc.org/images/entities/char_2009.gif) 2 and Cu metal cross sectional area of 6.8 × 10⁻²⁰ m2 Cu atom −1.24 Temperature programmed reduction (TPR) of the catalysts were generated on a homemade on-line quartz micro reactor interfaced to a thermal conductivity detector (TCD) equipped with a gas chromatograph (Varian CP 3800 USA) and the profiles were recorded using GC software. A H2/Ar (10 vol% of H2 and balance Ar) mixture was used as the reducing gas while the catalyst (amount of each catalyst weight is 50 mg) was heated at a linear heating ramp of 10 K min−1 from 303 to 900 K. X-ray photoelectron spectroscopy results were recorded on a Kratos Axis 165 XPS Spectrometer, with Mg Kα radiation (1253.6 eV) for reduced (523 K for 3 h) catalysts. Temperature programmed desorption (TPD) of NH3 was conducted using a 10% NH3 in helium mixture on a homemade reactor for measuring the acid sites of the catalysts. In a typical experiment, about 100 mg of the catalyst was placed in a reactor of 8 mm i.d., followed by conducting pre-treatment at 573 K for 2 h under helium flow. After that, the catalysts were reduced under hydrogen flow at 523 K for 3 h, and then reactor was cool down to 333 K in helium flow. The outlet of the reactor was connected to a micro-thermal conductivity detector (TCD) equipped GC-17A (M/s. Shimadzu Instruments, Japan) through an automatic six-port valve (M/s. Valco Instruments U.S.A). After cooling the reactor to the required temperature, pulses of 10% NH3 (balance helium) were injected to samples at 333 K temperature through a 1 mL loop connected to the six-port valve until no further change in the intensity of the outlet NH3 (from GC-software). In a similar procedure, the basicity of the catalysts was measured using 10% CO2 balanced He. Thermal gravimetric analysis (TGA) of Cu/SiO2 before and after the reaction was carried out using TGA/SDTA 851e thermal system (Mettler Toledo, Switzerland). During the analysis samples were heated under air from 300 K to 1100 K at a heating rate of 10 K min−1.
2 and Cu metal cross sectional area of 6.8 × 10⁻²⁰ m2 Cu atom −1.24 Temperature programmed reduction (TPR) of the catalysts were generated on a homemade on-line quartz micro reactor interfaced to a thermal conductivity detector (TCD) equipped with a gas chromatograph (Varian CP 3800 USA) and the profiles were recorded using GC software. A H2/Ar (10 vol% of H2 and balance Ar) mixture was used as the reducing gas while the catalyst (amount of each catalyst weight is 50 mg) was heated at a linear heating ramp of 10 K min−1 from 303 to 900 K. X-ray photoelectron spectroscopy results were recorded on a Kratos Axis 165 XPS Spectrometer, with Mg Kα radiation (1253.6 eV) for reduced (523 K for 3 h) catalysts. Temperature programmed desorption (TPD) of NH3 was conducted using a 10% NH3 in helium mixture on a homemade reactor for measuring the acid sites of the catalysts. In a typical experiment, about 100 mg of the catalyst was placed in a reactor of 8 mm i.d., followed by conducting pre-treatment at 573 K for 2 h under helium flow. After that, the catalysts were reduced under hydrogen flow at 523 K for 3 h, and then reactor was cool down to 333 K in helium flow. The outlet of the reactor was connected to a micro-thermal conductivity detector (TCD) equipped GC-17A (M/s. Shimadzu Instruments, Japan) through an automatic six-port valve (M/s. Valco Instruments U.S.A). After cooling the reactor to the required temperature, pulses of 10% NH3 (balance helium) were injected to samples at 333 K temperature through a 1 mL loop connected to the six-port valve until no further change in the intensity of the outlet NH3 (from GC-software). In a similar procedure, the basicity of the catalysts was measured using 10% CO2 balanced He. Thermal gravimetric analysis (TGA) of Cu/SiO2 before and after the reaction was carried out using TGA/SDTA 851e thermal system (Mettler Toledo, Switzerland). During the analysis samples were heated under air from 300 K to 1100 K at a heating rate of 10 K min−1.
2.4. Activity test
Catalytic activity of different supported copper catalysts was investigated in hydrogenation of ACP and dehydrogenation of BDO and coupling of both reactions. Firstly, ACP hydrogenation and BDO dehydrogenation reactions were performed separately in a fixed-bed tubular reactor (10 mm i.d., 300 mm long glass reactor) using 0.5 g catalyst under atmospheric pressure. In a typical procedure, the catalyst sample was diluted with quartz beads with an equal amount of catalyst and then packed at the centre of reactor between two quartz wool plugs. Since, the copper is sintered beyond 573 K, the catalysts reduction carried out at 553 K under H2 at a flow rate of 40 mL min−1 for 3 h. For independent BDO transformation, the feed rate was 1 mL h−1 and nitrogen fed as a carrier gas at flow rate of 18 mL min−1. In the case of separate ACP hydrogenation hydrogen was used as reducing gas. Finally, for coupling process, the mixture of reactants containing ACP and BDO (1![[thin space (1/6-em)]](https://www.rsc.org/images/entities/char_2009.gif) :
:![[thin space (1/6-em)]](https://www.rsc.org/images/entities/char_2009.gif) 2 mole ratio, feed = 1 mL h−1) were injected in to the reactor using syringe pump (M/s. Secura FT, B. Braun Germany) under N2 flow (18 mL min−1). The above all experiments were conducted at weight hourly space velocity (WHSV) of 2 h−1. The product mixture is collected every hour using an ice cold trap and analysed on a GC (GC-17A, M/s. Shimadzu instruments, Japan) using a Zebron ZB-WAX capillary column 0.53 mm in diameter and 30 m long.
2 mole ratio, feed = 1 mL h−1) were injected in to the reactor using syringe pump (M/s. Secura FT, B. Braun Germany) under N2 flow (18 mL min−1). The above all experiments were conducted at weight hourly space velocity (WHSV) of 2 h−1. The product mixture is collected every hour using an ice cold trap and analysed on a GC (GC-17A, M/s. Shimadzu instruments, Japan) using a Zebron ZB-WAX capillary column 0.53 mm in diameter and 30 m long.
3. Results and discussion
3.1. Catalysts characterizations
| Catalyst | Cu (wt%) from XRF | SA (m2 g−1) | DCu0 (%) | PCu0b (nm) reduced | PCu0c (nm) reduced | PCu0c,d (nm) spent |
|---|---|---|---|---|---|---|
| a SA specific surface area, DCu0 Dispersion, PCu particle size from.b N2O pulse chemisorption.c XRD.d After coupling reaction.e After time on stream study for 5 h. | ||||||
| Cu/MgO | 10.2 | 32 | 08 | 45 | 33 | 38 |
| Cu/Al2O3 | 9.98 | 158 | 13 | 20 | 25 | 36 |
| Cu/MgO–Al2O3 | 9.58 | 48 | 04 | 33 | 23 | 30 |
| Cu/SiO2 | 10.3 | 300 | 18 | 15 | 20 | 22 (24)e |
The amount of copper in all the catalysts determined by XRF is shown in Table 1, and it confirmed the copper composition of the catalysts is close to theoretical values (10 wt%). Copper dispersion (DCu0) and particle size (PCu0) calculated from N2O pulse chemisorption are summarized in Table 1. The fundamental chemical equation between copper metal and N2O is 2Cu + N2O → Cu2O + N2. The distinct copper dispersion of catalysts indicates the role of supports as well as metal support interactions. As shown from the results, the copper dispersion increased from Cu/MgO–Al2O3 (4%) to Cu/SiO2 (18%), revealed copper is highly dispersed over SiO2 surface compared to all other supports. Though the Cu/MgO–Al2O3 catalyst has shown higher BET surface area than Cu/MgO, the copper dispersion of Cu/MgO–Al2O3 is lower (4%) than Cu/MgO catalyst (8 wt%), probably due to incomplete reduction of copper oxide (discussed in TPR section). Apparently, the dispersion of copper in catalysts prepared by impregnation is affected by the calcination. The thermal treatment of the catalyst is accompanied by nucleation of new copper species. Depending on the structure of these species and the interaction with the support, nucleation will give rise to different metal dispersions.45
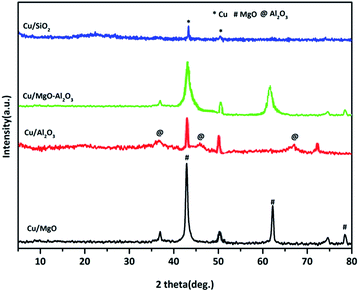
XRD patterns of reduced copper catalysts are shown in Fig. 2. The typical characteristic diffractions at 2θ = 43.29, 50.5 and 74.5°, corresponding to Cu0 indicated the complete reduction of CuO to Cu0 metal in all the catalysts.
As shown in the Cu/MgO and Cu/MgO–Al2O3, the 100% Cu0 plane (111) and 100% MgO plane (200) are not well separate due to the same 2θ.4,43,44 But, alumina supported copper catalyst provided a well resolved copper diffractions. Contrarily, a poor diffraction peaks at 2θ of 43.29° and 50.5° corresponding to the copper metal were visible in Cu/SiO2 catalysts, probably Cu0 species presented in amorphous phase. Hence, the crystallite size of copper metal calculated using Debye–Scherrer formula for reduced catalysts is mainly based on copper plane (200) appeared at 2θ of 50.5° for all supported copper catalysts and the distinct crystallite size of copper can be seen in the Table 1. It was found that the study on SiO2, Al2O3 and SiO2–Al2O3 supported copper catalysts exhibited different crystallinity of copper metal which could be attributed to the interactions of copper and supports.38,45,46 In addition to that, among all the supported copper catalysts silica supported copper catalyst displayed a smaller crystallinity of copper than the other catalysts mainly due to high dispersion of copper. This observation is quite resembled to Cu/SiO2 in the present study, containing 18% copper dispersion with the mean crystallite size of 15 nm. In the case of spent catalysts after the coupling process the crystallite size of copper increased significantly due to agglomeration of copper.
The average Cu particle sizes from N2O pulse chemisorption and crystallite sizes from XRD analysis of reduced catalysts are not same. This is probably because of the fact that the reduced catalysts while recording for their XRD are exposed to air and therefore, there is every possibility that some part of Cu0 might be oxidized to Cu+1/Cu+2. The oxide copper species thus formed due to areal oxidation may be in the amorphous form. On the other hand an in situ reduction step was done at 523 K for 3 h prior to the N2O pulse chemisorption. However, the trend of crystallite size follows the N2O pulse chemisorption. Since our aim is to measure the Cu particle sizes, it is appropriate to use N2O pulse chemisorption for the measurement of Cu particle sizes. This kind of phenomena was observed by Shohei et al.47 where Ni/γ-Al2O3 catalysts provided different kinds of Ni particle sizes in XRD and N2O pulse chemisorption studies. Nevertheless, it is worth noting that these techniques are agree generally well despite the very different physical principles involved (scattering effect vs. chemical titration).
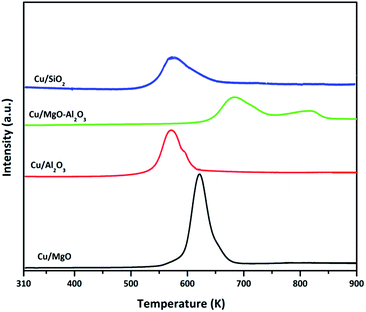
The TPR profile of Cu/SiO2 catalyst had shown a single stage reduction with a shoulder at 620 K. The lower temperature hydrogen consumption at 550 K could be attributed to the reduction of surface copper oxides species whereas a shoulder peak at 620 K corresponding to the reduction of bulk copper oxides species. Remarkably, the copper oxide reduction at lower temperatures may indicate the high reduction ability of copper over alumina and silica supports.46,48,49 By contrast, the TPR profile of Cu/MgO–Al2O3 catalyst is entirely different and exhibited two stage reduction at high temperatures compared to all other catalysts. The first hydrogen consumption peak at 670 K could be ascribed to the reduction of surface CuO whereas the second reduction at 800 K was attributed to the either reduction of interface copper oxide species or reduction of bulk CuO. Due to these unique interactions, copper might not reduce completely compared with that of other catalyst at 523 K, where all the catalysts were reduced for hydrogenation and dehydrogenation and coupling of both reactions. The amount of H2 consumed, which can be determined from the peak area, corresponded to the amount of copper presented, i.e., the H2/CuO molar ratio was close to unity. The total hydrogen consumption estimated for Cu/MgO, Cu/MgO–Al2O3, Cu/Al2O3 and Cu/SiO2 is 6.8 μmol g−1, 4.2 μmol g−1, 15.5 μmol g−1 and 20.8 μmol g−1, respectively and the degree of copper reduction is as follows in the order of Cu/SiO2 (95%) > Cu/Al2O3 (86%) > Cu/MgO (75%) > Cu/MgO–Al2O3 (59%). The results are associated with copper particle size of their catalysts. Moreover, TPR results are in accordance with N2O pulse chemisorption results; since the lower copper dispersion of Cu/MgO–Al2O3 (4%) consumed smaller amount of hydrogen and higher copper dispersion of Cu/SiO2 (18%) utilized higher hydrogen amount.
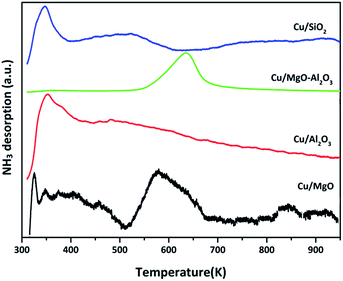
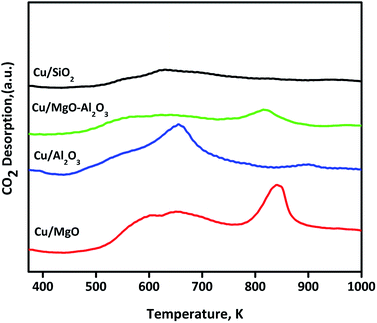
Basicity of reduced (523 K for 3 h) supported copper catalysts was determined by CO2-TPD and profiles are shown in Fig. 5. The CO2TPD profile of Cu/MgO displayed two strong CO2 desorption at 650 and 850 K, indicating the presence of moderate and strong basic sites, which influenced on catalytic activity (discussed below). In the case of Cu/Al2O3, a single desorption at Tmax of 650 K was ascribed to the moderate basic sites. Whereas, Cu/MgO–Al2O3 catalyst had two CO2 desorption at a Tmax of 643 and 850 K, corresponding to the moderate and strong basic sites, respectively. Contrarily, no strong desorption peak observed for Cu/SiO2 catalyst. The basicity is as follows in the decreasing order: Cu/MgO 438 μmol g−1 > Cu/Al2O3 224 μmol g−1 > Cu/MgO–Al2O3 180 μmol g−1 > Cu/SiO2 45 μmol g−1. These results are good accordance with literature reports.46,48,49
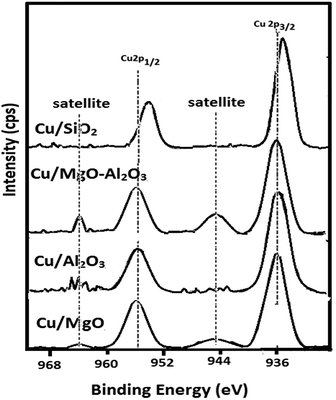
| Catalyst | Cu 2p3/2 | Cu 2p1/2 | Cu0/support ratio |
|---|---|---|---|
| Cu/MgO | 934.27 | 954.31 | 0.14 |
| Cu/Al2O3 | 933.59 | 954.27 | 0.15 |
| Cu/MgO–Al2O3 | 934.89 | 955.44 | 0.08 |
| Cu/SiO2 | 932.87 | 953.63 | 0.22 |
Furthermore, the XPS results demonstrated that the interactions between copper and supports may strongly influence on oxidation state of copper. Hence, the highly dispersed copper species did not re-oxidized whereas poorly dispersed or partially reduced copper metal species are yet again re-oxidized over the supports as the binding energy of copper in MgO and MgO–Al2O3 supported catalyst is high. In addition to that Cu0/support ratio is high for Cu/SiO2 and low for Cu/MgO–Al2O3 (See, Table 2).
3.2. Catalytic activity
Biomass is the chief source of lignin and cellulose, extraction of ACP from lignin2 and BDO from cellulose3 is well documented. Up gradation of biomass derived products has great attention in the chemical sector. As shown in Scheme 1, EB and GBL can be synthesised at a time from ACP and BDO, respectively. In another way, the in situ produced hydrogen from BDO dehydrogenation utilized in the hydrogenation of ACP for the production of EB via catalytic coupling of dehydrogenation and hydrogenation. The detailed catalytic activity study over different supported catalysts is as follows.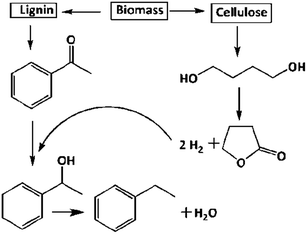 | ||
| Scheme 1 Reductive upgrading of acetophenone (ACP) to ethylbenzene (EB) and 1,4-butanediol (BDO) to γ-butyrolactone (GBL) via coupling of simultaneous hydrogenation and dehydrogenation process. | ||
| Catalyst | Conv. of BDO (%) | Sel. of GBL (%) | Sel. of THF (%) | Conv. of ACP (%) | Sel. of EB (%) |
|---|---|---|---|---|---|
| a Reaction conditions: catalyst = 0.5 g, T = 523 K, WHSV = 2 h−1, BDO or ACP = 1 mL h−1, N2 or H2 flow = 18 mL min−1. | |||||
| MgO | Nil | Nil | Nil | 2.8 | 100 |
| Γ-Al2O3 | 60 | Nil | >99 | 2.4 | 100 |
| MgO–Al2O3 | 04 | 10 | 90 | 2.5 | 100 |
| SiO2 | 04 | 99 | 01 | 2.9 | 100 |
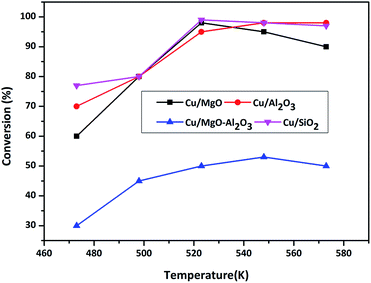 | ||
| Fig. 7 Conversion of BDO as a function of temperature over different copper catalysts. Reaction conditions: catalyst = 0.5 g, WHSV = 2 h−1, BDO feed flow = 1 mL h−1 and N2 gas flow = 18 mL min−1. | ||
Dehydrogenation of BDO transforms into GBL and H2 whereas dehydration of BDO converts into THF and H2O. Cu/MgO and Cu/SiO2 catalysts produced GBL selectively (99%) from BDO via dehydrogenation, whereas Cu/MgO–Al2O3 and Cu/Al2O3 selectively produces THF (>90%) at all temperatures. According to Hwang et al.,3 the Cu/SiO2 is highly active for cyclodehydrogenation of BDO to GBL than dehydration of BDO to THF and results provided more than 99% BDO conversion with >99% selectivity of GBL and very low amount of THF (<1%) up to 5 h of time on stream study. Based on these findings, we assumed that the very weak Bronsted sites on silica might be involving in formation of low yield of THF. Al2O3 selectively catalyse the cyclization of BDO into THF at 548 K, because of its strong surface acidity. In addition, BDO is selectively dehydrated into THF over strong acid catalysts.25–29 The influence of supported copper catalysts on dehydrogenation of BDO to GBL has been examined.1,4,24,30 Since, the dehydrogenation of BDO to GBL is favourable over acid supported catalysts, it has been conducted over acidic supported catalysts such as Cu/Cr/Mn, Cu/Cr/Zn and Cu/Zn/Al. Moreover, Cu–Zn–Al was employed for hydrogenation of maleic anhydride and dehydrogenation of BDO and results obtained high yield of GBL. In the present study, Cu/SiO2 and Cu/MgO catalysts are worked out well for this reaction.
In summary, weak to moderate acidic sites favours for the formation of GBL from BDO, whereas strong acidic sites facilitates the formation of THF. Additionally, copper metal and the support interaction might also be responsible for the catalytic activity. The activity for BDO conversion to GBL is as follows in the increasing order Cu/Al2O3 < Cu/MgO–Al2O3 < Cu/MgO < Cu/SiO2.
3.2.3.1. Effect of temperature on ACP hydrogenation. ACP hydrogenation was evaluated in the temperature range of 473–573 K under H2 flow at atmospheric pressure over supported copper catalysts and results are shown in Fig. 8.
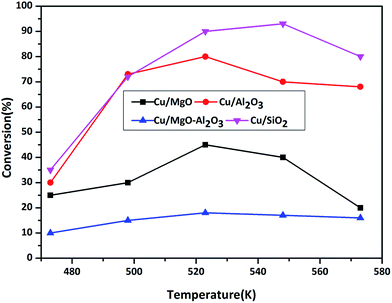 | ||
| Fig. 8 ACP transformation as a function of temperature over supported copper catalysts. Reaction conditions: catalyst = 0.5 g, WHSV = 2 h−1, ACP feed flow = 1 mL h−1 and H2 gas flow = 18 mL min−1. | ||
As shown in Scheme 3, hydrogenation of ACP can produces phE and EB. Before testing copper catalysts, effect of catalytic activity of bare supports on hydrogenation of ACP was also studied at 523 K under hydrogen and results are displayed in Table 3. Though the selectivity of EB is 100%, the conversion of ACP is <3%. Hence, the role of support is almost negligible on ACP hydrogenation reaction under the reaction conditions. When the reaction conducted over copper catalysts, the conversion of ACP is greatly improved. ACP conversion increases with the increasing of temperature up to 523 K but it decreased with further increasing in temperatures, which reflect the exothermic nature of ACP hydrogenation. Hydrogenation of ACP produced EB as a major product and PhE as a minor product. These results revealed that the conversion of ACP to EB is more favourable over Cu/SiO2 (conv. 95%) and Cu/Al2O3 (conv. 80%) catalysts compared to Cu/MgO (conv. 48%) and Cu/MgO–Al2O3 (conv. 17%) catalysts at 523 K. Interestingly, the EB selectivity (99%) is not affected, even though different supported copper catalysts were employed.
Acidic supported catalysts have been examined for the hydrogenation of ACP and found that it is hard to get 100% selectivity of EB8–23 without high hydrogen pressures. Moreover Ni and promoted Ni based catalysts had a poor selectivity towards EB due to higher activity of nickel for hydrogenation which gives over hydrogenated products like 1-cyclohexyl ethanol, cyclohexane and cyclohexene.16–22 But, high ACP conversion with high EB selectivity was reported over heterogeneous copper based catalysts using high hydrogen pressure under solvents in liquid phase.23 Noble metal catalysts such as Ru, Pd and Pt based catalysts showed high ACP conversion (80–90%) with 99% EB selectivity.8–15 In the present study, Cu/SiO2 surprisingly showed similar activity to that of noble metal catalysts. It is demonstrated that the smaller particle size of Cu0 with higher dispersion as well as acidic nature of the catalyst are contributing for higher activity compared to that of other supported catalysts. The activity is as follows in the decreasing order Cu/SiO2 > Cu/Al2O3 > Cu/MgO > Cu/MgO–Al2O3.
![[thin space (1/6-em)]](https://www.rsc.org/images/entities/char_2009.gif) :
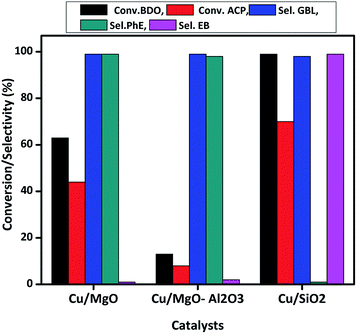
:![[thin space (1/6-em)]](https://www.rsc.org/images/entities/char_2009.gif) 1 mole ratios) reaction is carried out under N2 flow (18 mL min−1) in a fixed bed reactor over various supported copper catalysts at 523 K (optimum temperature obtained from individuals reactions) and results are shown in Fig. 9. The catalytic activity of Cu/Al2O3 in the coupling process for hydrogenation of ACP is negligible, because no hydrogen is produced from BDO, due to formation of THF.
1 mole ratios) reaction is carried out under N2 flow (18 mL min−1) in a fixed bed reactor over various supported copper catalysts at 523 K (optimum temperature obtained from individuals reactions) and results are shown in Fig. 9. The catalytic activity of Cu/Al2O3 in the coupling process for hydrogenation of ACP is negligible, because no hydrogen is produced from BDO, due to formation of THF.
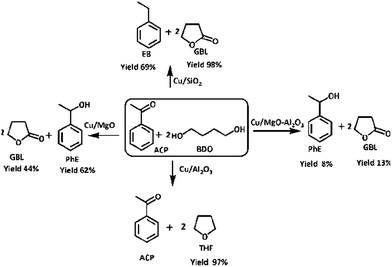 | ||
| Scheme 4 Coupling of acetophenone hydrogenation and BDO dehydrogenation over supported copper catalysts. | ||
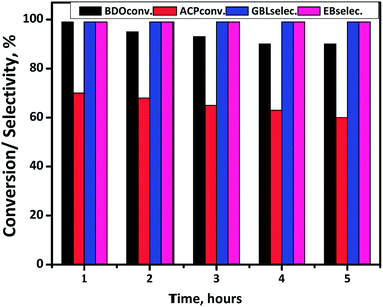
Cu/MgO catalyst has shown better performance than Cu/MgO–Al2O3 in the present coupling process and selectively produced PhE (99%), no further hydrogenated products such as EB, cyclohexane and cyclohexene are observed due to its basic nature. XPS analysis of Cu/MgO catalyst found the two types of copper species (Cu0/Cu+1) on the MgO surface, resulting in less activity and high selectivity towards PhE. Though the selectivity of GBL and PhE are more or less equal to 99%, conversion of BDO and ACP are <10% over Cu/MgO–Al2O3 due to poor copper dispersion as observed from N2O pulse chemisorption. The conversion of BDO and ACP are about 99% and 70%, respectively over Cu/SiO2 catalyst with 99% selectivity of GBL and EB. It is clearly demonstrated that catalysts acidity played a vital role in the coupling process to make EB via hydrogenolysis of ACP in presence of copper. In addition to that, high copper dispersion over SiO2 surface might enhances the hydrogenolysis of ACP.
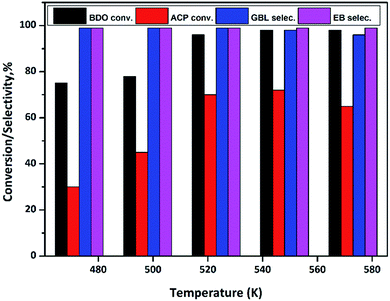
In order to find out the optimum reaction temperature of the coupling process, a study is conducted over the temperature range from 473 to 573 K over Cu/SiO2 catalyst and results are shown in Fig. 10. These results clearly show that conversion of BDO and ACP increases with increase in temperature from 473 to 523 K, however, further increasing in temperature no significant conversions observed in BDO. By contrast, ACP conversion decline at 573 K. In summary, to achieve the high conversions at lower temperature, the optimum reaction temperature seems to be 523 K.
Table 4 shows the WHSV test in the coupling process at 523 K over Cu/SiO2 catalyst. As the increase of WHSV, the conversions of ACP and BDO are decreased. Interestingly, no significant changes are noticed in both conversions at WHSV of 1 and 2 h−1. The catalytic performance of Cu/SiO2 at WHSV of 3 h−1 is low, showing 50% and 40% of BDO and ACP conversions, respectively. However, the WHSV does not influence on the selectivities of GBL and EB. Hence, the optimum WHSV of coupling reaction is 2 h−1.
| WHSV | Conv. of BDO (%) | Sel. of GBL (%) | Sel. of THF (%) | Conv. of ACP (%) | Sel. of EB (%) |
|---|---|---|---|---|---|
a Reaction conditions: catalyst = 0.5 g, T = 523 K, WHSV = 2 h−1, ACP/BDO mole ratio = 1![[thin space (1/6-em)]](https://www.rsc.org/images/entities/char_2009.gif) : :![[thin space (1/6-em)]](https://www.rsc.org/images/entities/char_2009.gif) 2, feed = 0.5,1 and 1.5 mL h−1, N2 flow = 18 mL min−1. 2, feed = 0.5,1 and 1.5 mL h−1, N2 flow = 18 mL min−1. |
|||||
| 1 | 99 | 99 | 1 | 73 | 99 |
| 2 | 98 | 99 | 1 | 70 | 99 |
| 3 | 50 | 99 | 1 | 40 | 99 |
Time-on-stream study is conducted at suitable reaction condition and results are displayed in Fig. 11. ACP and BDO conversions are 70% and 99%, respectively, with 99% selectivity of EB and GBL in the first hour. However, a gradual decrease in the conversion of both BDO and ACP is observed while the selectivities are constant. After confirming Cu/SiO2 is the best catalyst for the coupling, ACP hydrogenation is conducted using stoichiometric amount of external hydrogen and found the ACP conversion was <5%. Whereas in coupling process, the in situ produced hydrogen from BDO to GBL reaction substantially increased the conversion of ACP about 70%, indicating in situ generated H2 is several times efficient than external hydrogen. The deactivation phenomena of this Cu/SiO2 catalyst in gas-phase reactions is probably because of Cu sintering as shown in Table 1 at high reaction temperatures (523 K) as well as the partial oxidation of Cu0 state. Besides that coke formation during the reaction is also influence the stability of the catalyst.
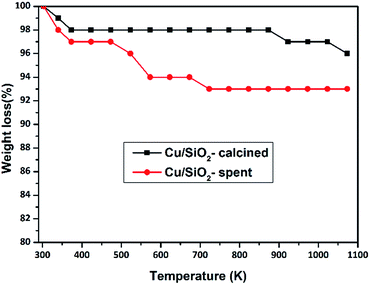
TGA analysis was used to investigate the formation of the coke and results of fresh and spent Cu/SiO2 are shown in Fig. 12. In the case of fresh catalyst, an obvious mass loss was observed at 383 K, suggesting the removal of surface water molecules. However, no significant weight loss is occurred up to 950 K that may be due to decomposition residual amount of copper nitrate species. The spent catalyst weight loss around 390 K corresponds to the surface water molecules which is formed during the reaction. In addition to that two more weight loss are noticed at 550 K and 730 K, which confirms the coke formation due to the decomposition of either reactant or product or both of the molecules. Hence, this result confirms coke is another deactivation parameter to decrease the conversions of BDO and ACP in TOS study. The low temperature weight loss could be ascribed to the removal of easily oxidized carbon whereas another high temperature weight loss was the oxidation of regular or graphitic carbon. Hence, the stabilization of activity by suitable promoter is the future plan of this piece of work.
4. Conclusions
In summary, biomass-derived ACP and BDO are selectively converted to EB/1-PhE and GBL using copper based catalysts in a single reactor at a time via simultaneous hydrogenation and dehydrogenation. Among all catalysts, Cu/SiO2 is found to be the best catalyst in terms of selective synthesis of GBL (98%) and EB (99%) whereas Cu/MgO has good performance for producing GBL (98%) and PhE (99%). The high selectivity of EB is probably because of acidic site along with more surface copper (Cu0) atoms, which favours hydrogenolysis of ACP. But in the case of Cu/MgO, the strong basicity along with presence of copper species (Cu0/Cu+1) might be responsible for only selective formation of PhE. However, Cu/γ-Al2O3 is not active for coupling process, but highly active for individual hydrogenation and dehydration reactions due to its high acidity. Contrarily, the mixed-oxide supported Cu/MgO–Al2O3 catalyst has shown very poor catalytic activity due to its lower copper dispersion. Hence, the catalytic activity of the catalysts and reaction path can be influenced by both copper and support. The study presents several advantages (i) eco-friendly continuous process (ii) biomass to value added products (iii) conducting of both the reactions at a time, (iv) ACP hydrogenation without using H2.Acknowledgements
Authors are gratefully thanks to CSIR-UGC (INDIA) for the financial support. This research was also financially supported by Basic Science Research Program through the National Research Foundation of Korea (NRF) funded by the Ministry of Education (NRF-2016R1A6A1A03013422) and New & Renewable Energy Core Technology Program of the Korea Institute of Energy Technology Evaluation and Planning (KETEP), granted financial resource from the Ministry of Trade, Industry & Energy, Republic of Korea (No. 20143030091040).Notes and references
- H. P. R. Kannapu, C. A. Mullen, Y. Elkasabi and A. A. Boateng, Fuel Process. Technol., 2015, 137, 220–228 CrossRef.
- C. Gonzalez, P. Marin, F. V. Diez and S. Ordonez, Energy Fuels, 2015, 29, 8208–8215 CrossRef CAS.
- D. W. Hwang, P. Kashinathan, J. M. Lee, J. H. Lee, U.-H. Lee, J.-S. Hwang, Y. K. Wanga and J.-S. Chang, Green Chem., 2011, 13, 1672–1675 RSC.
- K. Hari Prasad Reddy, N. Anand, V. Venkateswarulu, K. S. Rama Rao and B. David Raju, J. Mol. Catal. A: Chem., 2012, 355, 180–185 CrossRef.
- E. H. Lee, Catal. Rev., 1973, 8, 285–305 CAS.
- Y. Kashiwagi, K. Uchiyama, F. Kurashima, C. Kikuchi and J. Anzai, Chem. Pharm. Bull., 1999, 47, 1051–1052 CrossRef CAS.
- S. Liu, F. Chen, S. Xie, P. Zeng, X. Du and L. Xu, J. Nat. Gas Chem., 2009, 18, 21–24 CrossRef CAS.
- G. F. Santori, A. G. Moglioni, V. Vetere, G. Y. M. Iglesias, M. L. Casella and O. A. Ferretti, Appl. Catal., A, 2004, 269, 215–223 CrossRef CAS.
- C. Chen, H. Chen and W. Cheng, Appl. Catal., A, 2003, 248, 117–128 CrossRef CAS.
- L. Cerveny, Z. Belohlav and M. N. H. Hamed, Res. Chem. Intermed., 1996, 22, 15–22 CrossRef CAS.
- M. Casagrande, L. Storaro, A. Talon, M. Lenarda, R. Frattini, E. Rodrastellón and P. Maireles-Torres, J. Mol. Catal. A: Chem., 2002, 188, 133–139 CrossRef CAS.
- H. Cheng, J. Hao, H. Wang, C. Xi, X. Meng, S. Cai and F. Zhao, J. Mol. Catal. A: Chem., 2007, 278, 6–11 CrossRef CAS.
- M. A. Aramendía, V. Borau, J. F. Gómez, A. Herrera, C. Jiménez and J. M. Marinas, J. Catal., 1993, 140, 335–343 CrossRef.
- A. Drelinkiewicza, A. Waksmundzka, W. Makowski, J. W. Sobczak, A. Król and A. Zieba, Catal. Lett., 2004, 94, 143–156 CrossRef CAS.
- S. D. Lin, D. K. Sanders and M. A. Vannice, Appl. Catal., A, 1994, 11, 59–73 CrossRef.
- J. Masson, S. Vidal, P. Cividino, P. Fouillox and J. Court, Appl. Catal., A, 1993, 99, 147–159 CrossRef CAS.
- J. Masson, P. Cividino and J. Court, Appl. Catal., A, 1997, 161, 191–197 CrossRef CAS.
- J. Masson, P. Cividino, J. M. Bonnier and P. Fouillox, Stud. Surf. Sci. Catal., 1991, 59, 245–252 CrossRef CAS.
- P. S. Kumbhar, Appl. Catal., A, 1993, 96, 241–252 CrossRef CAS.
- J. M. Bonnier, J. Court and P. T. Wierzchowski, Appl. Catal., 1989, 53, 217–231 CrossRef CAS.
- R. V. Malyala, C. V. Rode, M. Arai, S. G. Hegde and R. V. Chaudhari, Appl. Catal., A, 2000, 193, 71–86 CrossRef CAS.
- M. V. Rajashekharam, I. Bergault, P. Fouilloux, D. Schweich, H. Delmas and R. V. Chaudhari, Catal. Today, 1999, 48, 83–92 CrossRef CAS.
- N. M. Bertero, C. R. Apesteguía and A. J. Marchi, Appl. Catal., A, 2008, 349, 100–109 CrossRef CAS.
- K. Hari Prasad Reddy, R. Rahul, S. Sree Vardhan Reddy, B. David Raju and K. S. Rama Rao, Catal. Commun., 2009, 10, 879–883 CrossRef CAS.
- H. Inoue, S. Sato, R. Takahashi, Y. Izawa, H. Ohno and K. Takahashi, Appl. Catal., A, 2009, 352, 66–73 CrossRef CAS.
- A. Igarashi, S. Sato, R. Takahashi, T. Sodesawa and M. Kobune, Catal. Commun., 2007, 8, 807–810 CrossRef CAS.
- N. Yamamoto, S. Sato, R. Takahashi and K. Inui, Catal. Commun., 2005, 6, 480–484 CrossRef CAS.
- N. Yamamoto, S. Sato, R. Takahashi and K. Inui, J. Mol. Catal. A: Chem., 2006, 243, 52–59 CrossRef CAS.
- S. Sato, R. Takahashi, T. Sodesawa and N. Honda, J. Mol. Catal. A: Chem., 2004, 221, 177–183 CrossRef CAS.
- Y.-L. Zhu, J. Yang, G.-Q. Dong, H.-Y. Zheng, H.-H. Zhang, H.-W. Xiang and Y.-W. Li, Appl. Catal., B, 2005, 57, 183–190 CrossRef CAS.
- D. Zhang, H. Yin, R. Zhang, J. Xue and T. Jiang, Catal. Lett., 2008, 122, 176–182 CrossRef CAS.
- Y. Yu, Y. Guo, W. Zhan, Y. Guo, Y. Wang, Y. Wang, Z. Zhang and G. Lu, J. Mol. Catal. A: Chem., 2011, 337, 77–81 CrossRef CAS.
- M. Ueshima and Y. Shimasaki, Catal. Lett., 1992, 15, 405–411 CrossRef CAS.
- M. Glinski, Appl. Catal., A, 2008, 349, 133–139 CrossRef CAS.
- R. Shi, F. Wang, X. Mu, Y. Li, X. Huang and W. Shen, Catal. Commun., 2009, 11, 306–309 CrossRef CAS.
- J. Yang, H.-Y. Zheng, Y.-L. Zhu, G.-W. Zhao, C.-H. Zhang, B.-T. Teng, H. Xiang and Y. Li, Catal. Commun., 2004, 5, 505–510 CrossRef CAS.
- H.-Y. Zheng, Y.-L. Zhu, L. Huang, Z.-Y. Zeng, H.-J. Wan and Y.-W. Li, Catal. Commun., 2008, 9, 342–348 CrossRef CAS.
- B. M. Nagaraja, A. H. Padmasri, P. Seetharamulu, K. Hari Prasad Reddy, B. David Raju and K. S. Rama Rao, J. Mol. Catal. A: Chem., 2007, 278, 29–37 CrossRef CAS.
- B. M. Nagaraja, A. H. Padmasri, B. David Raju and K. S. Rama Rao, Int. J. Hydrogen Energy, 2011, 36, 3417–3425 CrossRef CAS.
- A. Malaika and M. Kozłowski, Chem. Eng. J., 2011, 171, 1348–1355 CrossRef CAS.
- Y. Saito, M. Yamashita, E. Ito and N. Meng, Int. J. Hydrogen Energy, 1994, 19, 223–226 CrossRef CAS.
- B. M. Nagaraja, V. Siva Kumar, V. Shashikala, A. H. Padmasri, S. Sreevardhan Reddy, B. David Raju and K. S. Rama Rao, J. Mol. Catal. A: Chem., 2004, 223, 339–345 CrossRef CAS.
- C. V. Pramod, V. Mohan, B. David Raju and K. S. Rama Rao, Catal. Lett., 2013, 143, 432–437 CrossRef CAS.
- P. Sangeetha, K. Shanthi, K. S. Rama Rao, B. Viswanathan and P. Selvam, Appl. Catal., A, 2009, 353, 160–165 CrossRef CAS.
- C. J. G. Van Der Grift, A. mulder and J. W. Geus, Appl. Catal., 1990, 60, 181–192 CrossRef CAS.
- W. Sun, D.-Y. Liu, H.-Y. Zhu, L. Shi and Q. Sun, Catal. Commun., 2010, 12, 147–150 CrossRef CAS.
- S. Tada, M. Yokoyama, R. Kikuchi, T. Haneda and H. Kameyama, J. Phys. Chem. C, 2013, 117, 14652–14658 CAS.
- Z. Yuan, J. Wang, L. Wang, W. Xie, P. Chen, Z. Hou and X. Zheng, Bioresour. Technol., 2010, 101, 7088–7092 CrossRef CAS PubMed.
- H. Yahiro, K. Murawaki, K. Saiki, T. Yamamoto and H. Yamaura, Catal. Today, 2007, 126, 436–440 CrossRef CAS.
| This journal is © The Royal Society of Chemistry 2017 |

