 Open Access Article
Creative Commons Attribution 3.0 Unported Licence
Transformation and release of phosphorus from waste activated sludge upon combined acid/alkaline treatment†
Zhang-Wei He a,
Cong-Cong Tanga,
Ling Wanga,
Ze-Chong Guoa,
Ai-Juan Zhoud,
Dan Sun*b,
Wen-Zong Liu*c and
Ai-Jie Wangac
aState Key Laboratory of Urban Water Resource and Environment, Harbin Institute of Technology (SKLUWRE, HIT), 202 Haihe Road, Harbin, 150090, China
bOcean College, Zhejiang University, Zhoushan, 316021, China. E-mail: dsun@zju.edu.cn; Fax: +86-580-2092206; Tel: +86-580-2092206
cKey Laboratory of Environmental Biotechnology, Research Center for Eco-Environmental Sciences, Chinese Academy of Sciences, 18 Shuangqing Road, Haidian District, Beijing 100085, China. E-mail: liuwz0326@126.com; Fax: +86-451-86282110; Tel: +86-451-86282110
dCollege of Environmental Science and Engineering, Taiyuan University of Technology, Taiyuan 030024, China
First published on 14th July 2017
Abstract
This study was conducted to investigate migration and transformation of phosphorus (P) in waste activated sludge (WAS) during sequential processes of acid and alkaline treatments. The P mass balance analysis and the transformation of various P species from solid to liquid phase were also studied. Compared with single acid or alkaline experiments, the migration of total solid-P to liquid-P was promoted by the acid-alkaline sequential treatment. Acid-alkaline sequential treatment increased dissolution of non-apatite IP (NAIP) and decreased apatite P sediments in the final alkaline from the released species, resulting in enhancing the inorganic P (IP) transformation from solid to liquid phase. The maximal accumulation of molybdate reactive P (MRP) in liquid was 520 mg L−1, accounting for 54.7% of total P. However, the P release was reduced when alkaline-acid sequential treatment was used because of a low liquid P release from NAIP. It was found that solid-P transforming to liquid-MRP was mainly regulated by pseudo-chemical reactions regardless of a constant or changed pH. The release efficiencies of NAIP under both alkaline and acid-alkaline conditions were more than 88.0%, whereas it was only 6.2% with alkaline-acid treatment. The findings in this study can help to understand the phosphate release and migration rules under different WAS treatment conditions for future P recovery.
1. Introduction
Phosphorus (P), an essential and non-renewable mineral resource, is mostly obtained from the phosphate rock, which is estimated to be depleted in the near future.1,2 Thus the recovery of P from secondary waste streams is receiving great attention.3–5 Waste activated sludge (WAS) is greatly generated as the by-product of wastewater treatment plants.6–8 It has been reported that the content of P in dried sludge is around 2% in the conventional activated sludge process and 4–10% in the enhanced biological phosphorus removal process.9 Considering the high production amount and P content of WAS, it can be an alternative P resource. However, WAS is a low efficient agriculture fertilizer, which cannot be directly served for food production because of the low P release from cells or cell structure to soluble phosphate.10,11 Therefore, the release of P from WAS is the most important step for P recovery.11 However, understanding of phosphate release and migration mechanism under different WAS treatment conditions is still lacking.It has been reported that WAS contained various P species, and P element connected with either organic matters or cations can be expressed by the standards, measurements, and testing (SMT) protocol.12,13 According to SMT protocol, P species in solid phase of sludge could be divided into five forms: total solid P (TSP), organic P (OP), inorganic P (IP), apatite P (AP, P forms associated with Ca) and non-apatite IP (NAIP, P forms associated with oxides and hydroxides of Al, Fe, Mg and Mn). TSP is the sum of OP and IP, and IP is the sum of NAIP and AP.9,14 IP, existing as phosphate sediments, is the main P form in WAS9,14 and therefore pH is a crucial factor for the migration of P from solid to liquid phase.9,15 To date, acid or alkaline treatment has been proven to be effective for P release from WAS.9,15,16 However, almost all existing studies are mainly focused on the performance of P release under different concentrations or integrated factors.9,17,18 Few researches pointed out that the release efficiency of main P species in WAS was substantially dependent on the conversion and transport of various P species, which was significantly controlled by the pH conditions.9,16 The mechanism is still not clear to understand the relationship of pH and P species change, which is greatly related to the method selected for P release from WAS. In addition, WAS is a type of resource containing abundant carbon, nitrogen and P,6,7,9 and therefore, alkaline anaerobic digestion has been selected as the main way to recover resources from WAS.7,9 Recently, most report have mainly focused on carbon source recovery,19–23 but some of them have turned their attention to P migration and transformation during the anaerobic digestion process. It was earlier noticed that a simultaneous P release may be accompanied by changes of acid-alkaline sequential treatments, which may cause positive synergies on the release of P, but it has not yet been well understood.
Previous study reported that acidic condition was more favourable for P release, and alkaline conditions decreased the dissolved P when the pH was just adjusted at the beginning.16 As well known, acid and alkaline treatments, particularly the latter, can disrupt sludge flocs and further cause cell disintegration,24,25 and then the pH would change because of organic matter accumulation. Herein, this study included experiments under constant pH, and some different results were observed. In addition, this study was also conducted to investigate the combined effects of acid and alkaline conditions on the release of different P species from solid to liquid phase, particularly, how pH affects the dissolution of AP and NAIP and their transport rules. The P mass balance analysis and the transformation of various P species from solid to liquid phase were employed to understand the mechanisms. Molybdate reactive P (MRP) was used to evaluate the potentially recoverable P from WAS after different treatments.
2. Materials and methods
2.1 Source of WAS
The WAS was taken from the secondary sedimentation tank of a local wastewater treatment plant (Harbin, China), running with anaerobic-anoxic-aerobic process. The WAS was thickened by gravitational sedimentation for 24 h at 4 °C and was then screened with a 1 mm sieve to remove the impurities. It was stored at 4 °C for subsequent tests. The main characteristics are listed in Table 1.| Parameters | Contents |
|---|---|
| TSS | 31.18 ± 0.51 g L−1 |
| VSS | 15.70 ± 0.37 g L−1 |
| TCOD | 30.51 ± 0.96 g L−1 |
| SCOD | 194 ± 10 mg L−1 |
| NH4+ | 12.24 ± 0.75 mg L−1 |
| TP | 30.49 ± 0.36 mg per g TSS |
| TDP | 44.53 ± 1.46 mg L−1 |
| PO43− | 42.53 ± 1.47 mg L−1 |
| pH | 6.72 ± 0.01 |
2.2 Experimental set-up and operation
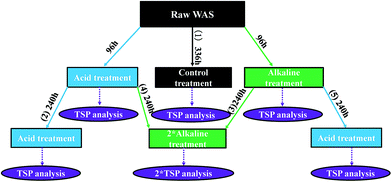
To investigate migration performance of solid-P to liquid-P during the different changes occurring in the sequential acid and alkaline treatments, five groups of experiments were set up (Fig. 1). There were 21 batch laboratory-scale anaerobic fermentation reactors contained in 500 mL serum bottles, each of which was filled with 350 mL WAS. The reactors were capped, sealed, and stirred in an air-bath shaker (100 rpm) at 35 ± 1 °C. All the experiments were carried out in triplicate. The pH was controlled at 4.0 for acid treatment and 12.0 for alkaline treatment in the entire span of 14 days,9 while the pH of acid-alkaline sequential treatment and alkaline-acid sequential treatments was changed at 4 day fermentation time. The constant pH demand was achieved by adding 4 M NaOH or 4 M HCl.2.3 Analytical methods
Sludge samples collected from the reactors were centrifuged at 10![[thin space (1/6-em)]](https://www.rsc.org/images/entities/char_2009.gif) 000 rpm for 10 min. Then, the supernatant samples were filtered by 0.45 μm cellulose nitrate membrane filters, and filtrated samples were finally stored at 4 °C, prior to analysis. The liquid-P was divided into three forms: total dissolved P (TDP), MRP and OP, where the MRP is defined as PO43−, and OP is calculated as the difference between TDP and MRP (i.e., OP = TDP − MRP).13,26 The measurements of total suspended solid (TSS), volatile suspended solid (VSS), total chemical oxygen demand (TCOD), soluble chemical oxygen demand (SCOD), NH4+, TDP, MRP and pH were consistent with the previous studies.9,27 The solid-P was analyzed according to the SMT protocol, and the detailed extraction procedures and analysis methods for each P form were the same as in the previous publications.9
000 rpm for 10 min. Then, the supernatant samples were filtered by 0.45 μm cellulose nitrate membrane filters, and filtrated samples were finally stored at 4 °C, prior to analysis. The liquid-P was divided into three forms: total dissolved P (TDP), MRP and OP, where the MRP is defined as PO43−, and OP is calculated as the difference between TDP and MRP (i.e., OP = TDP − MRP).13,26 The measurements of total suspended solid (TSS), volatile suspended solid (VSS), total chemical oxygen demand (TCOD), soluble chemical oxygen demand (SCOD), NH4+, TDP, MRP and pH were consistent with the previous studies.9,27 The solid-P was analyzed according to the SMT protocol, and the detailed extraction procedures and analysis methods for each P form were the same as in the previous publications.9
2.4 Kinetic modeling for MRP accumulation in liquid phase
Two kinetic models, pseudo-first-order (eqn (1)) and pseudo-second-order (eqn (2)) models are employed to interpret the kinetics of MRP accumulation process.26
ln(qe − qt) = ln![[thin space (1/6-em)]](https://www.rsc.org/images/entities/char_2009.gif) qe − k1t qe − k1t
| (1) |
 | (2) |
2.5 Contribution identification of different solid-P to liquid-P
A transformation contribution equation is applied to identify the contributions of different solid-P fractions to the increased TDP. It can be expressed by the following calculation:9
 | (3) |
In addition, the contributions of transformed AP and NAIP to IP was also evaluated, and it can be calculated by the eqn (6), listed as follows:
 | (4) |
3. Results and discussion
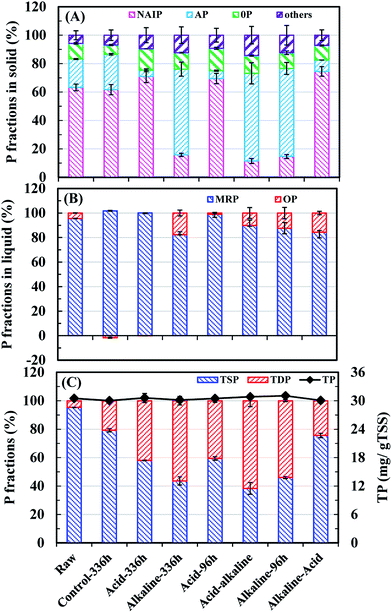
3.1 P mass balance analysis
The migration and transformation of different P species from solid to liquid phases were evaluated by the P balance analysis (Fig. 2). In WAS components, IP, consisting of AP and NAIP, was the main fraction of TSP under all conditions, in the range of 73.1–86.6%. The release efficiency of various solid components was substantially determined by the different chemical properties of NAIP and AP under different pHs. Liquid-P was mainly released from AP and it contributed to the TSP reduction in acid or alkaline-acid sequential treatment processes. Liquid-P from NAIP was efficiently released in the alkaline treatment or the acid-alkaline sequential treatment, and this part of released P accounted for more than 80.0% of solid-IP and 60.0% of TSP. In the control test, liquid-P was also released primarily from NAIP because of the decrease in pH due to the production of volatile acids during fermentation. Therefore, compared to the raw sludge decomposition, a final acid condition mainly led to AP dissolution, whereas most NAIP was dissolved in the final alkaline condition. Jin et al. studied the P release performance in lake sediments under different pH and obtained a similar conclusion.9,14 Most of the reduced TSP was converted to liquid-MRP, rather than liquid-OP (Fig. 2(B)), particularly in acid treatment, where the percentage of MRP content was more than 98.0%.Fig. 2(C) shows that both alkaline and acid treatments were effective for the migration of solid-P to liquid-P, but inorganic P release was much more efficient under alkaline conditions. It is noteworthy that a slight increase of TSP dissolution was obtained using the acid-alkaline sequential treatment, and the increased part was 7.7% higher than that in the alkaline treatment and 19.7% higher than that in the acid treatment. However, a significant decrease of P migration from solid to liquid phase happened on using alkaline-acid sequential treatment, which was 17.5% less than that of the acid treatment and 32.0% less than that of the alkaline treatment. The alkaline-acid sequential treatment further led to the reduction of dissolved P, which transformed to sediments by the reformation of NAIP when pH was changed from alkaline to acid. Thus it can be concluded that for NAIP-based WAS, alkaline treatment and acid-alkaline treatment were more competitive in case of solid-P dissolution than acid treatment or alkaline-acid treatments.
3.2 Transformation and release efficiency of various P species from solid to liquid phase
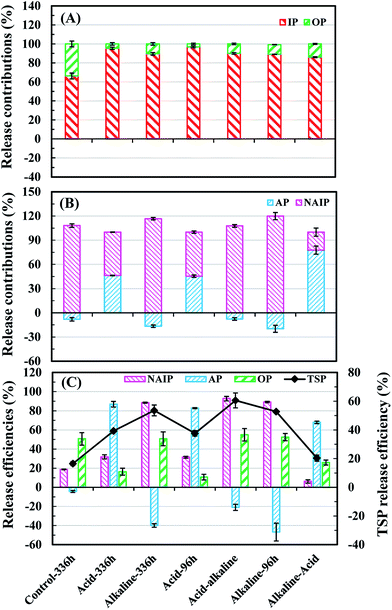
The dissolved IP was the main source of liquid-P under any conditions, accounting for 66.3–96.9% of TDP (Fig. 3(A)). Moreover, the liquid-P from NAIP mainly contributed to IP dissolution under control at alkaline and acid-alkaline conditions; in contrast, dissolved IP mainly came from AP dissolution under alkaline-acid conditions (Fig. 3(B)). Fig. 3(C) depicts the release efficiencies of different P fractions in solid phase. NAIP can dissolve under wide pH conditions due to its extremely unstable property, but alkaline environment exhibited the most positive effects on NAIP dissolution. More than 88.0% NAIP was transformed to other P fractions under alkaline treatments.Acid-alkaline sequential treatment resulted in a slightly higher release than the alkaline treatment alone. In acid-alkaline treatment, AP species was formed less than that of sole alkaline conditions (Fig. 3(C)) and made an extra contribution for P release from solid to liquid phase. When treatment method was changed from acid to alkaline conditions, the MRP from AP dissolution may have combined with metal ions to form NAIP,28,29 and the newly formed NAIP increased the amount of the total released P in the alkaline phase that followed.9,14 Herein, alkaline treatment transformed a part of liquid P to AP, which was approximately 2 times higher than that in the acid-alkaline sequential treatment (Fig. 3(C)). This ion-exchange and dissolution–precipitation process not only led to less AP formation in the acid-alkaline sequential treatment compared to sole alkaline conditions, but also contributed to the migration of solid-P to liquid-P. In alkaline-acid treatment, though most of NAIP (more than 88.0%) was dissolved during the 96 h-alkaline phase (Fig. 3(C)), the MRP in liquid phase could combine with metal ions to form NAIP again when the pH was changed from alkaline to acid conditions.28,30 The AP, which formed at the first 96 h-alkaline treatment phase (Fig. 3(C)), was negative to AP dissolution in the acid treatment that followed. As a result, the release efficiency of NAIP was lowest (6.21%) under the alkaline-acid treatment, and AP release efficiency was lower than that of the acid treatment. It was notable that the OP release efficiency under alkaline-acid treatment was lower than that in the alkaline treatment at 96 h fermentation time (Fig. 3(C)). The reason was that the released OP at the first 96 h alkaline phase might be adsorbed by the chemical-precipitation process occurring under the sequential acid treatment. Based on the above results and discussion, the order of the treatment methods by descending TSP release efficiencies is as follows: acid-alkaline (60.5%) > alkaline (53.6%) > acid (39.2%) > alkaline-acid (20.3%) ≈ control (16.5%) treatments.
3.3 Recoverable P evaluation after different treatments
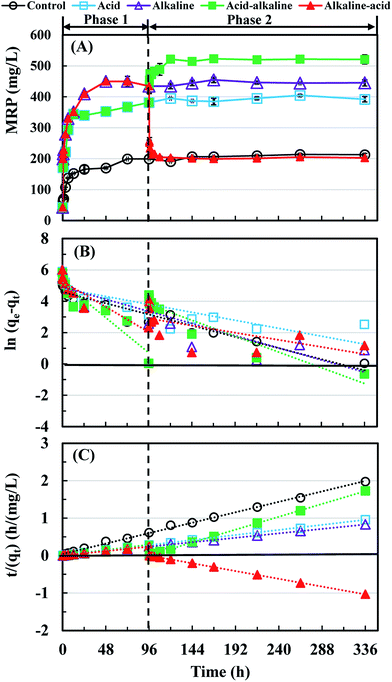
Currently, hydroxyapatite or struvite precipitation is the main way to recover P from sludge supernatant,31,32 and then the supernatant after P extraction can be used as the carbon source for the enhanced biological nutrients removal process.33,34 Therefore MRP accumulation was used to evaluate the potentially recoverable P from WAS after the different treatments. As shown in Fig. 4(A), it is clear that the acid-alkaline treatment showed a further increase on liquid-MRP accumulation compared with acid treatment or alkaline treatment, but a significant decrease occurred in the alkaline-acid treatment. The maximal liquid-MRP accumulation, 520 mg L−1, accounting for 54.7% of total P, was 1.44, 1.19 and 2.57 times higher than that of acid, alkaline and alkaline-acid treatments, respectively. | ||
| Fig. 4 Migration performance and kinetics of solid-P to liquid-P. (A) Migration performance, (B) pseudo-first-order model, and (C) pseudo-second-order model. | ||
It can be seen that the plots of the experimental data in the form of t/qt versus t is nearly a straight line compared to ln(qe − qt) versus t under any conditions in both phases 1 and 2 (Fig. 4(B) and (C)). In addition, the model data fitted well to the measured data (Table 2 and Fig. S1†). These results indicated that the pseudo-chemical reactions mainly occurred during the accumulation of liquid-MRP regardless of a constant or a change in pH. The reason might be that IP was the major P fraction in raw sludge, and the acid or alkaline treatment might have affected the migration of solid-P to liquid-MRP mainly by the precipitation-dissolution effects.9,16
| pH | qe,exp (mg L−1) | Pseudo-first-order kinetic model | Pseudo-second-order kinetic model | ||||
|---|---|---|---|---|---|---|---|
| k1 (h−1) | qe,cal (mg L−1) | R2 | k2 (L (mg−1 h−1)) | qe,cal (mg L−1) | R2 | ||
| Control (336 h) | 207.98 | 0.0149 | 188.21 | 0.925 | 7.69 × 10⁻⁴ | 214.94 | 0.998 |
| Acid (336 h) | 397.70 | 0.0106 | 166.30 | 0.685 | 8.80 × 10⁻⁴ | 399.67 | 0.999 |
| Alkaline (336 h) | 442.21 | 0.0162 | 178.18 | 0.818 | 1.64 × 10⁻³ | 442.53 | 0.999 |
| Acid-alkaline (96 h) | 374.48 | 0.0469 | 225.57 | 0.884 | 1.61 × 10⁻³ | 375.86 | 0.998 |
| Acid-alkaline (336 h) | 520.00 | 0.021 | 718.41 | 0.905 | 5.60 × 10⁻³ | 522.58 | 0.999 |
| Alkaline-acid (96 h) | 444.74 | 0.0337 | 235.73 | 0.833 | 1.60 × 10⁻³ | 442.53 | 0.998 |
| Alkaline-acid (336 h) | 203.01 | 0.0095 | 389.52 | 0.415 | −0.369 | 202.09 | 0.999 |
4. Conclusion
The present study investigated the release performance of different P species from waste activated sludge (WAS) during the different change in sequential acid and alkaline treatments. For NAIP-based WAS, alkaline treatment and acid-alkaline treatment were more competitive for solid-P dissolution compared to both acid treatment and alkaline-acid treatment. Furthermore, alkaline-acid treatment led the dissolved P under alkaline treatment to be transformed to sediments by reforming NAIP. Order of the treatment methods by descending TSP release efficiencies is as follows: acid-alkaline > alkaline > acid > alkaline-acid ≈ control treatments. In addition, the maximal potentially recoverable P accumulation, 520 mg L−1, accounting for 54.7% of total P, was also obtained under acid-alkaline conditions. Moreover, it was also found that the MRP accumulation process was mainly regulated by pseudo-chemical reactions, regardless of a constant or changed pH. This study may provide some solutions for P release from WAS and further P recovery.Acknowledgements
This research was supported by the National Natural Science Foundation of China (No. 51578534) and the Youth Innovation Promotion Association CAS (2017062).References
- B. E. Rittmann, B. Mayer, P. Westerhoff and M. Edwards, Chemosphere, 2011, 84, 846–853 CrossRef CAS PubMed
.
- P. Walan, S. Davidsson, S. Johansson and M. Höök, Resour., Conserv. Recycl., 2014, 93, 178–187 CrossRef
.
- B. L. Sørensen, O. L. Dall and K. Habib, Waste Manag., 2015, 45, 391–399 CrossRef PubMed
.
- Z. Tan and A. Lagerkvist, Renewable Sustainable Energy Rev., 2011, 15, 3588–3602 CrossRef CAS
.
- C. J. Dawson and J. Hilton, Food Pol., 2011, 36, S14–S22 CrossRef
.
- Z. He, C. Yang, L. Wang, Z. Guo, A. Wang and W. Liu, Chem. Eng. J., 2016, 290, 125–135 CrossRef CAS
.
- G. Yang, G. Zhang and H. Wang, Water Res., 2015, 78, 60–73 CrossRef CAS PubMed
.
- Z. He, A. Zhou, C. Yang, Z. Guo, A. Wang, W. Liu and J. Nan, RSC Adv., 2015, 5, 48413–48420 RSC
.
- Z. He, W. Liu, L. Wang, C. Tang, Z. Guo, C. Yang and A. Wang, Bioresour. Technol., 2016, 222, 217–225 CrossRef CAS PubMed
.
- V. Kumar Tyagi and S. Lo, Renewable Sustainable Energy Rev., 2013, 25, 708–728 CrossRef
.
- X. Zhang, H. Spanjers and J. B. van Lier, J. Environ. Manage., 2013, 131, 44–54 CrossRef CAS PubMed
.
- R. Li, J. Yin, W. Wang, Y. Li and Z. Zhang, Waste Manag., 2014, 34, 1211–1216 CrossRef CAS PubMed
.
- C. Xie, J. Zhao, J. Tang, J. Xu, X. Lin and X. Xu, Bioresour. Technol., 2011, 102, 2455–2461 CrossRef CAS PubMed
.
- X. Jin, S. Wang, Y. Pang and F. Chang Wu, Environ. Pollut., 2006, 139, 288–295 CrossRef CAS PubMed
.
- M. A. Latif, C. M. Mehta and D. J. Batstone, Water Res., 2015, 81, 288–293 CrossRef CAS PubMed
.
- Y. Xu, H. Hu, J. Liu, J. Luo, G. Qian and A. Wang, Chem. Eng. J., 2015, 267, 260–265 CrossRef CAS
.
- M. Kim, D. Han and D. Kim, Bioresour. Technol., 2015, 190, 522–528 CrossRef CAS PubMed
.
- W. Bi, Y. Li and Y. Hu, Bioresour. Technol., 2014, 166, 1–8 CrossRef CAS PubMed
.
- W. Liu, Z. He, C. Yang, A. Zhou, Z. Guo, B. Liang, C. Varrone and A. Wang, Biotechnol. Biofuels, 2016, 9, 83–98 CrossRef PubMed
.
- Z. Guo, A. Zhou, C. Yang, B. Liang, T. Sangeetha, Z. He, L. Wang, W. Cai, A. Wang and W. Liu, Biotechnol. Biofuels, 2015, 8, 192–206 CrossRef PubMed
.
- C. Yang, A. Zhou, Z. He, L. Jiang, Z. Guo, A. Wang and W. Liu, Environ. Sci. Pollut. Res., 2015, 22, 9100–9109 CrossRef CAS PubMed
.
- L. Wang, W. Liu, L. Kang, C. Yang, A. Zhou and A. Wang, Int. J. Hydrogen Energy, 2014, 39, 11913–11919 CrossRef CAS
.
- W. Liu, S. Huang, A. Zhou, G. Zhou and N. Ren, Int. J. Hydrogen Energy, 2012, 37, 13859–13864 CrossRef CAS
.
- Y. Yuan, S. Wang, Y. Liu, B. Li, B. Wang and Y. Peng, Bioresour. Technol., 2015, 197, 56–63 CrossRef CAS PubMed
.
- Y. Chen, S. Jiang, H. Yuan, Q. Zhou and G. Gu, Water Res., 2007, 41, 683–689 CrossRef CAS PubMed
.
- Z. He, W. Liu, L. Wang, C. Yang, Z. Guo, A. Zhou, J. Liu and A. Wang, Bioresour. Technol., 2016, 202, 59–66 CrossRef CAS PubMed
.
- C. C. Tang, W. Zuo, Y. Tian, N. Sun, Z. W. Wang and J. Zhang, Bioresour. Technol., 2016, 222, 156–164 CrossRef CAS PubMed
.
- S. Petzet, B. Peplinski and P. Cornel, Water Res., 2012, 46, 3769–3780 CrossRef CAS PubMed
.
- M. Takahashi, S. Kato, H. Shima, E. Sarai and T. Ichioka, Chemosphere, 2001, 44(1), 23–29 CrossRef CAS PubMed
.
- M. Takahashi, S. Kato and S. Iwasaki, J. Adv. Sci., 2001, 13, 163–166 CrossRef CAS
.
- J. D. Doyle and S. A. Parsons, Water Res., 2002, 36, 3925–3940 CrossRef CAS PubMed
.
- M. Xie, L. D. Nghiem, E. P. William and M. Elimelech, Environ. Sci. Technol. Lett., 2014, 1, 191–195 CrossRef CAS
.
- F. Liu, Y. Tian, Y. Ding and Z. Li, Bioresour. Technol., 2016, 219, 6–13 CrossRef CAS PubMed
.
- J. Tong and Y. Chen, Environ. Sci. Technol., 2007, 41, 7126–7130 CrossRef CAS PubMed
.
Footnote |
| † Electronic supplementary information (ESI) available. See DOI: 10.1039/c7ra03696e |
| This journal is © The Royal Society of Chemistry 2017 |


