 Open Access Article
Creative Commons Attribution 3.0 Unported Licence
Fabrication and investigation of high-quality glass-ceramic (GC)–polymethyl methacrylate (PMMA) composite for regenerative medicine†
Ricardas Golubevasa,
Aleksej Zarkova,
Laurynas Alinauskasa,
Zivile Stankeviciutea,
Giedrius Balciunas b,
Edita Garskaite
 *a and
Aivaras Kareivaa
aInstitute of Chemistry, Vilnius University, Naugarduko 24, Vilnius LT-03225, Lithuania. E-mail: edita.garskaite@chf.vu.lt
bScientific Institute of Thermal Insulation, Vilnius Gediminas Technical University, Linkmenu st. 28, Vilnius LT-08217, Lithuania
First published on 3rd July 2017
Abstract
The preparation of a glass-ceramic (GC)–polymethyl methacrylate (PMMA) composite material is reported. Precursor GC powders were synthesised via sol–gel method at 600 °C. XRD analysis revealed the formation of sodium calcium silicate (Na6Ca3Si6O18) as a main constituent phase of GC powders. The cylindrical-shaped GC–PMMA composite samples with fractional GC content ranging from 75 to 95% were prepared via photopolymerization reaction. The largest compressive strength for the composites containing 90% of GC has been determined. The growth of ceramic layer on the surface of composites immersed into simulated body fluid (SBF) under static conditions was studied by ICP-OES, FE-SEM/EDX, FTIR and XRD techniques. The changes in the concentrations of Ca, Si and P after the dissolution indicate the degradation process of GC–PMMA composites. The structures of the resultant surface confirmed the formation of new ceramic layer on the surface of composite materials. FTIR and XRD analyses revealed the deposition of low-crystallinity calcium phosphate layer with the composition similar to that of the carbonated hydroxyapatite (cHAP) after the soaking in SBF.
1. Introduction
Biomaterials for bone repair receive considerable attention worldwide. Currently, the autograft bone (i.e. bone from the patient) is the gold standard in the treatment of various bone defects and performing spinal fusion procedures.1,2 Bone allografts (i.e. taken from a donor) or xenografts (i.e. bone from an animal source) can be used as alternatives; however, they suffer from potential risks such as disease transmission, adverse host immune response, they are in short supply and are also expensive. The global bone grafts and substitutes market is projected to rise steadily and reach US$2.7 billion by 2020 with a compound annual growth rate of 3.8%.3 Therefore, the scaffold engineering for bone regenerative medicine is an alternative strategy and has been an area of great focus.4–6Bioactive glasses (amorphous, Ca- and possibly P- containing silica based materials) are group of bioactive ceramics used as a substitute for the autologous bone. Implanted bioactive glasses dissolve and stimulate both osteoconduction (support bone growth and encourage the ingrowth of surrounding bone) and osteoinduction (capable of promoting the differentiation of progenitor cells down an osteoblastic lineage).1,4,7 Sol–gel derived bioactive glass has advantages over the dense bioactive glass produced by conventional solid melt method, because it possess nanoporosity and larger surface area that courses more rapid dissolution rate and subsequently enhance faster new bone formation.8 However, one of the biggest challenges for utilization of bioactive glasses is its brittleness.6,7
Alternative approach is to use various polymers that offer advantage in terms of possibility to produce materials that possess toughness and plasticity. The most commonly used synthetic polymers are polylactic acid (PLA), poly(glycolic acid) (PGA), polycaprolactone (PCL) and bioinert polymers such as polyurethane (PLU) or polymethylmethacrylate (PMMA).9–13 Acrylic polymer PMMA is commonly used as bone cement or in oral/maxiallofacial surgery.10,14 Although PMMA is regarded as highly biocompatible material, it is also associated with several biological drawbacks. For instance, it is not biodegradable, the surface properties of PMMA are unfavourable for tissue adhesion and the tissues damage around cement surface due to thermal necrosis caused by PMMA polymerization and residual liquid monomer may also occur.15–17
Several PMMA–bioceramic composites have been studied as alternatives to PMMA with objective to improve bioactivity and accelerate bone restoration. For instance, to improve the filler/cement interface the β-tricalcium phosphate (β-TCP) has been encapsulated with poly(ethylene glycol) (PEG) and later incorporated to a poly(methyl methacrylate) bone cement.18 The preparation of nanocomposite composed of hydroxyapatite (HAP) and carbon-nanotube reinforced PMMA has been also reported.19 Furthermore, Chen et al. demonstrated enhanced bioactivity of silicate bioceramic–PMMA composite compare to that of neat PMMA,15 while results obtained by Ravarian et al. showed that PMMA–bioactive glass composite supports osteoblast growth and differentiation.20
Currently, a research trend is to fabricate scaffolds from bioceramic and polymer component with architectures mimicking the three-dimensional interconnected porosity of natural bone and an ability to guide cellular attachment and promote bone growth is one of the critical issues.21 Here we present the synthesis of glass-ceramic (GC) powders and fabrication of GC–PMMA composite via polymerization induced by photoionization process. The composition, morphology and mechanical properties of prepared materials are reported. The growth of ceramic layer on the composite surfaces immersed into simulated body fluid (SBF) under static conditions was also studies and discussed.
2. Experimental
2.1. Sol–gel synthesis of bioglass powders
The starting components for the synthesis of GC were calcium nitrate tetrahydrate (Ca(NO3)2·4H2O, ≥98%, Fluka), sodium nitrate (NaNO3, 99.5%, Chempur), tetraethyl orthosilicate (Si(OC2H5)4, TEOS, 98%, Aldrich) and triethyl phosphate (TEP, PO(C2H5)3, ≥98%, Aldrich). To synthesize GC powders a modified synthesis procedure published elsewhere22 was used. Firstly, 5 mM of citric acid ((C6H8O17), CA, ≥99.5%, Sigma-Aldrich) solution was prepared. To 26 mL of this solution 1 mL of TEP and 11.6 mL of TEOS were added. The mixture was stirred for 1 h at 65–70 °C until clear sol was obtained. In the following step, Ca(NO3)2·4H2O (7.15 g, 0.03 mol) and NaNO3 (4.66 g, 0.05 mol) salts were added and the mixture was further stirred for 60 min at 70 °C until sol turned into clear and transparent gel (the molar ratios of Ca![[thin space (1/6-em)]](https://www.rsc.org/images/entities/char_2009.gif) :
:![[thin space (1/6-em)]](https://www.rsc.org/images/entities/char_2009.gif) P
P![[thin space (1/6-em)]](https://www.rsc.org/images/entities/char_2009.gif) :
:![[thin space (1/6-em)]](https://www.rsc.org/images/entities/char_2009.gif) Na
Na![[thin space (1/6-em)]](https://www.rsc.org/images/entities/char_2009.gif) :
:![[thin space (1/6-em)]](https://www.rsc.org/images/entities/char_2009.gif) Si was 0.4
Si was 0.4![[thin space (1/6-em)]](https://www.rsc.org/images/entities/char_2009.gif) :
:![[thin space (1/6-em)]](https://www.rsc.org/images/entities/char_2009.gif) 0.1
0.1![[thin space (1/6-em)]](https://www.rsc.org/images/entities/char_2009.gif) :
:![[thin space (1/6-em)]](https://www.rsc.org/images/entities/char_2009.gif) 0.6
0.6![[thin space (1/6-em)]](https://www.rsc.org/images/entities/char_2009.gif) :
:![[thin space (1/6-em)]](https://www.rsc.org/images/entities/char_2009.gif) 1). The obtained Si–Ca–Na–P–O precursor gel was then dried in the oven at 100 °C for 24 h and turned into fine powders. The prepared powders were then calcined at 600, 700 and 1000 °C (heating rate 1 °C min−1) for 5 h in air with intermediate grinding in agate mortar. The GC material annealed at 600 °C was further used to prepare GC–PMMA composites.
1). The obtained Si–Ca–Na–P–O precursor gel was then dried in the oven at 100 °C for 24 h and turned into fine powders. The prepared powders were then calcined at 600, 700 and 1000 °C (heating rate 1 °C min−1) for 5 h in air with intermediate grinding in agate mortar. The GC material annealed at 600 °C was further used to prepare GC–PMMA composites.
2.2. Preparation of GC–PMMA composite pellets
The starting components of the GC–PMMA composite were methyl 2-methylprop-2-enoate (methylmethacrylate, MMA, C5H8O2, Evonik-Degussa GmbH) (5.00 g, 0.05 mol), (diphenylphosphinyl)-((2,4,6-trimethylphenyl)methanone) (Genocure TPO (defined as TPO), C22H21O2P, Rahn USA Corp.) (1 g, 0.003 mol) and (2-benzyl-2-(dimethylamino)-4′-morpholinobutyrophenone) (Irgacure 396 (defined as BDMP), C23H30N2O2, BASF Corp.) (1 g, 0.003 mol). Firstly, these components were mechanically mixed in a beaker (the weight ratio of MMA![[thin space (1/6-em)]](https://www.rsc.org/images/entities/char_2009.gif) :
:![[thin space (1/6-em)]](https://www.rsc.org/images/entities/char_2009.gif) TPO
TPO![[thin space (1/6-em)]](https://www.rsc.org/images/entities/char_2009.gif) :
:![[thin space (1/6-em)]](https://www.rsc.org/images/entities/char_2009.gif) BDMP was 71.4
BDMP was 71.4![[thin space (1/6-em)]](https://www.rsc.org/images/entities/char_2009.gif) :
:![[thin space (1/6-em)]](https://www.rsc.org/images/entities/char_2009.gif) 14.3
14.3![[thin space (1/6-em)]](https://www.rsc.org/images/entities/char_2009.gif) :
:![[thin space (1/6-em)]](https://www.rsc.org/images/entities/char_2009.gif) 14.3). Photoiniciators TPO and BDMP were used for the bulk and surface cure, respectively. The GC powders heated at 600 °C were then added to the prepared MMA–TPO–BDMP mixture (the weight ratio of GC
14.3). Photoiniciators TPO and BDMP were used for the bulk and surface cure, respectively. The GC powders heated at 600 °C were then added to the prepared MMA–TPO–BDMP mixture (the weight ratio of GC![[thin space (1/6-em)]](https://www.rsc.org/images/entities/char_2009.gif) :
:![[thin space (1/6-em)]](https://www.rsc.org/images/entities/char_2009.gif) MMA–TPO–BDMP was 75
MMA–TPO–BDMP was 75![[thin space (1/6-em)]](https://www.rsc.org/images/entities/char_2009.gif) :
:![[thin space (1/6-em)]](https://www.rsc.org/images/entities/char_2009.gif) 25) and further mixed until the homogeneous GC–PMMA composite precursor was obtained. In the following step, 0.5 g of composite powders were pressed mechanically to cylindrical-shaped specimens of 8 mm in diameter and 5.1 mm in height (average value reported) using VLP hydraulic press (Enerpac) (10 kN) and left under natural light conditions at room temperature for 5 days to enable photopolymerization of the photoactive compounds.
25) and further mixed until the homogeneous GC–PMMA composite precursor was obtained. In the following step, 0.5 g of composite powders were pressed mechanically to cylindrical-shaped specimens of 8 mm in diameter and 5.1 mm in height (average value reported) using VLP hydraulic press (Enerpac) (10 kN) and left under natural light conditions at room temperature for 5 days to enable photopolymerization of the photoactive compounds.
The pellets of neat PMMA and GC–PMMA composites with fractional GC content of 85, 90 and 95% were additionally fabricated using a procedure described above. It is noteworthy that the preparation of pellets was constricted due to the liquidised form of the MMA–TPO–BDMP–GC mixture at the concentration of MMA–TPO–BDMP mixture above 25%.
2.3. Preparation of a simulated body fluid (SBF) solution and composite dissolution
1 L of the simulated body fluid (SBF) electrolyte solution was prepared by dissolving 7.996 g (0.138 mol) of sodium chloride (NaCl, ≥99%, Aldrich), 0.350 g (0.004 mol) of sodium hydrogen carbonate (NaHCO3, premium, Sigma), 0.224 g (0.003 mol) of potassium chloride (KCl, ≥99.0%, Sigma), 0.228 g (0.001 mol) of potassium phosphate dibasic trihydrate (K2HPO4·3H2O, ≥99.0%, Sigma-Aldrich), 0.305 g (0.001 mol) of magnesium chloride hexahydrate (MgCl2·6H2O, BioXtra ≥ 99.0%, Sigma-Aldrich), 0.244 g (0.002 mol) of calcium chloride (CaCl2, anhydrous, BioReagent, ≥96.0%, Sigma) and 0.071 g (0005 mol) of sodium sulphate (Na2SO4, BioXtra, ≥99.0%, Sigma-Aldrich) into the distilled water. Prepared solution was buffered at pH of 7.25 with 50 mmol L−1 of (6.057 g, 0.05 mol) tris(hydroxymethyl)aminomethane ((CH2OH)3CNH2, ACS Reagent, ≥99.8%, Sigma-Aldrich) and 40 mL of 1 kmol L−1 hydrochloric acid (HCl, ACS, 36.6–38%, Alfa Aesar) solution. The SBF solution (ion concentrations are shown in Table 1) was prepared according to Kokubo et al.23| Ion | Na+ | K+ | Mg2+ | Ca2+ | Cl− | HCO3− | HPO42− | SO42− |
| Concentration, mmol L−1 | 142.0 | 5.0 | 1.5 | 2.2 | 147.8 | 4.2 | 1.0 | 0.5 |
GC(85%)–PMMA(15%), GC(90%)–PMMA(10%) and GC(95%)–PMMA(5%) pellets were soaked in 20 mL of SBF solution and kept in closed fluoroplastic PFA (Roth) tins (placing one sample into each tin) at a starting pH of 7.25 at 37 °C for 1, 2 and 3 weeks.
2.4. Characterization
Thermogravimetric analysis (TG) and differential scanning calorimetry (DSC) of the Si–Ca–Na–P–O gels were performed using Perkin Elmer STA 6000 Simultaneous Thermal Analyzer. Dried samples of ∼5–10 mg were heated from 25 to 900 °C at a heating rate of 10 °C min−1 in a dry flowing air (20 mL min−1).The phase composition of annealed GC powders was studied by X-ray diffraction (XRD, Rigaku, MiniFlex II, Cu-Kα radiation, λ = 0.1542 nm, 40 kV, 100 mA, 2θ = 10–60°) analysis. Identification of crystalline phases was achieved by comparing the experimentally obtained XRD patterns to the database provided by JCPDS (Joint Committee on Powder Diffraction Standards).
Morphological features of the samples and elemental distribution were evaluated using field emission scanning electron microscopy (FE-SEM, SU70, Hitachi) equipped with the energy dispersive X-ray spectrometer (EDS) and using INCA software (Oxford Instruments). The samples were examined using secondary electron (SE) imaging mode. The electron beam acceleration voltage was 5 kV and 20 kV for SEM and EDS analysis, respectively. X-ray accusation time of 60 seconds was used to obtain the EDS spectra (9 spectra were obtained over different regions for each sample).
Infrared spectra of the ceramic glass and composite powder samples were recorded using Fourier transform infrared (FT-IR) spectrometer (Frontier FT-IR), Perkin Elmer, BaF2 plate (ZnSe ATR crystal, liquid-nitrogen-cooled mercury cadmium telluride (MCT) detector), 4000–600 cm−1. FTIR absorbance spectra of the surface of composite pellets before and after the dissolution were recorded in reflectance geometry using Thermo scientific Nicolet iZ10 spectrometer.
The compressive strength tests were performed with a universal testing machine “Haunsfield H10KS” (Hounsfield Test Equipment Ltd, Redhill, UK) and software “Qmat Professional”. The cell load was of 10 kN with a resolution of 0.1 N (load measurement accuracy: ±0.5% of indicated load from 2% to 100% capacity). Load speed was of 20 mm min−1 (position measurement accuracy: 0.001 mm, speed accuracy: ±0.005% of set speed). To calculate density (ρ), the weight, height and diameter of prepared specimens were estimated using precision balance Mettler toledo MS1003S (e = 0.01 g, d = 0.001 g) and DIGI-MET indicator (e = 0.01 mm, d = 0.001 mm) from Helios Preisser.
To eliminate the impact of varying densities of specimens (which forms during its preparation) on compressive strength, the estimated strength σestm, corresponding to mean density of specimens, was calculated according to eqn (1):
 | (1) |
Dissolution of fabricated composite pellets was monitored by measuring the concentrations of Si, Ca and P in soaking solutions. Quantitative determination of the elements was performed using Perkin Elmer Optima 7000 DV inductively coupled plasma optical emission spectrometer (ICP-OES).
3. Results and discussion
3.1. Crystallization and composition evaluation of glass-ceramic powders
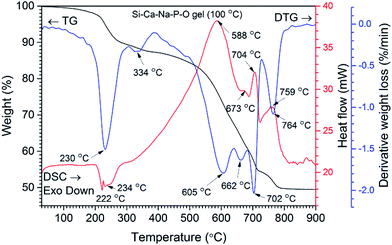
The results of TG and DSC analyses of Si–Ca–Na–P–O gel powders were used to evaluate thermal behaviour of GC. TG/DTG and DSC curves of representative Ca–P–Na–Si–O gel powders are shown in Fig. 1. Six main steps of weight loss are clearly seen in the DTG curve. The first very small weight loss of ∼3% without significant events in the DTG curve was observed by heating the sample up to 200 °C and assigned to the removal of adsorbed water. The second step of weight loss (6%) is observed in the range of 220–270 °C and assigned to the decomposition of precursor gel and evolution of NOx gasses and organic fragments. This is also evident from the exothermic signals in the DSC curve (maxima at 222 °C and 234 °C). The next small weight loss of about 2% observed at 334 °C (DTG curve) was further assigned to the decomposition of organics and evolution of absorbed water. Then, the significant mass loss at around 580–710 °C and simultaneous broad endothermic peak (DSC curve) with three maxima at 605, 662 and 702 °C (DTG curve) takes place. This step is related to the nucleation of primary crystals and crystallization processes of glass ceramic. Similar results were reported by Boccaccini et al. where sintering and crystallization behaviour of bioglass powders was investigated.24One shall note that in thermal treatment of Ca–P–Na–Si–O gel powders more than one crystalline phase may form depending on the temperature.25,26 The last thermal effect with weight loss of ∼5% is observed at 764 °C (DTG curve) followed by endothermic reaction (DSC curve, maxima at 759 °C) and can be further assigned to the increased crystallization of glass-ceramic powders as well as decomposition of nitrate into nitrite27 and evolution of gasses.
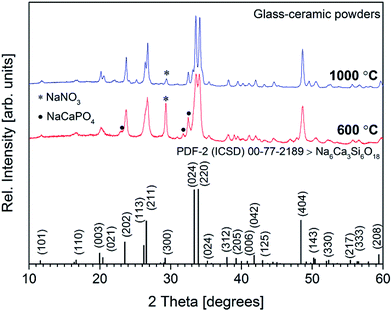
XRD patterns of Ca–P–Na–Si–O gel powders annealed at 600 and 1000 °C are presented in Fig. 2.
Significant reflections in the XRD pattern were observed at 2θ = 11.68°, 16.73°, 20.13°, 23.64°, 26.65°, 33.56°, 34.07°, 35.33°, 38.03°, 39.46°, 41.04°, 41.95°, 43.18°, 48.60°, 50.48°, 52.18°, 55.69°, 56.50° and 59.69° confirming the formation of crystalline solid at around 600 °C. These reflections were assigned to the (101), (110), (033), (202), (211), (024), (220), (024), (312), (205), (006), (042), (125), (404), (143), (330), (217), (333) and (208) diffraction peaks of sodium calcium silicate (Na6Ca3Si6O18) [JCPDS no. 77-2189] phase. The formation of other sodium calcium silicates such as Na2Ca2Si3O9 [JCPDS no. 22-1455] and Na4Ca4Si6O18 [JCPDS no. 79-1089] might also be observed, since different sodium calcium silicates exhibit very similar reference patterns and often consist of a solid solution.22,28,29 The reflections observed at 2θ = 23.12°, 31.04°, 31.75° and 32.50° were assigned to the buchwaldite (NaCaPO4) [JCPDS no. 29-1193] phase, while the intensive reflection at 2θ = 29.37° was assigned to the sodium nitrate (NaNO3 phase [JCPDS no. 36-1474]). Similar results were reported by Pirayesh and Nychka where NaNO3 phase was observed at the temperatures up to 600 °C.30 Further annealing at 700 °C (data not presented) and 1000 °C increased crystallinity, whereas the sharp peak of NaNO3 phase in the XRD pattern slightly diminished. This is probably due to the change of material phase, considering that the nitrates at higher temperatures decompose to the respective nitrites and oxygen (designated NaNO2 [JCPDS no. 83-2254] phase).27
3.2. Morphology evaluation of GC powders and GC–PMMA composites
To see distribution of glass-ceramic within the PMMA matrix the surface morphological examination was performed. The FE-SEM micrographs of GC powders annealed at 600 °C and selected pellets of GC–PMMA (wt ratios of 75/25 and 95/5) composite are presented in Fig. 3.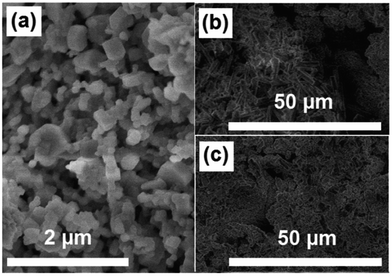 | ||
| Fig. 3 FE-SEM micrographs showing surface morphology of (a) GC powders synthesised at 600 °C, and (b) GC(75%)–PMMA(25%) and (c) GC(95%)–PMMA(5%) composites (FE-SEM micrographs showing larger surface regions of composites are presented in ESI Fig. S1†). | ||
Irregular micro-voids within some areas of composite surface were observed, while samples of neat PMMA appeared to be dense (ESI Fig. S1†). The content and distribution of voids varies within different surface regions examined and increases with an increase of PMMA content. This can be attributed to the inorganic–organic composite preparation procedure and non-uniform distribution of glass ceramic material within polymer matrix. The size of the irregular voids was estimated to be in the range of 20 × 10 ± 5 μm and 1 × 0.5 ± 0.25 μm for the GC(75%)–PMMA(25%) and GC(95%)–PMMA(5%) composites, respectively (FE-SEM micrographs). One might find that the formed voids can lead to some porosity which is one of the most important characteristics for scaffolding materials, since it allow migration and proliferation of osteoblasts and mesenchymal cells, effective vascularisation, bone ingrowth as well as improves mechanical interlocking between artificial implant biomaterial and surrounding natural bone providing mechanical stability at the interface.31
3.3. Spectroscopic characterization of GC–PMMA composites
Fig. 4 shows absorption FTIR spectra of PMMA and GC(75%)–PMMA(25%) composite. FTIR spectrum of neat PMMA in the region of 1700–1100 cm−1 exhibits characteristic bands located at 1722, 1656, 1595, 1436, 1386, 1228, 1192 and 1143 cm−1. Similar absorption spectrum of PMMA was presented by Gonzalez-Benito and Gonzalez-Gaitano.32 FTIR spectrum of GC(75%)–PMMA(25%) composite showed broad and distinctive bands in the region of 1100–850 cm−1. Bands centered at 1018 and 922 cm−1 were assigned to the Si–O–Si vibrational modes of orthosilicate (SiO44−) tetrahedral group, whereas the phosphate vibrations are not very well resolved.33,34 The shoulder at 881 cm−1 and a couple bands in the 600–550 cm−1 region were related to the P–O vibrations which overlap with mixed stretching and bending vibrations of Si–O–Si bond.33,34 In the 1500–1350 cm−1 region broad bands were obtained and assigned to the PMMA matrix overlapping with C–O vibrations of carbonate group. The enlarged FTIR spectra of glass ceramic powders and GC–PMMA composites in the 1900–1100 cm−1 region are presented in Fig. 4 inset. The results clearly point out that with increase of PMMA content the intensity of vibrational modes of PMMA (bands located at 1656, 1595, 1228 and 1192 cm−1) also increases. Furthermore, the intense PMMA band cantered at 1722 cm−1 assigned to the C![[double bond, length as m-dash]](https://www.rsc.org/images/entities/char_e001.gif) O stretching vibrations17,35 disappears in the spectra of GC–PMMA composites.
O stretching vibrations17,35 disappears in the spectra of GC–PMMA composites.
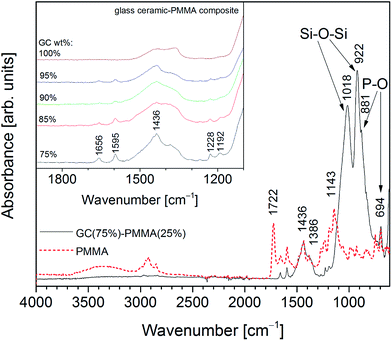 | ||
| Fig. 4 Absorption FTIR spectra of GC(75%)–PMMA(25%) composite and PMMA (inset: absorption FTIR spectra of GC (synthesised at 600 °C) and GC–PMMA composites in the range of 1100–1900 cm−1). | ||
Moreover, to see if spectral features of the composite surface vary from the bulk material the FTIR spectra from the powdered composites (pellets were grinded in an agate mortar) were additionally recorded. Spectral features of the powdered materials are in a good agreement with spectra obtained from the surface of the composite pellets (ESI Fig. S2†).
3.4. Mechanical properties of GC–PMMA composites
The mechanical properties of GC–PMMA composites were investigated by the uniaxial compressive strength test (Fig. 5). In this system, the compressive strength of composites (σi) was in the range of 42–50 MPa (the compressive strength of neat PMMA pellets was measured to be 126 MPa) and decreased with the increase of glass ceramic–polymer ratio. The composites containing 75, 85 and 90% of glass ceramic exhibited very similar compressive strength values. The compressive strength of bioactive glass scaffolds spans from 0.2 to 150 MPa and is composition, microstructure and/or fabrication method dependent,7,36,37 although macroporous bioactive glass scaffolds can display compressive strength values even below 0.2 MPa.38 Material crystallinity also plays an important role in mechanical strength and generally increases when the crystalline phase is increased. For example, Daguano et al. reported that the amount of crystal phase formed in the bioactive glass improves the hardness, fracture toughness, bending strength and elastic modulus of the material depending on the heat treatment temperature.39 Similar results were obtained in the work presented by Sabree et al. showing that ceramic scaffolds made of amorphous material exhibit brittleness compared to those produced of purely crystalline material.40 The compressive or diametral tensile strength of the PMMA can also be altered by incorporating different additives into the bone cement.10,15,41,42 The density (ρ) values (Fig. 5) showed that composites containing 90% and 95% of GC exhibit slightly lower density in comparison to those containing 75% and 85%, while calculated compressive strength at ρ = 1900 kg m−3 shows that the highest value was obtained of composite containing 90% of GC. One can also observe that composite containing 95% of GC decreased in compressive strength by 11.4% and this is attributed mostly to the small amount of supporting PMMA matrix as well as decreased density of material. The results imply that GC(90%)–PMMA(10%) composite yields the highest strength and lowest density compared to all fabricated materials.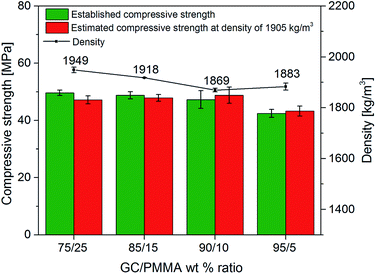 | ||
| Fig. 5 Density of samples, measured compressive strength, and estimated compressive strength at density of 1905 kg m−3 of GC–PMMA composite materials. | ||
3.5. GC–PMMA composite dissolution in SBF solution
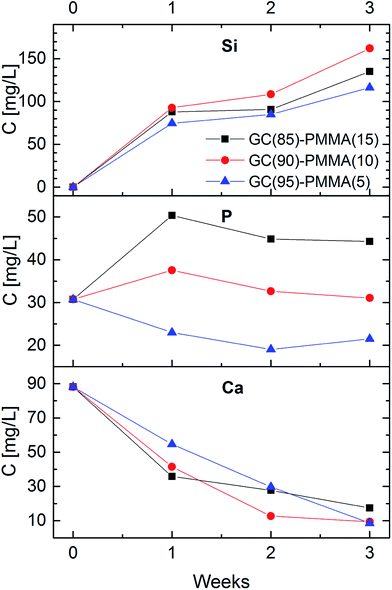
Fig. 6 shows the concentrations of Si, P and Ca in a soaking solutions as a function of dissolution time for GC(85%)–PMMA(15%), GC(90%)–PMMA(10%) and GC(95%)–PMAA(5%) composite materials. The concentration of Si in dissolution medium gradually increased over the immersion time and after 3 weeks reached 115 ppm, 135 ppm and 165 ppm for the GC(95%)–PMAA(5%), GC(85%)–PMMA(15%) and GC(90%)–PMMA(10%) composites, respectively, with most significant alteration obtained after the first week (70–90 ppm). This sudden increase in Si concentration shows and indicates the fast dissolution rate of the glass in the SBF. The highest concentrations of Si were obtained for the GC(90%)–PMMA(10%) material and this could be attributed to the higher porosity of composite and faster surface chemistry. The concentration of Ca in the dissolution medium, on the contrary, falls gradually (it ranges from 90 ppm to 10–20 ppm). However, different variation in the content of phosphorus was obtained. An increase in P concentration was observed first week after the dissolution for the GC(85%)–PMMA(15%) and GC(90%)–PMMA(10%) composites, following with small decrease after the second and third week of dissolution. The concentrations of P for the GC(95%)–PMMA(5%) composite initially decreases and for the last week of dissolution slightly increase. Generally, these processes are due to the dissolution–precipitation reactions that occur at glass ceramic surface in contact with SBF. A rapid ion exchange between glass ceramic surface and dissolution medium induces the formation of hydrated silica-rich layer. Subsequently Ca2+ and HPO42− ions diffuse towards the composite surface and as a result a calcium phosphate ceramic is formed via heterogeneous nucleation. The mechanism and sequence of reactions taking place on the bioactive glass surface when in contact with physiological fluids and involved in the apatite layer formation were reported elsewhere.21,43,44 The dissolution of glass ceramic is important since it relates to the bioactivity. Nevertheless, it is solution parameters, glass composition, sintering temperature and topography dependent.8,443.6. Morphological and structural characterization of GC–PMMA composites after the dissolution in SBF
Fig. 7 depicts FE-SEM micrographs of the different morphological structures formed on the surface of GC–PMMA composite materials soaked in the SBF solution for 1, 2 and 3 weeks. The morphological features differ significantly compared to those obtained from as-prepared samples. These changes again indicate the leaching and diffusion processes of ions towards the composite surface, with subsequent formation of ceramic material on the surfaces of all the samples. Microscopic surface cracking was also observed after samples were soaked in SBF solution (micrographs not presented). Some cracks were slightly less pronounced when samples were soaked for 3 weeks. This indicates the formation of thicker ceramic component layer on the surface.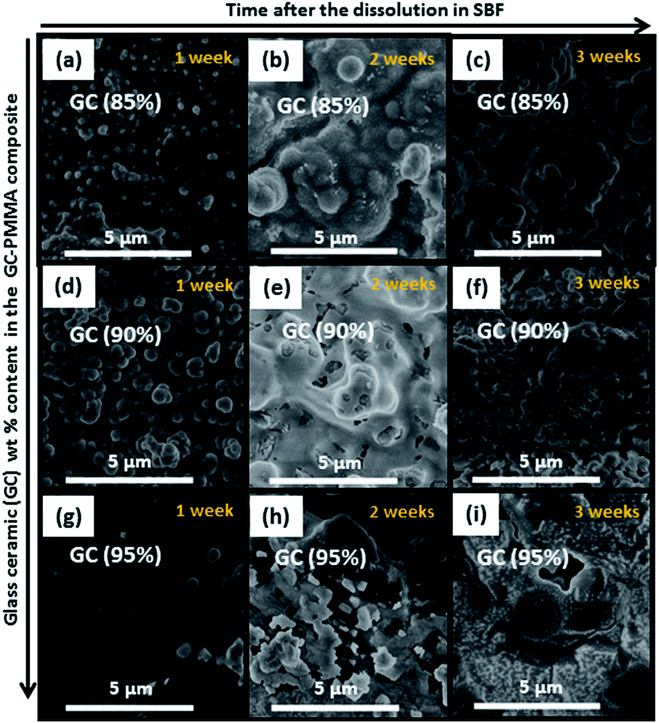 | ||
| Fig. 7 FE-SEM micrographs of the surface of the ((a)–(c)) GC(85%)–PMMA(15%), ((d)–(f)) GC(90%)–PMMA(10%) and ((g)–(i)) GC(95%)–PMMA(5%) composites after 1, 2 and 3 weeks of soaking in SBF. | ||
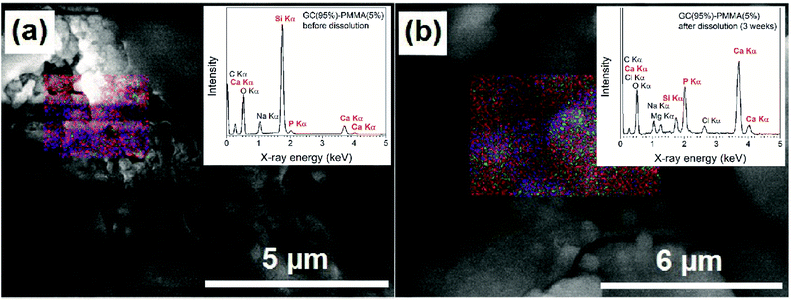
EDS analysis showed the elemental composition of newly formed ceramic material on the composite surface after the dissolution. The representative FE-SEM micrographs with EDS-based elemental mapping and EDS spectra of GC(95%)–PMMA(5%) composite before and three weeks after the dissolution are presented in Fig. 8. Elements such as C, O, Na, Mg, Si, P, Cl and Ca were detected and the average atomic percent (%) ratios of Mg![[thin space (1/6-em)]](https://www.rsc.org/images/entities/char_2009.gif) :
:![[thin space (1/6-em)]](https://www.rsc.org/images/entities/char_2009.gif) Si
Si![[thin space (1/6-em)]](https://www.rsc.org/images/entities/char_2009.gif) :
:![[thin space (1/6-em)]](https://www.rsc.org/images/entities/char_2009.gif) P
P![[thin space (1/6-em)]](https://www.rsc.org/images/entities/char_2009.gif) :
:![[thin space (1/6-em)]](https://www.rsc.org/images/entities/char_2009.gif) Ca were 2.6
Ca were 2.6![[thin space (1/6-em)]](https://www.rsc.org/images/entities/char_2009.gif) :
:![[thin space (1/6-em)]](https://www.rsc.org/images/entities/char_2009.gif) 4.6
4.6![[thin space (1/6-em)]](https://www.rsc.org/images/entities/char_2009.gif) :
:![[thin space (1/6-em)]](https://www.rsc.org/images/entities/char_2009.gif) 11.9
11.9![[thin space (1/6-em)]](https://www.rsc.org/images/entities/char_2009.gif) :
:![[thin space (1/6-em)]](https://www.rsc.org/images/entities/char_2009.gif) 19.6. The ceramic composition was similar to that of the HAP with an average Ca
19.6. The ceramic composition was similar to that of the HAP with an average Ca![[thin space (1/6-em)]](https://www.rsc.org/images/entities/char_2009.gif) :
:![[thin space (1/6-em)]](https://www.rsc.org/images/entities/char_2009.gif) P ratio of 1.65 (n = 9). Nonstoichiometric nature of deposited material generally can be explained by the existence of substitutions and vacancies in the crystal lattice of HAP (stoichiometry for HAP Ca/P is 1.67).45 Furthermore, the presence of different amorphous apatitic phases might also be present. Raynaud et al. demonstrated that HAP with a Ca/P atomic ratio of 1.65 dissociated into a mixture of HAP and β-TCP after heating at 1000 °C.46
P ratio of 1.65 (n = 9). Nonstoichiometric nature of deposited material generally can be explained by the existence of substitutions and vacancies in the crystal lattice of HAP (stoichiometry for HAP Ca/P is 1.67).45 Furthermore, the presence of different amorphous apatitic phases might also be present. Raynaud et al. demonstrated that HAP with a Ca/P atomic ratio of 1.65 dissociated into a mixture of HAP and β-TCP after heating at 1000 °C.46
The surface of GC(95%)–PMMA(5%) composite before dissolution contained C, O, Na, Si, P and Ca and the average atomic% ratios of Si![[thin space (1/6-em)]](https://www.rsc.org/images/entities/char_2009.gif) :
:![[thin space (1/6-em)]](https://www.rsc.org/images/entities/char_2009.gif) P
P![[thin space (1/6-em)]](https://www.rsc.org/images/entities/char_2009.gif) :
:![[thin space (1/6-em)]](https://www.rsc.org/images/entities/char_2009.gif) Ca were 6.3
Ca were 6.3![[thin space (1/6-em)]](https://www.rsc.org/images/entities/char_2009.gif) :
:![[thin space (1/6-em)]](https://www.rsc.org/images/entities/char_2009.gif) 1.0
1.0![[thin space (1/6-em)]](https://www.rsc.org/images/entities/char_2009.gif) :
:![[thin space (1/6-em)]](https://www.rsc.org/images/entities/char_2009.gif) 5.1 (10.95
5.1 (10.95![[thin space (1/6-em)]](https://www.rsc.org/images/entities/char_2009.gif) :
:![[thin space (1/6-em)]](https://www.rsc.org/images/entities/char_2009.gif) 1.2
1.2![[thin space (1/6-em)]](https://www.rsc.org/images/entities/char_2009.gif) :
:![[thin space (1/6-em)]](https://www.rsc.org/images/entities/char_2009.gif) 7.8 and 10.88
7.8 and 10.88![[thin space (1/6-em)]](https://www.rsc.org/images/entities/char_2009.gif) :
:![[thin space (1/6-em)]](https://www.rsc.org/images/entities/char_2009.gif) 8.62
8.62![[thin space (1/6-em)]](https://www.rsc.org/images/entities/char_2009.gif) :
:![[thin space (1/6-em)]](https://www.rsc.org/images/entities/char_2009.gif) 1.09
1.09![[thin space (1/6-em)]](https://www.rsc.org/images/entities/char_2009.gif) :
:![[thin space (1/6-em)]](https://www.rsc.org/images/entities/char_2009.gif) 5.72 for GC(90%)–PMMA(10%) and GC(85%)–PMMA(15%) composites, respectively). Based on these observations, we can conclude that the layer rich in calcium and phosphorus has been deposited on the surface of composite materials. The EDS-based mapping were observed over entire samples and showed homogeneous distribution of the P and Ca elements on the surface of composites after the dissolution.
5.72 for GC(90%)–PMMA(10%) and GC(85%)–PMMA(15%) composites, respectively). Based on these observations, we can conclude that the layer rich in calcium and phosphorus has been deposited on the surface of composite materials. The EDS-based mapping were observed over entire samples and showed homogeneous distribution of the P and Ca elements on the surface of composites after the dissolution.
The presence of newly formed ceramic material on the surface of composites was further examined by XRD analysis and FTIR spectroscopy. XRD patterns of GC(95%)–PMMA(5%) composite before and after the dissolution are presented in Fig. 9. Generally, the poorly crystalline nature of deposited ceramic material is indicated by the broad peaks and low resolution. One can observe that the sharp diffraction peaks of sodium calcium silicate (Na6Ca3Si6O18) [JCPDS no. 77-2189] phase in the XRD pattern are less expressive and broader in comparison to those obtained from composites before dissolution. It should be noted, that intensity of reflections at 2θ ∼ 31.00° and 32.50° increased compare to the main reflections of Na6Ca3Si6O18 phase observed at 2θ = 33–34°. This result indicate the possible formation of poorly crystalline calcium phosphate after the composites were soaked in SBF solution (the main Bragg peaks characteristic of crystalline HAP arise in the region from 31 to 33θ degrees [JCPDS no. 09-0432]47). The rate of cHAP layer deposition was studied by Pereira et al.44 Furthermore, in the XRD pattern of composite materials after the dissolution of three weeks, the sharp reflections at 2θ = 31.68°, 45.42° and 56.50° were obtained and assigned to the NaCl [JCSPD no. 96-900-6375] phase. This result is attributed to the different post-dissolution treatment of the composite samples. It has been reported that to prevent aging of mineralized ceramic, materials are treated in acetone. However, we previously observed (data not reported) that such post-dissolution treatment induces slight demineralization of deposited ceramic and solvent becomes turbid. To assess actual composition and structure of the surface layer the XRD patterns from the as-deposited materials after the dissolution for 3 weeks were recorded. The composites containing 85% and 95% of GC showed similar diffraction patterns (data not presented).
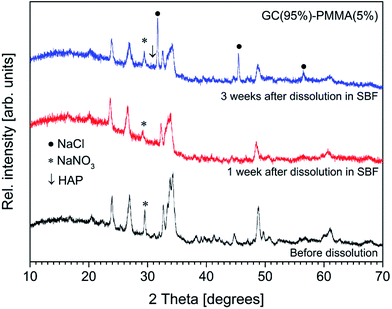 | ||
| Fig. 9 XRD diffractograms of GC(95%)–PMMA(5%) composite surface before and after the dissolution in SBF. | ||
Absorption FTIR spectra recorded from the surface of GC(95%)–PMMA(5%) composite material after the dissolution for 1, 2 and 3 weeks are presented in Fig. 10. FTIR spectra show characteristic bands of the phosphate (PO43−) and carbonate (CO32−) groups and the deposited material was identified as carbonate containing HAP. In the 1100–900 cm−1 region, a broad band with a maximum at 995 cm−1 (shoulder at 936 cm−1) was obtained and assigned to the triply degenerate asymmetric stretching mode, ν3, of the apatitic PO43− groups. It has been previously reported that band obtained at around 600 cm−1 indicates a formation of amorphous calcium phosphate phase, while splitting of this band shows the presence of the crystalline phase.33,34,45,48 The bands observed in the low wavenumber region of 650–600 cm−1 (maxima at 608 cm−1) were attributed to the triply degenerated bending mode, ν4, of the O–P–O bonds.47 An insignificant splitting of this band indicates the deposition of poorly crystalline calcium phosphate – amorphous material as a major phase with a small presence of crystalline phase.8,34 Furthermore, the characteristic bands corresponding to the CO32− group were obtained in the 1600–1350 cm−1 interval.47 This suggests that carbonate group is being incorporated into the deposited ceramic to form cHAP. The peaks appear for substitutions both in phosphate (B-type carbonate) and OH (A-type carbonate) sites: a band located at 1494 cm−1 was assigned to the stretching modes, ν3, while the bands at 1454 cm−1 and 1436 cm−1 to the bending modes, ν4 or ν3, of C–O bond.9,45 In the lower wavenumber region a band arising from the bending mode, ν2, of C–O bond (CO32− group) was observed at ∼865 cm−1 and assigned to the A-type substitution, while broad band ∼700 cm−1 was designated to the in-plane band, ν4, CO32− group. In another work by Pereira et al. the formation of cHAP on the surface of sol–gel derived bioglass surfaces in vitro has been demonstrated.34
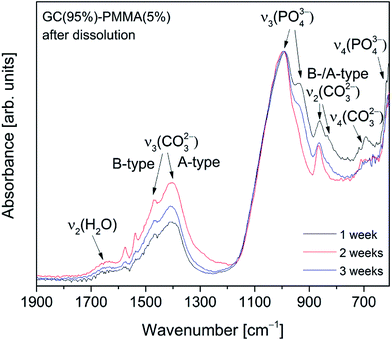 | ||
| Fig. 10 Absorption FTIR spectra recoded from the surface of GC(95%)–PMMA(5%) composites 1, 2 and 3 weeks after the dissolution in SBF. | ||
It is known that HAP is thermodynamically the most stable phase in physiological conditions and has the ability for direct chemical bonding to the bone. However, previous studies have shown that mechanism of bone apatite formation involves metastable intermediate products including an amorphous calcium phosphate.49 This indicates the favourable transformation of deposited low crystallinity calcium phosphate into the crystalline hydroxyapatite. GC(90%)–PMMA(10%) and GC(85%)–PMMA(15%) composites exhibited very similar spectral features showing the formation of A- and B-substituted carbonated apatite under identical experimental conditions (ESI Fig. S3†).
Although we can conclude that in the current work the inorganic–organic composites were successfully prepared and the growth of low crystallinity carbonated HAP on the surface of composites immersed into SBF under static conditions was obtained, the studies examining the effect of the observed surface morphology on cell behaviour in vitro and in vivo still has to be performed and will be a subject of further studies.
4. Conclusions
In this work glass-ceramic powders were synthesised via sol–gel method at 600 °C. XRD analysis showed that during sintering the crystallization takes place and sodium calcium silicate (Na6Ca3Si6O18) was observed as a main phase. Homogeneous GC–PMMA composites with fractional GC content ranging from 75 to 95% were successfully prepared via photopolymerization reaction. The mechanical compressive strength of GC–PMMA composite materials ranged from 42.5 to 49.6 MPa. The GC(90%)–PMMA(10%) composites exhibited the highest strength and lowest density. ICP-OES results indicated the degradation process of the glass ceramic in simulated body fluid. A combination of XRD and SEM/EDS analyses revealed that the alteration products are mostly amorphous material with the composition similar to that of the HAP (average atomic% ratio of Ca/P = 1.65). According to FTIR analysis the ceramic layer formed after the dissolution was low crystallinity calcium phosphate with crystalline phase attributed to carbonate A- and B-substituted HAP. The findings indicate that fabricated composites could be potential materials for bone scaffold engineering when extreme strength is not required.Acknowledgements
This research was funded by a grant KALFOS (No. LJB-2/2015) from the Research Council of Lithuania.References
- M. M. Stevens, Mater. Today, 2008, 11, 18–25 CrossRef CAS.
- P. V. Giannoudis, H. Dinopoulos and E. Tsiridis, Injury, 2005, 36, S20–S27 CrossRef PubMed.
- Global Data, MediPoint: Bone Grafts and Substitutes – Global Analysis and Market Forecast, Executive Summary, 2014, January, Retrieved from: https://www.marketresearch.com/, Reference code: GDME0192MAR.
- J. R. Jones, E. Gentleman and J. Polak, Elements, 2007, 3, 393–399 CrossRef CAS.
- K. Jahan and M. Tabrizian, Biomater. Sci., 2016, 4, 25–39 RSC.
- J. J. Li, D. L. Kaplan and H. Zreiqat, J. Mater. Chem. B, 2014, 2, 7272–7306 RSC.
- Q. Fu, E. Saiz, M. N. Rahaman and A. P. Tomsia, Mater. Sci. Eng., C, 2011, 31, 1245–1256 CrossRef CAS PubMed.
- P. Sepulveda, J. R. Jones and L. L. Hench, J. Biomed. Mater. Res., 2002, 61, 301–311 CrossRef CAS PubMed.
- E. Garskaite, L. Alinauskas, M. Drienovsky, J. Krajcovic, R. Cicka, M. Palcut, L. Jonusauskas, M. Malinauskas, Z. Stankeviciute and A. Kareiva, RSC Adv., 2016, 6, 72733–72743 RSC.
- M. Arora, E. K. S. Chan, S. Gupta and A. D. Diwan, World J. Orthoped., 2013, 4, 67–74 CrossRef PubMed.
- J. M. Moran, D. Pazzano and L. J. Bonassar, Tissue Eng., 2004, 9, 63–70 CrossRef PubMed.
- D. M. Yunos, Z. Ahmad and A. R. Boccaccini, J. Chem. Technol. Biotechnol., 2010, 85, 768–774 CrossRef CAS.
- Z. Li, G. Lang, X. Chen, H. Sacks, C. Mantzur, U. Tropp, K. T. Mader, T. C. Smallwood, C. Sammon, R. G. Richards, M. Alini and S. Grad, Biomaterials, 2016, 84, 196–209 CrossRef CAS PubMed.
- G. Lewis, J. Biomed. Mater. Res., 1997, 38, 155–182 CrossRef CAS PubMed.
- L. Chen, D. Zhai, Z. Huan, N. Ma, H. Zhu, C. Wu and J. Chang, RSC Adv., 2015, 5, 37314–37322 RSC.
- G. Lewis, J. Biomed. Mater. Res., Part B, 2006, 76, 456–468 CrossRef PubMed.
- A. K. Riau, D. Mondal, G. H. F. Yam, M. Setiawan, B. Liedberg, S. S. Venkatraman and J. S. Mehta, ACS Appl. Mater. Interfaces, 2015, 7, 21690–21702 CAS.
- B. Vázquez, M. P. Ginebra, X. Gil, J. A. Planell and J. San Román, Biomaterials, 2005, 26, 4309–4316 CrossRef PubMed.
- M. K. Singh, T. Shokuhfar, J. J. d. A. Gracio, A. C. M. de Sousa, J. M. D. F. Fereira, H. Garmestani and S. Ahzi, Adv. Funct. Mater., 2008, 18, 694–700 CrossRef CAS.
- R. Ravarian, C. M. Murphy, A. Schindeler, A. Rawal, J. M. Hook and F. Dehghani, RSC Adv., 2015, 5, 60681–60690 RSC.
- A. J. Salinas and M. Vallet-Regi, RSC Adv., 2013, 3, 11116–11131 RSC.
- J. Faure, R. Drevet, A. Lemelle, N. Ben Jaber, A. Tara, H. El Btaouri and H. Benhayoune, Mater. Sci. Eng., C, 2015, 47, 407–412 CrossRef CAS PubMed.
- T. Kokubo and H. Takadama, Biomaterials, 2006, 27, 2907–2915 CrossRef CAS PubMed.
- A. R. Boccaccini, Q. Chen, L. Lefebvre, L. Gremillard and J. Chevalier, Faraday Discuss., 2007, 136, 27–44 RSC.
- J. Massera, S. Fagerlund, L. Hupa and M. Hupa, J. Am. Ceram. Soc., 2012, 95, 607–613 CrossRef CAS.
- R. Golovchak, P. Thapar, A. Ingram, D. Savytskii and H. Jain, Acta Biomater., 2014, 10, 4878–4886 CrossRef CAS PubMed.
- C. M. Kramer, Z. A. Munir and J. V. Volponi, Thermochim. Acta, 1982, 55, 11–17 CrossRef CAS.
- R. L. Siqueira, O. Peitl and E. D. Zanotto, Mater. Sci. Eng., C, 2011, 31, 983–991 CrossRef CAS.
- I. Cacciotti, M. Lombardi, A. Bianco, A. Ravaglioli and L. Montanaro, J. Mater. Sci.: Mater. Med., 2012, 23, 1849–1866 CrossRef CAS PubMed.
- H. Pirayesh and J. A. Nychka, J. Am. Ceram. Soc., 2013, 96, 1643–1650 CrossRef CAS.
- G. Hannink and J. J. C. Arts, Injury, 2011, 42, S22–S25 CrossRef PubMed.
- J. González-Benito and G. González-Gaitano, Macromolecules, 2008, 41, 4777–4785 CrossRef.
- A. J. Salinas, M. Vallet-Regi and I. Izquierdo-Barba, J. Sol-Gel Sci. Technol., 2001, 21, 13–25 CrossRef CAS.
- M. M. Pereira, A. E. Clark and L. L. Hench, J. Biomed. Mater. Res., 1994, 28, 693–698 CrossRef CAS PubMed.
- T. Serizawa, K.-i. Hamada, T. Kitayama, N. Fujimoto, K. Hatada and M. Akashi, J. Am. Chem. Soc., 2000, 122, 1891–1899 CrossRef CAS.
- B. Thavornyutikarn, P. Tesavibul, K. Sitthiseripratip, N. Chatarapanich, B. Feltis, P. F. A. Wright and T. W. Turney, Mater. Sci. Eng., C, 2017, 75, 1281–1288 CrossRef CAS PubMed.
- X. Wang, L. Zhang, X. Ke, J. Wang, G. Yang, X. Yang, D. He, H. Shao, Y. He, J. Fu, S. Xu and Z. Gou, RSC Adv., 2015, 5, 102727–102735 RSC.
- Y. Minaberry and M. Jobbágy, Chem. Mater., 2011, 23, 2327–2332 CrossRef CAS.
- J. K. M. F. Daguano, K. Strecker, E. C. Ziemath, S. O. Rogero, M. H. V. Fernandes and C. Santos, J. Mech. Behav. Biomed. Mater., 2012, 14, 78–88 CrossRef CAS PubMed.
- I. Sabree, J. E. Gough and B. Derby, Ceram. Int., 2015, 41, 8425–8432 CrossRef CAS.
- S. Shinzato, T. Nakamura, T. Kokubo and Y. Kitamura, J. Biomed. Mater. Res., 2001, 54, 491–500 CrossRef CAS PubMed.
- G. Lewis, J. Biomed. Mater. Res., Part B, 2008, 84, 301–319 CrossRef PubMed.
- L. L. Hench, J. Am. Ceram. Soc., 1991, 74, 1487–1510 CrossRef CAS.
- M. M. Pereira, A. E. Clark and L. L. Hench, J. Am. Ceram. Soc., 1995, 78, 2463–2468 CrossRef CAS.
- W. Querido, L. G. Abraçado, A. L. Rossi, A. P. C. Campos, A. M. Rossi, R. A. S. San Gil, R. Borojevic, A. Balduino and M. Farina, Calcif. Tissue Int., 2011, 89, 358 CrossRef CAS PubMed.
- S. Raynaud, E. Champion, D. Bernache-Assollant and P. Thomas, Biomaterials, 2002, 23, 1065–1072 CrossRef CAS PubMed.
- E. Garskaite, K.-A. Gross, S.-W. Yang, T. C.-K. Yang, J.-C. Yang and A. Kareiva, CrystEngComm, 2014, 16, 3950–3959 RSC.
- S. Radin, P. Ducheyne, B. Rothman and A. Conti, J. Biomed. Mater. Res., 1997, 37, 363–375 CrossRef CAS PubMed.
- M. Vallet-Regi and D. A. Navarette, Biological Apatites in Bone and Teeth, in Nanoceramics in Clinical Use: From Materials to Applications, 2nd edn, 2015, ch. 1, pp. 1–29 Search PubMed.
Footnote |
| † Electronic supplementary information (ESI) available: Values of diameter, height, mass and compressive strength for GC–PMMA composites, FE-SEM micrographs showing the surface of the pellets: (a) neat PMMA, ((b) and (c)) GC(75%)–PMMA(25%) composites, and (d) GC(95%)–PMMA(5%) composite, FTIR spectra of GC (annealed at 600 °C) and grinded GC–PMMA composite pellets, and absorption FTIR spectra recoded from the surface of GC(85%)–PMMA(15%) composite pellets 1, 2 and 3 weeks after the dissolution in SBF. See DOI: 10.1039/c7ra05188c |
| This journal is © The Royal Society of Chemistry 2017 |

