 Open Access Article
Enhanced visible-light photocatalytic performance of highly-dispersed Pt/g-C3N4 nanocomposites by one-step solvothermal treatment
Zhao Lua,
Wulin Song *ab,
Chao Ouyanga,
Hao Wanga,
Dawen Zeng
 a and
Changsheng Xiea
aState Key Laboratory of Materials Processing, Die & Mould Technology, Huazhong University of Science and Technology, 1037 Luoyu Road, Wuhan 430074, PR China
bAnalytical and Testing Center of Huazhong University of Science and Technology, Wuhan 430074, PR China
First published on 3rd July 2017
Abstract
A highly dispersed Pt/g-C3N4 nanocomposite photocatalyst was successfully prepared by depositing platinum nanoparticles (NPs) onto the surface of g-C3N4 with uniform size. The nanocomposites were applied as an efficient visible-light-driven photocatalyst for the degradation of methyl orange (MO) and tetracycline hydrochloride (TC). The sample with a Pt loading amount of 2% exhibited the highest photocatalytic performance, about 7.82 (MO) and 4.30 (TC) times higher than that of the pure g-C3N4. The enhancement of the photocatalytic performance was attributed to the rapid separation of generated electron hole pairs resulting from the hybrid effect, which was confirmed by XPS spectra, photocurrent response experiment, electrochemical impedance spectroscopy measurements and photoluminescence spectra. As confirmed by X-ray photoelectron spectroscopy, there is a strong interaction between Pt NPs and g-C3N4; the delocalized pi bond in g-C3N4 with a high local electron density donates lone pair electrons to the empty d orbitals of Pt atoms. The combination between g-C3N4 and Pt promotes the separation of electron–hole pairs.
Introduction
Photocatalysis is expected to be a green technology for environmental remediation due to its effective utilization of solar energy. Several semiconductor photocatalysts have been widely studied, including TiO2, ZnO, BiOX (Cl, Br, I), CdS and so on.1–5 Recently, another promising 2D layered polymeric semiconductor, g-C3N4, has also gained comprehensive attention as a visible-light-driven photocatalyst.6–8 Nevertheless, the photocatalytic performance of pure g-C3N4 is limited because of its weak absorption of visible light and charge recombination. Hence various approaches have been applied to modify its electronic structure and enhance its photocatalytic properties. For example, Han et al. prepared an atomically thin mesoporous nanomesh of graphitic carbon nitride to modify its structure.9 Li et al. synthesized oxygen–g-C3N4 to induce intrinsic electronic and band structure modulation.10 Jiang et al. constructed a p–n heterojunction photocatalyst by coupling nanostructured BiOI on the porous graphite-like C3N4, and the photocatalyst exhibited superior photocatalytic activity towards the degradation of MB which was attributed to the fast separation of electron–hole pairs.11 Meanwhile, based on this mechanism, Jiang et al. also synthesized perovskite oxide ultrathin nanosheets/g-C3N4 2D-2D heterojunction photocatalysts, and the photocatalyst had excellent photocatalytic performance in the degradation of TC.12 Zhu et al. prepared Ag/Fe3O4/g-C3N4 heterojunction photocatalyst to change the electron–hole separation processes.13Particularly, combining g-C3N4 with different noble metals such as Ag, Au, Pd and Pt to form composites has been considered a feasible route. Li et al. constructed Ag/graphene-like g-C3N4 photocatalyst, and the composites displayed enhanced photocatalytic activity.14 Olga Fontelles-Carceller et al. synthesized Ag/g-C3N4 composites and the catalysts exhibited enhanced photocatalysis performance towards toluene degradation.15 F. Fina et al. reported that Pt–g-C3N4 with particles characterized by a high crystallinity results in a high H2 evolution.16 Xue et al. prepared Au/Pt/g-C3N4 and the composites showed enhanced photocatalytic activity for antibiotic degradation.17 However, the interaction between noble metals and g-C3N4 was rarely concerned. As a matter of fact, the charge transfer is mainly finished through effective interfacial combination.18–20
Here, we presented a 0D–2D heterojunction photocatalyst by in situ growth of Pt NPs on g-C3N4 sheets with varied ratio. Meanwhile, the 2Pt/g-C3N4 exhibited a dramatically improved photocatalytic activity towards the degradation of MO and TC under visible light irradiation. Also, the possible mechanism was discussed and mainly attributed to the hybrid effect, there is a strong interaction between Pt NPs and g-C3N4, confirmed by XPS, the interaction between Pt NPs and g-C3N4 promotes efficient transfer of e− and high separation of electron–hole pairs.
Experimental
Preparation of catalysts
g-C3N4 was synthesized by thermal polycondensation of urea. Typically, 10 g of urea was put into a ceramic crucible with a cover, heated at 550 °C for 4 h at a rising rate at 15 °C min−1 in a muffle furnace. After cooling to room temperature naturally, the resulting pale yellow products were collected and ground into powders. Pt/g-C3N4 was prepared through a simple water bath method. 0.2 g g-C3N4 was dispersed into 25 mL ethylene glycol (EG), then a certain amount of H2PtCl6·6H2O and a solution of NaOH in EG were added to the g-C3N4 solution. Finally, a brown suspension was obtained by heating the mixed solution at 90 °C for 1 h under N2 atmosphere. After cooling to room temperature naturally, the resulting product was centrifuged and washed with absolute ethanol and distilled water, followed by drying in a vacuum oven at 80 °C overnight. By varying the dosage of H2PtCl6·6H2O, a series of Pt/g-C3N4 nanocomposites were synthesized, labelled as xPt/g-C3N4, where x is the wt% (0.5, 1, 2 and 4) of Pt with respect to g-C3N4.Characterization of catalysts
X-ray diffraction (XRD, X'Pert PRO diffractometer with Cu Kα radiation), high-resolution transmission electron microscopy (HRTEM, FEI Tecnai G2 F30 field-emission TEM), Fourier transform infrared (FT-IR) spectra were recorded from a KBr disk on the FT-IR Bruker Tensor27. X-ray photoelectron spectroscopy (XPS, VG Multilab2000 spectrometer) measurements were performed. UV-vis diffuse reflectance spectra (UV-vis DRS) was recorded at Shimadzu U-3010 spectrometer using BaSO4 as a reference. The specific surface area and the pore size distribution were determined from N2 adsorption–desorption isotherms at 77 K, obtained by a BRLSORP analyzer. The specific surface area was calculated from multipoint adsorption data within the linear segment of the N2 adsorption isotherms, using Brunauer–Emmett–Teller theory. The pore size distribution was determined from the isotherms by using nonlocal density functional theory. Photoluminescence (PL) spectra was obtained on a Jasco FP-6500 with a laser excitation of 325 nm.The photocurrent and electrochemical impedance spectroscopy measurements (EIS) were carried out on a Shanghai Chenhua CHI-660D electrochemical system by using a conventional three-electrode cell. The counter and the reference electrodes were platinum wire and saturated calomel electrode (SCE), respectively. The electrolyte solution was 0.1 M Na2SO4. The as-prepared photocatalyst powders were fixed to the film electrodes by the following method: firstly, 10 mg catalyst sample was mixed with 1 mL distilled water homogeneously (10 mg mL−1). Then, the solution was spin-coated onto an ITO glass electrode. At last, the electrode was dried naturally for 12 h and then dried at 120 °C for 5 h.
Performance evolution of catalysts
The photocatalytic activities were evaluated by the degradation of MO (20 mg L−1, 50 mL) and TC (20 mg L−1, 100 mL) under visible light irradiation (λ > 400 nm), respectively. A 300 W Xe lamp (CEL-HXF300) with a 400 nm UV cut-off filter was applied light source, and a liquid trap system was used to keep the temperature steady. Generally, 50 mg catalyst was dispersed in the target solution. Prior to irradiation, the reaction suspensions were under vigorous stirring for 30 min to reach an absorption–desorption equilibrium. 5 mL solution was taken and centrifuged at every 5 minute intervals, and supernatant fluid was extracted immediately. The concentration was analysed by UV/vis spectroscopy. The degradation rate was calculated by C/C0, where C was the concentration after irradiation, C0 was the concentration of the reactant after adsorption–desorption equilibrium. A blank control test without photocatalyst was conducted for reference.Results and discussion
XRD patterns
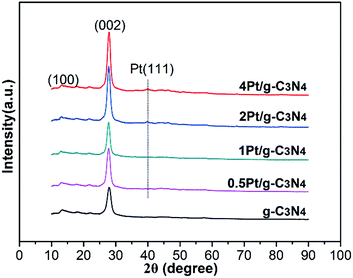
Fig. 1 shows the phase structures of the as-prepared samples. Two distinct diffraction peaks can be observed in the XRD patterns. The weak diffraction peak at 13.1° (100) and another strong diffraction peak at 27.5° (002) can be attributed to the in-plane structure of tri-s-triazine units and the graphitic layer stacking, severally.21 After coupling with Pt NPs, there is no change in the peak positions of g-C3N4, indicating that Pt NPs are not incorporated into the lattice of g-C3N4. The characteristic peak at 39.7° (111) can be identified as Pt NPs in the 2Pt/g-C3N4 and 4Pt/g-C3N4.22 Due to the low loading amount of Pt in 0.5Pt/g-C3N4 and 1Pt/g-C3N4, the peak is not distinct.Morphologies
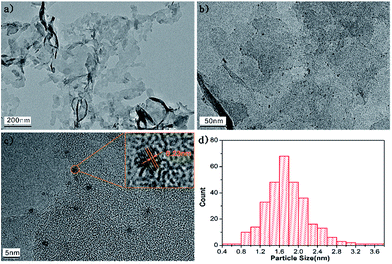
Fig. 2 displays the microstructures of g-C3N4 and 2Pt/g-C3N4. Fig. 2a is the TEM image of the pure g-C3N4, showing a layered structure with smooth surface. For the 2Pt/g-C3N4, the small-sized Pt NPs are evenly distributed on the surface of g-C3N4 as shown in Fig. 2b. HRTEM image shows clear lattice fringes of Pt NPs in Fig. 2c, and the lattice of 0.23 nm corresponds to the (111) planes of the Pt NPs, which is in accordance with the XRD result. Fig. 2d shows the Pt particle size distribution, demonstrating the particle size is rather uniform and the average size is 1.6 nm. Thus it can be seen that Pt NPs are well dispersed on the g-C3N4 successfully.FT-IR spectroscopy analysis
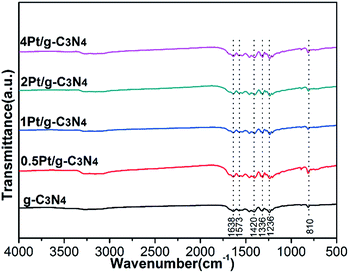
Fig. 3 shows the local structures of all samples. For the pure g-C3N4, there are three characteristic bands: the absorption band at 1638 cm−1 is attributed to C–N stretching vibration; the strong band at 1200–1600 cm−1 is associated with the typical aromatic C–N stretching vibration; the band near 810 cm−1 is related to characteristic bending vibration of tri-s-triazine ring units.23–25 For all Pt/g-C3N4 samples, the FTIR spectra are similar to that of pure g-C3N4, indicating that the structure of g-C3N4 has no change. The results accord well with the result of XRD.X-ray photoelectron spectroscopy
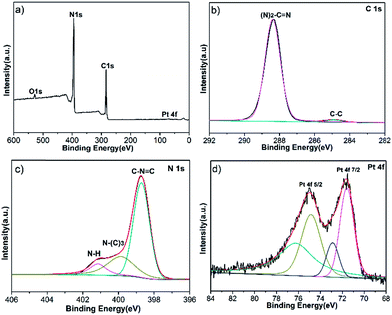
To study the chemical composition and interaction between Pt NPs and g-C3N4, XPS analysis was utilized, as shown in Fig. 4a. Fig. 4b shows the C 1s high resolution spectra, the peak at 288.4 eV can be distinguished for g-C3N4, which is assigned to sp2-hybridized carbon in the unit of (N)2–C![[double bond, length as m-dash]](https://www.rsc.org/images/entities/char_e001.gif) N. The peak shifts to a more positive position compared with pure g-C3N4 which is at 288.1 eV.7 Meanwhile, the high resolution XPS spectra of N 1s region is shown in Fig. 4c, the binding energy of C
N. The peak shifts to a more positive position compared with pure g-C3N4 which is at 288.1 eV.7 Meanwhile, the high resolution XPS spectra of N 1s region is shown in Fig. 4c, the binding energy of C![[double bond, length as m-dash]](https://www.rsc.org/images/entities/char_e001.gif) N–C bond (398.6 eV), N–(C)3 (399.8 eV) and N–H (401.1 eV) all also increase in contrast with the pure g-C3N4.7 Because the delocalized pi bond of g-C3N4 possesses high electron density, providing lone pairs electrons to d orbitals of Pt, leading to the decrease of electron density of g-C3N4. For the Pt 4f XPS spectra in Fig. 4d, two main peaks at 74.4 (Pt 4f5/2) and 70.9 eV (Pt 4f7/2) are indexed as metallic Pt0. Comparing with the standard Pt 4f7/2 binding energy of Pt0 (71.2 eV), the Pt 4f7/2 peak shifts to a more negative position, since the increase of electron density of Pt.26 And another two weak peaks at 75.9 and 72.3 eV are assigned to Pt2+ chemical state, stemming from incomplete reduction of Pt4+.27 Thus g-C3N4 coupling with Pt NPs promotes the separation of electron–hole pairs.
N–C bond (398.6 eV), N–(C)3 (399.8 eV) and N–H (401.1 eV) all also increase in contrast with the pure g-C3N4.7 Because the delocalized pi bond of g-C3N4 possesses high electron density, providing lone pairs electrons to d orbitals of Pt, leading to the decrease of electron density of g-C3N4. For the Pt 4f XPS spectra in Fig. 4d, two main peaks at 74.4 (Pt 4f5/2) and 70.9 eV (Pt 4f7/2) are indexed as metallic Pt0. Comparing with the standard Pt 4f7/2 binding energy of Pt0 (71.2 eV), the Pt 4f7/2 peak shifts to a more negative position, since the increase of electron density of Pt.26 And another two weak peaks at 75.9 and 72.3 eV are assigned to Pt2+ chemical state, stemming from incomplete reduction of Pt4+.27 Thus g-C3N4 coupling with Pt NPs promotes the separation of electron–hole pairs.
UV-vis diffuse reflection spectra
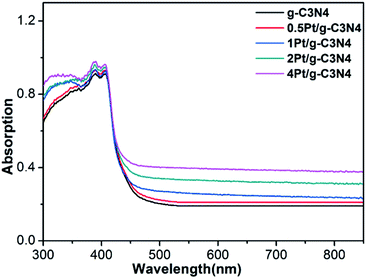
Fig. 5 shows the UV-vis diffuse reflectance absorption spectra of all samples. Pure g-C3N4 exhibits an absorption edge at about 450 nm. After coupling with Pt NPs, the absorption edge has no change, indicating that introduction of Pt NPs does not affect the band structure. Moreover, background absorption in the visible light region enhances with increasing Pt content due to localized surface plasmon resonance.28 This result indicates that the Pt is only supported on the surface of g-C3N4 and not incorporated into the lattice of g-C3N4, which is consistent with the XRD and XPS results.BET surface areas and pore structure
The BET surface areas and the pore size distributions of all samples are also measured, as shown in Fig. 6 and Table 1. The specific surface area of the pure g-C3N4 is 93.5 m2 g−1. After coupling with Pt NPs, the specific surface area of Pt/g-C3N4 increases, and the specific surface area increased slowing with the increasing amount of Pt NPs, which is owning to the infinitesimal particle size of Pt NPs. Moreover, according to the Barret–Joyner–Halenda (BJH) pore size distributions of all samples, all of them own the similar small mesoporous at 2.8 nm, indicating that the microstructures have no change after coupling with Pt NPs.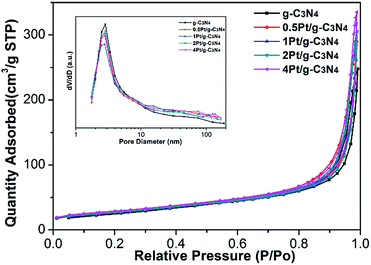 | ||
| Fig. 6 N2 adsorption–desorption isotherms of all samples, and the corresponding normalized pore-size distribution (inset). | ||
| Sample name | SBET (m2 g−1) | Peak pore size (nm) |
|---|---|---|
| g-C3N4 | 93.5 | 2.8 |
| 0.5Pt/g-C3N4 | 94.4 | 2.8 |
| 1Pt/g-C3N4 | 94.8 | 2.8 |
| 2Pt/g-C3N4 | 96.9 | 2.8 |
| 4Pt/g-C3N4 | 100.7 | 2.8 |
PL measurements
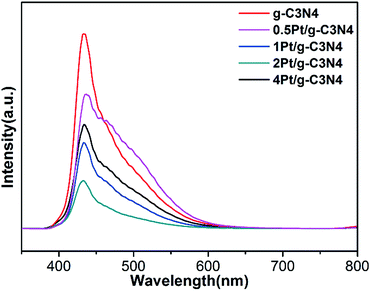
Fig. 7 shows the PL spectra of all samples. The PL emission intensity of the pure g-C3N4 sample is highest, indicating that the recombination of electron–hole pairs is the most serious. Obviously, after coupling with Pt NPs, the PL intensity steps down, indicating the promotion in the electron–hole pairs separation. However, the PL intensity of 4Pt/g-C3N4 increases compared with 2Pt/g-C3N4, since the overloaded Pt NPs become recombination center.28 So the content of Pt plays a significant influence on the activity.Photoelectrochemical measurements
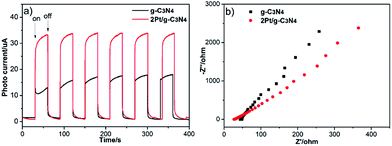
To further investigate the excitation and transfer of photogenerated charge carriers of 2Pt/g-C3N4, the photocurrent response (J–t) experiments and EIS Nyquist analysis were performed via several on–off cycles under visible light irradiation. The photocurrent is shown in Fig. 8a; it is obvious that the photocurrent of g-C3N4 display good reproducibility and stability under several on–off cycles of intermittent irradiation. Furthermore, the transient photocurrent density of 2Pt/g-C3N4 is obviously higher than that of g-C3N4 severally, indicating that the Schottky junctions formed between Pt NPs and g-C3N4 and coupling with Pt NPs could significantly improve the separation efficiency of photogenerated charge carriers. EIS Nyquist analysis is shown in Fig. 8b, the radius of each arc is related to the charge transfer process at the electrode/electrolyte interface, the smaller the radius of each arc, the better the separation of electron–hole pairs.29,30 So 2Pt/g-C3N4 has a more effective separation of photogenerated electron–hole pairs and faster interfacial electron transfer. The result also indicates that coupling with Pt NPs is benefit to electron transfer, which agrees well with the result of the transient photocurrent responses.Photocatalytic activity
Fig. 9a displays the photocatalytic properties of all samples based on the degradation of MO under visible light irradiation, the results indicate that all Pt/g-C3N4 samples exhibit better catalytic activity than g-C3N4. When the mass ratio of Pt/g-C3N4 is 2 (2Pt/g-C3N4), the photocatalytic activity is best and the MO is degraded nearly completely after 40 min reaction, whereas only 40.2% of MO could be decomposed for the pure g-C3N4. The photocatalysis degradation follows the first-order kinetics. The kinetics could be expressed as follows: −ln(C/C0) = kappt. Fig. 9b presents the linear relationship between ln(C/C0) and time, where C/C0 is the normalized as MO concentration, t is the reaction time, and k is the reaction rate constant. The corresponded apparent pseudo-first-order rate constant kapp of 2Pt/g-C3N4 was 0.09282 min−1, which is about 7.82 times higher than that of g-C3N4.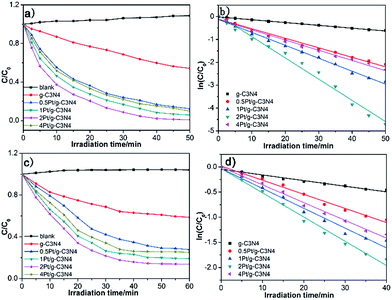 | ||
| Fig. 9 Photodegradation rate of MO (a) and TC (c) under visible light irradiation; corresponding kinetic curves of MO (b) and TC (d) for all samples. | ||
TC is chosen as another different type of model pollutant to evaluate the photocatalytic activity as shown in Fig. 9c. The results indicate that the 2Pt/g-C3N4 exhibits excellent photocatalytic activity for the photodegradation of TC and TC removal reaches about 84.1% after 40 min reaction, but g-C3N4 exhibits a poorer photocatalytic activity and the photodegradation rate of MO only reaches about 39.9%. Fig. 9d presents the linear relationship between ln(C/C0) and time toward the degradation of TC. The photocatalytic decomposition rate of 2Pt/g-C3N4 is 0.04819 min−1, which is about 4.30 times of over g-C3N4.
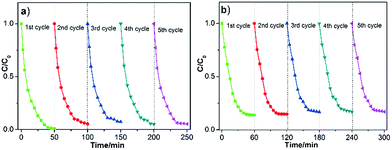
Besides the photocatalytic performance, the stability of a catalyst is also one key point for its practical applications, so the recycling experiments were conducted on the 2Pt/g-C3N4 sample under same conditions. According to the results shown in Fig. 10, whether for photodegradation of MO or TC, the sample still exhibits superior activity after five cycles, suggesting the excellent stability of the 2Pt/g-C3N4 sample during the photocatalytic reaction.
Mechanism discussion
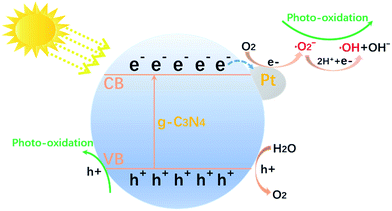
Compared to the pure g-C3N4, the photocatalytic performance of all Pt/g-C3N4 were improved. Based on the above analysis, when the Pt/g-C3N4 nanocomposites is irradiated by visible light, electrons of g-C3N4 are excited from the valence band to the conduction band, leaving holes in the valence band. This moment Pt NPs act as electron acceptors, the excited electrons transfer from valence band of g-C3N4 to Pt NPs. So decoration with Pt NPs could promote the separation of electron–hole pairs. This separation process is shown in Fig. 11. However, the reaction rate constant firstly increased and then decreased with the Pt mass rising. With the content of Pt increasing from 0 to 2 wt%, the contact area of g-C3N4 and Pt NPs increased, leading to the promotion in efficient transfer of e− and separation of electron–hole pairs. Nevertheless, the overmuch amount of Pt NPs would result in an increase in the Schottky barrier height and an enhanced rate of electron–hole recombination.31,32Conclusions
In conclusion, we have prepared highly dispersed Pt/g-C3N4 composites through a reduction process in the EG solvent. These hybrids exhibit significantly enhanced photocatalytic activities towards the degradation of MO and TC compared to pure g-C3N4. This is attributed to the faster separation of photogenerated electron–hole pairs. The content of Pt displays a significant influence on the activities, the content of Pt from 0 to 2 wt%, the activities improve because Pt NPs act as electron acceptor and promote the separation of electron–hole pairs. However, the content of Pt increases continuously, the activities decrease, since Pt becomes the recombination centre of electron–hole pairs. This indicates that the nanocomposites material with highly efficient visible photocatalytic activities has been provided.Acknowledgements
This work was financially supported by the National Basic Research Program of China (Grant No. 2009CB939705). The authors are also grateful to the Analytic and Testing Centre of Huazhong University of Science and Technology.References
- X. Chen, L. Liu, P. Y. Yu and S. S. Mao, Science, 2011, 331, 746–750 CrossRef CAS PubMed.
- J. Wang, Z. Wang, B. Huang, Y. Ma, Y. Liu, X. Qin, X. Zhang and Y. Dai, ACS Appl. Mater. Interfaces, 2012, 4, 4024–4030 CAS.
- J. Jiang, K. Zhao, X. Xiao and L. Zhang, J. Am. Chem. Soc., 2012, 134, 4473–4476 CrossRef CAS PubMed.
- D. Zhang, J. Li, Q. Wang and Q. Wu, J. Mater. Chem. A, 2013, 1, 8622 CAS.
- Q. Li, B. Guo, J. Yu, J. Ran, B. Zhang, H. Yan and J. R. Gong, J. Am. Chem. Soc., 2011, 133, 10878–10884 CrossRef CAS PubMed.
- H. Wang, X. Zhang, J. Xie, J. Zhang, P. Ma, B. Pan and Y. Xie, Nanoscale, 2015, 7, 5152–5156 RSC.
- Z. Lu, L. Zeng, W. Song, Z. Qin, D. Zeng and C. Xie, Appl. Catal., B, 2017, 202, 489–499 CrossRef CAS.
- H. Zhao, H. Yu, X. Quan, S. Chen, H. Zhao and H. Wang, RSC Adv., 2014, 4, 624–628 RSC.
- Q. Han, B. Wang, J. Gao, Z. Cheng, Y. Zhao, Z. Zhang and L. Qu, ACS Nano, 2016, 10, 2745–2751 CrossRef CAS PubMed.
- J. Li, B. Shen, Z. Hong, B. Lin, B. Gao and Y. Chen, Chem. Commun., 2012, 48, 12017–12019 RSC.
- D. Jiang, L. Chen, J. Zhu, M. Chen, W. Shi and J. Xie, Dalton Trans., 2013, 42, 15726–15734 RSC.
- D. Jiang, T. Wang, Q. Xu, D. Li, S. Meng and M. Chen, Appl. Catal., B, 2017, 201, 617–628 CrossRef CAS.
- Z. Zhu, Z. Lu, D. Wang, X. Tang, Y. Yan, W. Shi, Y. Wang, N. Gao, X. Yao and H. Dong, Appl. Catal., B, 2016, 118, 115–122 CrossRef.
- H. Li, Y. Jing, X. Ma, T. Liu, L. Yang, B. Liu, S. Yin, Y. Wei and Y. Wang, RSC Adv., 2017, 7, 8688–8693 RSC.
- O. Fontelles-Carceller, M. J. Munoz-Batista, M. Fernandez-Garcia and A. Kubacka, ACS Appl. Mater. Interfaceser, 2016, 8, 2617–2627 CrossRef CAS PubMed.
- F. Fina, H. Menard and J. T. Irvine, Phys. Chem. Chem. Phys., 2015, 17, 13929–13936 RSC.
- J. Xue, S. Ma, Y. Zhou, Z. Zhang and M. He, ACS Appl. Mater. Interfaces, 2015, 7, 9630–9637 CAS.
- Q. Huang, S. Tian, D. Zeng, X. Wang, W. Song, Y. Li, W. Xiao and C. Xie, ACS Catal., 2013, 3, 1477–1485 CrossRef CAS.
- Z. Zhang, J. Huang, M. Zhang, Q. Yuan and B. Dong, Appl. Catal., B, 2015, 298–305, DOI:10.1016/j.apcatb.2014.08.013.
- D. Jiang, J. Li, C. Xing, Z. Zhang, S. Meng and M. Chen, ACS Appl. Mater. Interfaces, 2015, 7, 19234–19242 CAS.
- Q. Lin, L. Li, S. Liang, M. Liu, J. Bi and L. Wu, Appl. Catal., B, 2015, 163, 135–142 CrossRef CAS.
- B. Y. Xia, B. Wang, H. B. Wu, Z. Liu, X. Wang and X. W. Lou, J. Mater. Chem., 2012, 22, 16499 RSC.
- J. Di, J. Xia, S. Yin, H. Xu, M. He, H. Li, L. Xu and Y. Jiang, RSC Adv., 2013, 3, 19624 RSC.
- Y. Bai, P.-Q. Wang, J.-Y. Liu and X.-J. Liu, RSC Adv., 2014, 4, 19456 RSC.
- Y. He, L. Zhang, X. Wang, Y. Wu, H. Lin, L. Zhao, W. Weng, H. Wan and M. Fan, RSC Adv., 2014, 4, 13610 RSC.
- S. Cao, J. Jiang, B. Zhu and J. Yu, Phys. Chem. Chem. Phys., 2016, 18, 19457–19463 RSC.
- J. Yu, K. Wang, W. Xiao and B. Cheng, Phys. Chem. Chem. Phys., 2014, 16, 11492–11501 RSC.
- W. J. Ong, L. L. Tan, S. P. Chai and S. T. Yong, Dalton Trans., 2015, 44, 1249–1257 RSC.
- C. Ye, J.-X. Li, Z.-J. Li, X.-B. Li, X.-B. Fan, L.-P. Zhang, B. Chen, C.-H. Tung and L.-Z. Wu, ACS Catal., 2015, 5, 6973–6979 CrossRef CAS.
- Q. Xu, C. Jiang, B. Cheng and J. Yu, Dalton Trans., 2017 10.1039/c7dt00629b.
- S. Ma, S. Zhan, Y. Jia, Q. Shi and Q. Zhou, Appl. Catal., B, 2016, 186, 77–87 CrossRef CAS.
- K. Li, Z. Zeng, L. Yan, S. Luo, X. Luo, M. Huo and Y. Guo, Appl. Catal., B, 2015, 165, 428–437 CrossRef CAS.
| This journal is © The Royal Society of Chemistry 2017 |

