
 Open Access Article
 This Open Access Article is licensed under a Creative Commons Attribution-Non Commercial 3.0 Unported Licence
The complete utilization of rice husk for production of synthesis gas
Zhiyu Li,
Enchen Jiang*,
Xiwei Xu *,
Yan Sun and
Zhanxin Wu
*,
Yan Sun and
Zhanxin Wu
College of Materials and Energy, South China Agricultural University, Guangzhou 510640, China. E-mail: jiangenchen200801@hotmail.com; xuxiwei200801@hotmail.com
First published on 3rd July 2017
Abstract
Rice husk was completely used for synthesis gas production. The pyrolysis volatiles (gas and bio-oil) of rice husk were used as raw materials to produce synthesis gas and the bio-char from the rice husk pyrolysis was used as the catalyst for catalytic reforming of pyrolysis volatiles of rice husk. We investigated the role of catalysts in gas and bio-oil catalytic reformation under different reaction conditions and the interaction between gas and bio-oil. The results indicated that 0.1Ni–0.1Co/RHPC (rice husk pyrolysis carbon) exhibited favorable selectivity and high conversion for rice husk pyrolysis volatiles. In particular, H2 and CO contents from bio-oil were 56% and 18%, respectively, 37% and 36% from gas, respectively. Moreover, the content of H2 is 32%, while that of CO is 22% after catalytic reforming from the mixture of gas and bio-oil. The Co–Ni/RHPC catalysts were characterized by X-ray diffraction, FT-IR, NH3-TPD, H2-TPR and N2 adsorption and desorption. BET results showed that adding Co and Ni can effectively enhance the BET surface from 4 m2 g−1 to 96 m2 g−1. XRD results showed the active parts of the Ni and Co diffraction peaks remained evident after reaction.
1. Introduction
Recently, fossil fuels have become a limited resource, and CO2 emission has caused global warming and severe changes in climate.1,2 Considerable research has been focused on new or alternative sustainable fuels and energy sources to reduce fossil fuel dependency and CO2 emissions. Biomass energy is estimated to be between 50 and 1100 EJ per year in 2050,3–6 while the total global energy consumption is estimated to be between 600 and 1000 EJ per year in the same year.7 On the basis of these numbers, biomass appears to be capable of providing some of the energy in the future and thus can prevent fossil resource depletion.7 In the past few years, biomass had become an attractive renewable source that plays a major role in renewable energy production.8In China, the yield of rice husk reached 56![[thin space (1/6-em)]](https://www.rsc.org/images/entities/char_2009.gif) 516.50 × 10⁴ t in 2016. As usually, a part of rice husk was used as the poultry fee. However, most of rice husk was threw away as waste materials, which was harmful for environmental.
516.50 × 10⁴ t in 2016. As usually, a part of rice husk was used as the poultry fee. However, most of rice husk was threw away as waste materials, which was harmful for environmental.
The high value utilization of rice husk is an urgent and promising in China. As a kind of clean energy, hydrogen production has attracted substantial attention in the 21st century. For many years, fossil fuel had played an important role in traditional hydrogen-producing processes.9 However, the depletion of the world's fossil fuel reserves, continual price increase, and serious environmental problems diverted more attention and focus to hydrogen production from renewable energy sources. Renewable energy sources are clean and will not exhausted with reasonable utilization. Furthermore, hydrogen production from renewable sources, such as biomass, can remarkably reduce SO2 and NOx emissions and satisfy the demand for CO2-neutral energy supply.10 Catalytic steam reforming (SR) is one of the economically feasible method for hydrogen production. Through this method, hydrogen and synthesis gas can be produced in an environmentally friendly and sustainable way. Biomass can be converted thermally, which leads to the production of liquids (bio-oil) and some gases and solids (char).11–16 Bio-oil consists of different oxygenated compounds, such as acids, ketones, alcohols, phenols, and guaiacols,17,18 which cannot be directly used as fuel or chemicals.
The SR of bio-oil is considered CO2 neutral and is therefore a sustainable alternative to hydrogen or synthesis gas. Transition (Ni and Co) and noble metals (Rh, Pt, Ir, and Ru) have both been extensively examined as active sites for ethanol SR, and various oxides (Al2O3, MgO, CaO, ZrO2, CeO2, SiO2, La2O3, and TiO2) are utilized as supports.19,20 Meanwhile, numerous studies have shown that these supports also play critical roles in the catalytic performance of SR. The acidic sites and surface structures can be modified by using La, Ce, and Zr metals and enhance carbon deposition tolerant abilities to improve the stability and activity of the catalysts. Wang et al. discussed critically rational control of nano-scale metal-catalysts for biomass conversion. They found that metal catalysts at the nanoscale were better to promote biomass conversion, such as hydrogenolysis, hydrogenation, oxidation and so on.21 Ni/nano-Al2O3 catalysts display excellent performance in terms of activity and stability. The hydrogen yields for three typical bio-oil model compounds, namely, phenol, acetic acid, and hydroxyacetone, are 69%, 87%, and 97.2%, respectively.22 Moreover, Roh et al.23 investigated Rh-based catalysts anchored on several supports, such as Al2O3, MgAlO4, CeO2–ZrO2, and Rh/CeO2–ZrO2, and they discovered that these catalysts had the highest H2 yield. Zhang et al. investigated a series of NiM (M = Ru, Rh, and Pd) bimetallic catalysts for effective lignin hydrogenolysis in water. The results indicated Ni85Ru15 catalyst showed high activity under low temperature and pressure.24 Konnerth et al. obtained monomeric aromatic compounds from lignin over Ni7Au3 catalyst.25 De et al. investigated Ni had the highest ability to form bimetallic systems with other metals, which were effective in breaking C–H and C–C bonds.26
In the paper, we produced H2 by catalytic reforming of pyrolysis volatiles from rice husk with rice husk pyrolysis carbon as catalysts. The rice husk was completely used and the catalytic activity of catalyst (rice husk pyrolysis carbon) was analyzed.
2. Experiment
2.1. Preparation of catalysts
Rice husk pyrolysis carbon (RHPC) was selected as the catalyst carrier. RHPC was acquired through the biomass continuous pyrolysis system (Fig. 1). The screw conveyer is made of mild steel, which length and diameter were 1000 mm and 26 mm, respectively. Rice husk was continuously transported to the pyrolysis reactor from the hopper by the screw feeder. The feeding rate was controlled by the rotary speed of the screw. The rice husk feeding rate was 390–410 g h−1. The temperature in the pyrolysis reactor was set at 500 °C for 8 min then preserved in a drying vessel.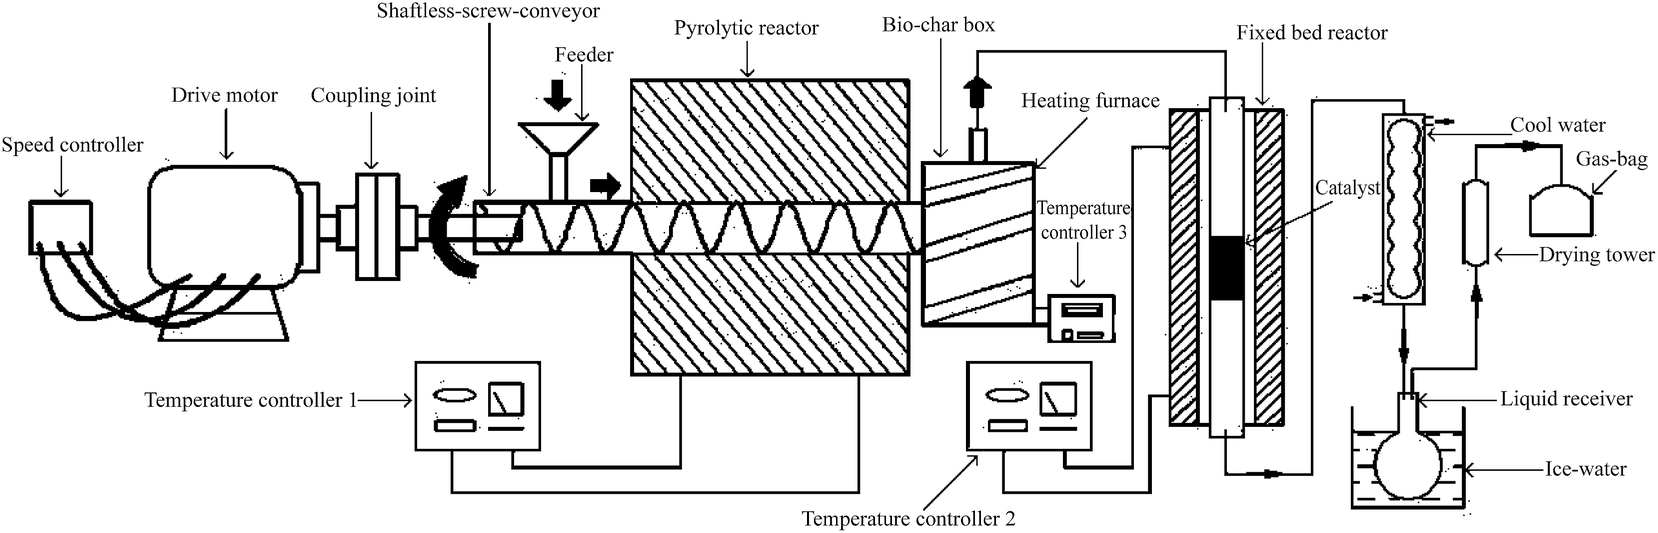 | ||
| Fig. 1 Biomass continuous pyrolysis system. | ||
RHPC was impregnated in cobalt nitrate nonahydrate and nickel nitrate nonahydrate (Sigma) solution in deionized water. The mixture was dried at 70 °C for 24 h. The dried mixture was calcined at 500 °C for 3 h. The amount of cobalt or nickel was controlled at 20 wt%, 20 wt% for 0.2Co/RHPC and 0.2Ni/RHPC, respectively. And both the content of Ni and Co is 10 wt% for 0.1Ni–0.1Co/RHPC based on the mass of support.
2.2. Characterization of catalysts
Specific surface areas and pore volumes were determined through N2 adsorption/desorption isotherms at 77 K and collected by a Gemini VII 2390 gas-adsorption analyzer.Chembet Pulsar TPR/TPD was used to analyze temperature-programmed ammonia desorption (NH3-TPD). Each sample was heated at 300 °C for 2 h and then cooled down to 50 °C. The samples (0.1 g) were then saturated with dried ammonia by replacing the N2-flow with NH3 for 2 h and treated with 50 ml min−1 N2 flow for 1 h to remove remaining NH3. The temperature was slowly heated up to 800 °C at a rate of 10 °C min−1, and ammonia was flushed out with 50 ml min−1 N2.
The crystallographic phases of the samples were confirmed by XRD measurements (D8 VENTURE Bruker, CuKα radiation). The powder patterns were collected in the range from 5° to 80° 2θ with a step of 0.02° and 30 s counting time per angle.
2.3. Catalytic reforming (CR) experiment and analysis
Rice husk pyrolysis volatiles consisted of complex components that were divided into condensable, that is bio-oil (mainly including acids, phenols, ketones, and alcohols) and incondensable parts, that is gas (mainly including H2, CO, CO2, CH4, C2H4, and C2H6). Their reforming reactions were also relatively complicated. In the paper, we chosen the model bio-oil (alcohol:acetone:acetic acid:guaiacol:water = 1:1:3:1.5:3.5) and gas (H2:CO:CO2:CH4:C2H4:C2H6 = 4:37.8:15.8:38.6:1.9:1.9) as the raw material to take the CR experiment.
Catalytic tests of bio-oil was conducted in a fixed bed with quartz tube reactor. Bio-oil was continuously transported to quartz tube reactor from pipeline by the peristaltic pump. And the rate of feedstock was set as 0.29 g min−1 by adjusting the peristaltic pump. And the gas was 100 ml min−1. The diameter and length of the quartz tube reactor were 3 cm and 100 cm, respectively. And the thickness was 0.3 cm. Catalyst was placed in the catalyst bed in quartz tube reactor installed in the middle of the pyrolysis furnace, which was supported by insulation spacer. And about 2.5 g catalyst was used in every text. The catalyst bed temperature was monitored by the central thermocouple in the catalytic cracking furnace. The bio-oil was heated by the furnace and was gasified before they contacted with the catalysts. The experiments were carried out at 500 °C, 600 °C, 700 °C and 800 °C. The temperature controller was adjusted to set the reaction temperature.
Before the catalytic tests, all the catalysts were reduced in H2/N2 (10/90, vol%) mixture with heating rate at 24 °C min−1 to 700 °C and held at 700 °C for 2 h. The flow rate of carrier gas (N2) was set at 100 ml min−1. The gas gained by catalytic cracking was collected in gas bags. Then, it was analyzed separately by GC. GC analysis was performed in a Agilent 6820 gas chromatograph (for H2, CO, CH4, CO2, C2H4 and C2H6) with a thermal conductivity detector (TCD) with N2 carrier gas and HP-PLOT-Q column (30 m length, 30 °C). The TCD temperature was 250 °C and the separation was done at the ratio of 1:10.
(1) The concentration of gas is calculated according to the equal:

The calculated equal is similar with SCH4, SCO2, SCO, SC2H4, SCO, SC2H6
(2) Weight hourly space velocity (WHSV)

Catalytic tests of gas was conducted in the same reactor. And the bio-oil was replaced by gas.
The real experiment of rice husk catalytic reforming was conducted on a fixed-bed reactor and proceeded (in Fig. 1) as follows: first, the catalysts were fixed in the middle of the tube, and N2 was used to replace the air in the reaction system under normal pressure. Subsequently, the catalysts was reduced through gas of H2/N2 (10/90) at 700 °C. After reduction for 2 h, the rice husk was pumped into the reactor using an auger. And the real volatiles will go through the catalyst and take the catalytic reforming reaction.
3. Results and discussion
3.1. Catalyst characterization
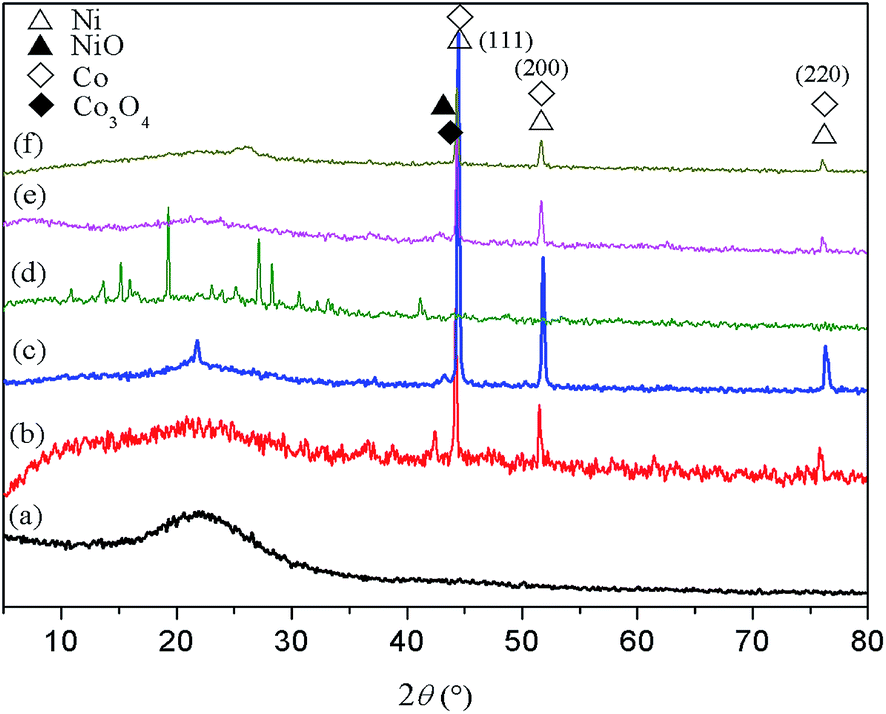 | ||
| Fig. 2 XRD patterns of different catalysts. (a) Fresh RHPC (b) reduced Co/RHPC, (c) reduced Ni/RHPC, (d) fresh Co–Ni/RHPC, (e) reduced Co/Ni/RHPC, and (f) Co/Ni/RHPC after reaction. | ||
The Co3O4 in the reduced Co/RHPC had a diffraction peak at 44.8°, and the NiO of the reduced Ni/RHPC had a diffraction peak at 46.6°. The peak of fresh Co–Ni/RHPC diffraction slightly shifted from 44.8° to 44.6°, whereas their peak widths increased. Unlike those of the fresh catalyst, the crystal structure of Co–Ni/RHPC catalyst basically remained stable after the reaction. It indicated that the overall phase structure of the former during the reaction process was stable. The catalyst activity during the reforming reaction process remained stable. Moreover, Ni and Co diffraction peaks appeared in the XRD patterns of catalyst after reaction. It is possible that the catalyst reaction performance was relatively stable. And the Ni and Co structures during the reaction process might correspond to the active sites of the catalysts and thus might facilitate reforming reaction.
![[double bond, length as m-dash]](https://www.rsc.org/images/entities/char_e001.gif) O in the carboxylic acid and lactone groups. The adsorption peak near 1590 cm−1 could belong to the stretching vibration peak adsorption of the CC. The C–H bending vibration peak occurred at 1383 cm−1. The peak at 1096 cm−1 possibly belonged to the C–O stretching vibration in CH2–O–CH2. The C–H out-of-plane bending vibration was observed at 1383 cm−1.30,31
O in the carboxylic acid and lactone groups. The adsorption peak near 1590 cm−1 could belong to the stretching vibration peak adsorption of the CC. The C–H bending vibration peak occurred at 1383 cm−1. The peak at 1096 cm−1 possibly belonged to the C–O stretching vibration in CH2–O–CH2. The C–H out-of-plane bending vibration was observed at 1383 cm−1.30,31
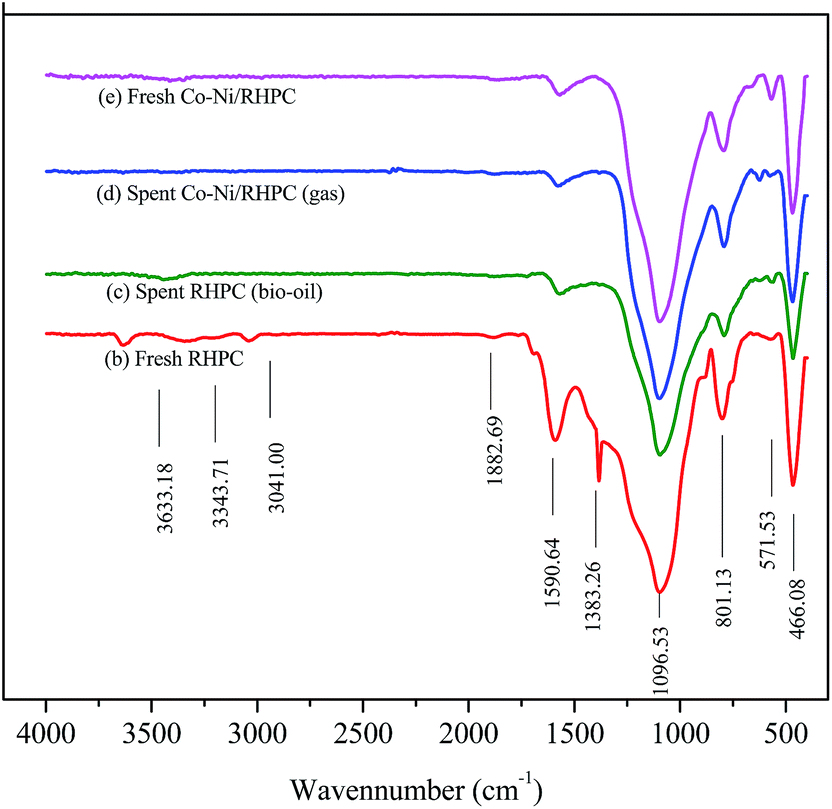 | ||
| Fig. 3 Infrared spectroscopic analysis of different catalysts. | ||
Compared with fresh bio-char (b) support, the stretching vibration peak around 1383 cm−1 disappeared and the intensity of stretching vibration at 1096, 1590 cm−1 weakened for the fresh Co–Ni/RHPC. It induced that the metal Ni or Co promoted the conversion of organic material left in the RHPC. Compared the spent catalysts Co–Ni/RHPC (c and d) with the fresh one (a), we found the stretching vibration peaks were nearly the same. It indicated that the catalyst was stable during the process of CR of gas and bio-oil.
| Catalyst | BET/m2 g−1 | Pore volume/m3 g−1 | Pore size/nm |
|---|---|---|---|
| RHC | 4.28 | 0.01 | 25.93 |
| Ni/RHC | 49.90 | 0.12 | 13.21 |
| Co/RHC | 54.57 | 0.08 | 9.47 |
| Co–Ni/RHC | 96.01 | 0.11 | 6.00 |
As displayed in Table 1, the pore volume of the catalyst increased from 0.01 m3 g−1 to 0.11 m3 g−1, indicating that the active components promoted the conversion of micropores to mesopores while the components filled the large pores. Moreover, the pore diameter of the bio-char carrier decreased from 25.93 nm to 6.00 nm, as shown in Table 1. It is possible that the metal Ni and Co goes into the pore of carrier, thereby reducing the pore diameter of the pore structures. The specific surface area of Co–Ni/RHPC increased to 96.01 m2 g−1, thus demonstrating that the metal Ni and Co promotes the conversion of organic material in bio-char and forms new structure. This finding indicate that Ni and Co could promote the rebuilding of rice husk bio-char structure.
 | ||
| Fig. 4 NH3-TPD pattern of Co–Ni/RHPC. | ||
 | ||
| Fig. 5 H2-TPR pattern of Co–Ni/RHPC. | ||
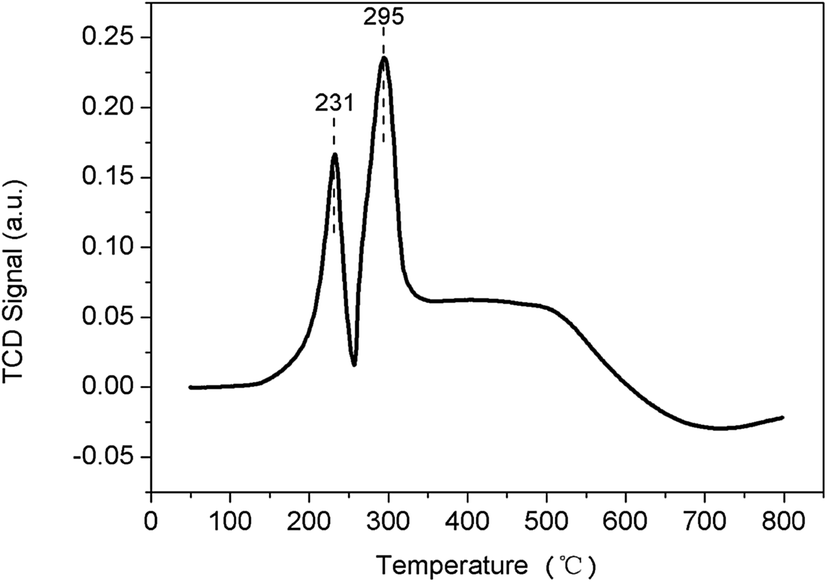
Fig. 5 presents the H2-TPR results of the Co–Ni/RHPC catalyst. There are two relatively narrow H2 reduction peak. It is possible that all the Ni2+ had a direct contact to the carrier and were uniformly and collectively distributed on the carrier surface as the Ni content is high. Therefore, the TPR pattern presented the relatively narrow reduction peak.32 The catalyst had two reduction peaks appearing at 231 and 295 °C, respectively. The former possibly belonged to the reduction peak of the free-state NiO, while the latter possibly belonged to the reduction peak of the dispersed-state NiO. The dispersed-state NiO was caused by the increased load capacity, which prevented the interaction between the Ni and the carrier. Therefore, a part of Ni adsorbed on the carrier in a microcrystal form. As a result, Ni had weak interactions with the carrier, which caused the decrease of reduction temperature. Moreover, the increase of load capacity increased, made the weak interactions obvious.32 Co loading had an influence on Ni reduction capability, which promoted the shift of the reduction peak of NiO toward the low-temperature zone. Therefore, compared with the single metallic oxide, bi-metallic oxide could significantly influence the reduction capability of the catalyst. It is demonstrated that Co addition was conducive for NiO reduction.
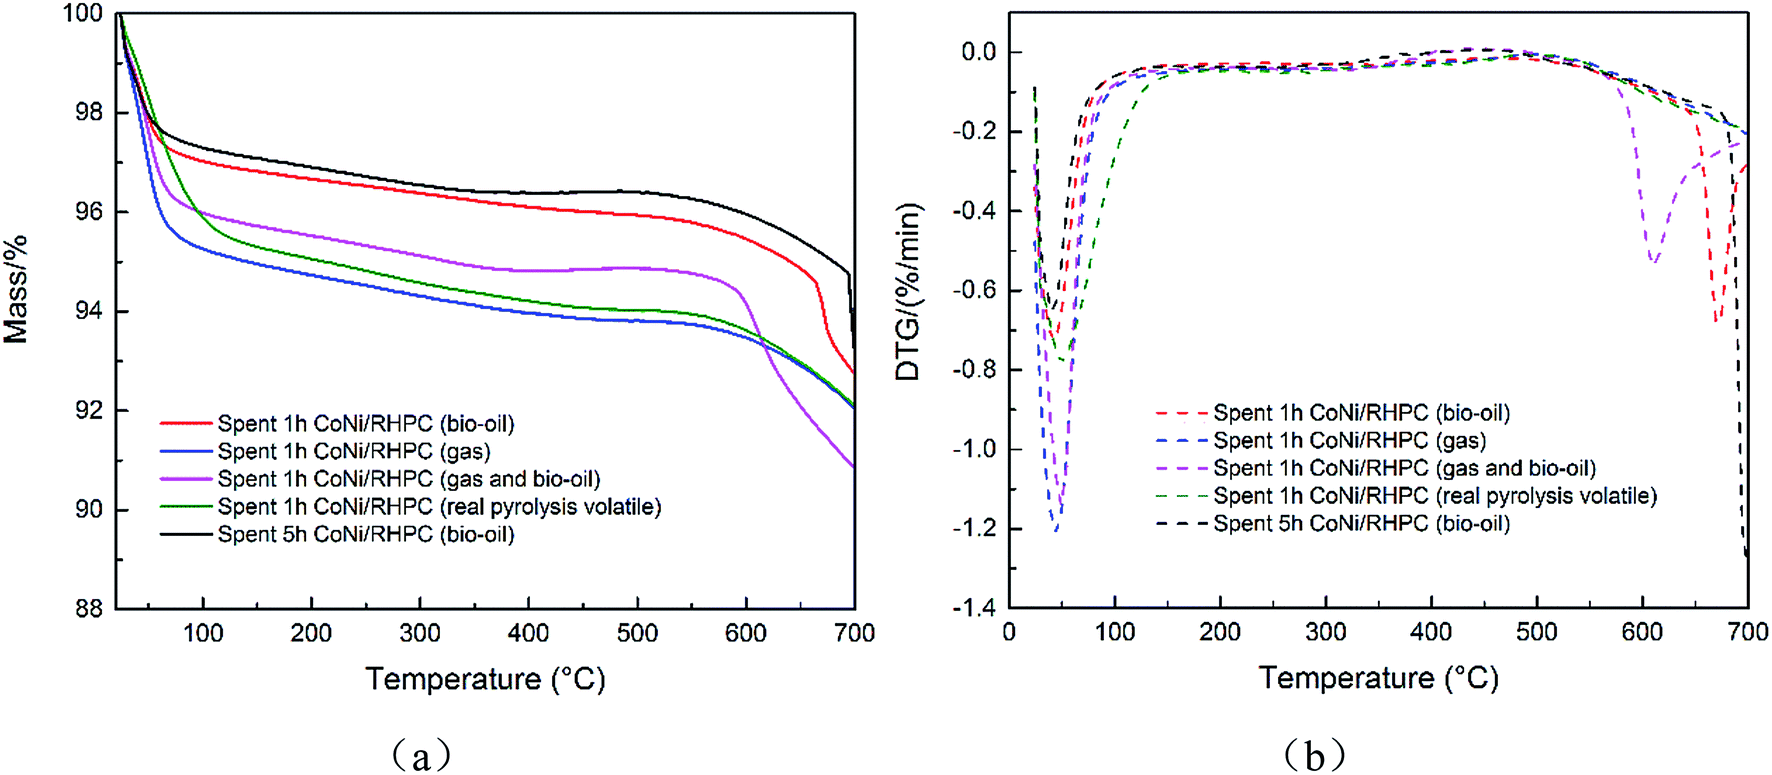 | ||
| Fig. 6 The thermogravimetric analysis of spent CoNi/RHPC ((a) TG, (b) DTG). Spent 1 h CoNi/RHPC (bio-oil) means the experiment held on 1 h and the reactant was bio-oil. Spent 1 h CoNi/RHPC (gas) means the experiment held on 1 h and the reactant was gas. Spent 1 h CoNi/RHPC (gas and bio-oil) means the experiment held on 1 h and the reactant was gas and bio-oil. Spent 1 h CoNi/RHPC (real pyrolysis volatile) means the experiment held on 1 h and the reactant was real pyrolysis volatile. Spent 5 h CoNi/RHPC (bio-oil) means the experiment held on 5 h and the reactant was bio-oil. | ||
| Catalyst | Mass loss/% | Temperature range/°C |
|---|---|---|
| Fresh CoNi/RHPC (reduced) | 0.50% | 304.6–529.6 |
| Spent 1 h CoNi/RHPC (bio-oil) | 0.60% | 224.2–464.2 |
| Spent 1 h CoNi/RHPC (gas) | 0.77% | 233.3–483.3 |
| Spent 1 h CoNi/RHPC (gas and bio-oil) | 0.67% | 199.1–464.1 |
| Spent 1 h CoNi/RHPC (real pyrolysis volatile) | 0.86% | 233.5–483.5 |
| Spent 5 h CoNi/RHPC (bio-oil) | 0.67% | 154.8–454.8 |
3.2. Catalyst reforming reaction
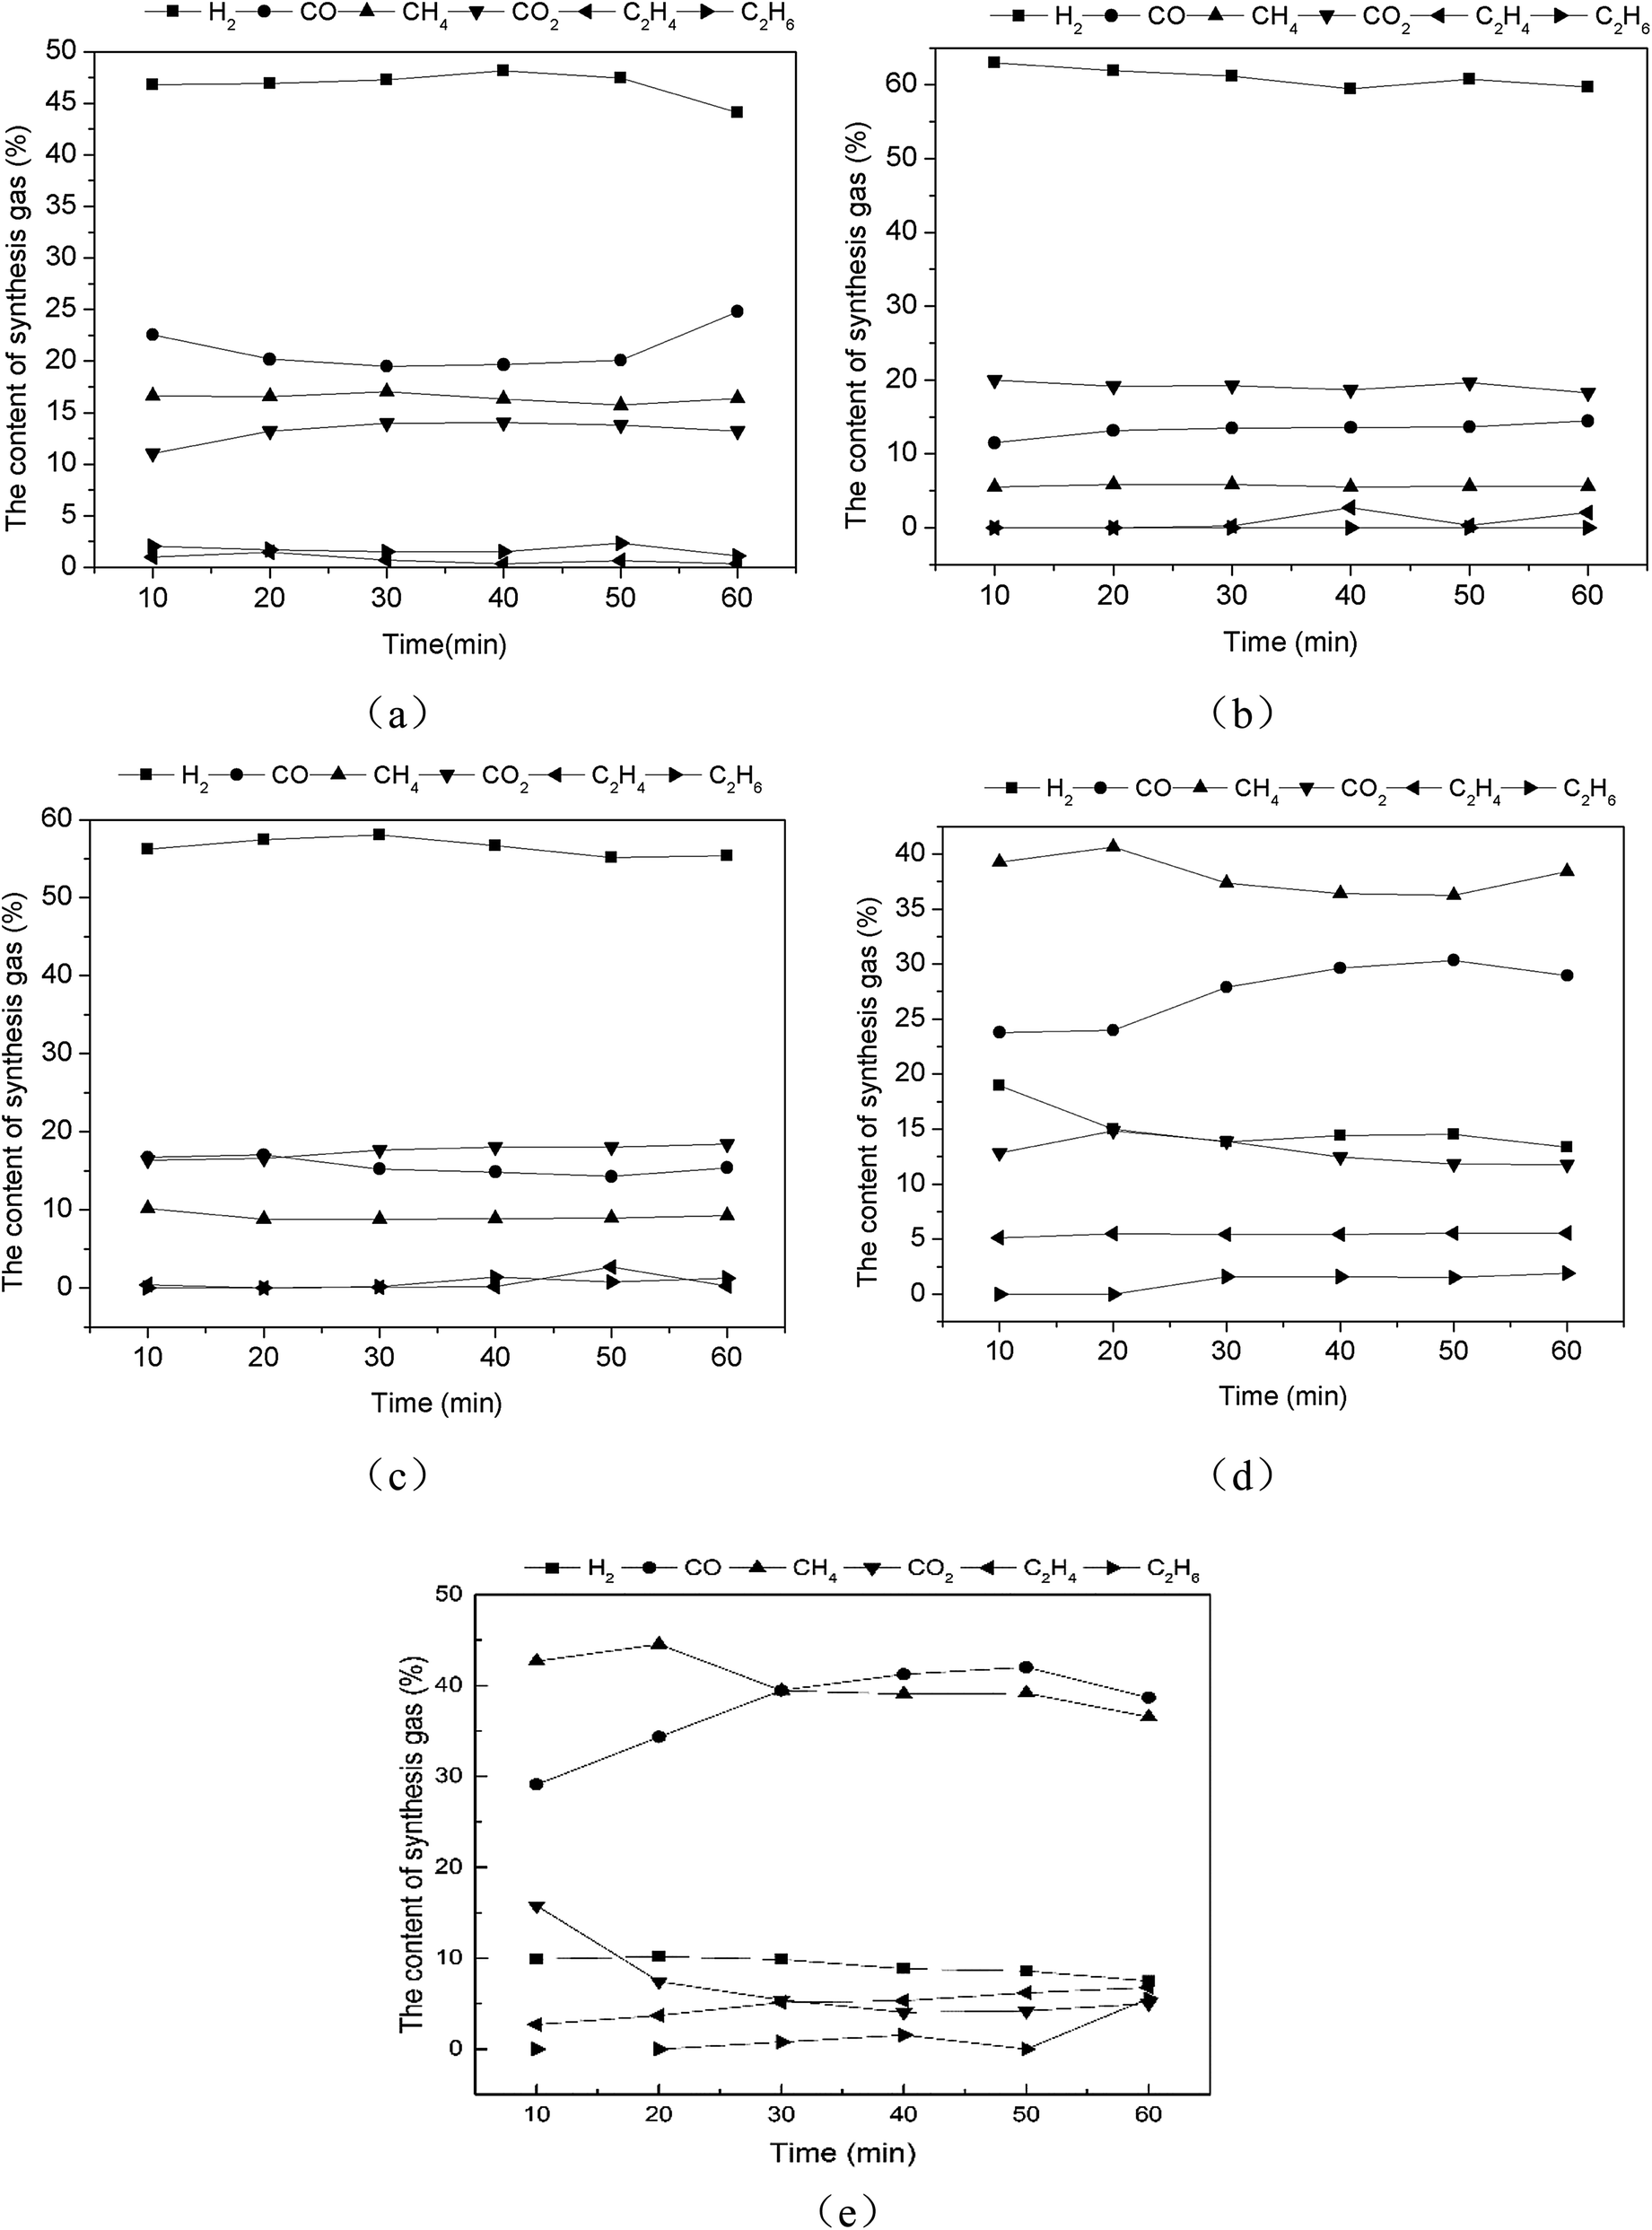 | ||
| Fig. 7 The catalytic reforming of bio-oil with different rice husk pyrolysis char catalysts ((a) 0.2Ni/RHPC, (b) 0.2Co/RHPC, (c) 0.1Ni–0.1Co/RHPC, (d) blank (silica instead of catalysts), (e) RHPC). | ||
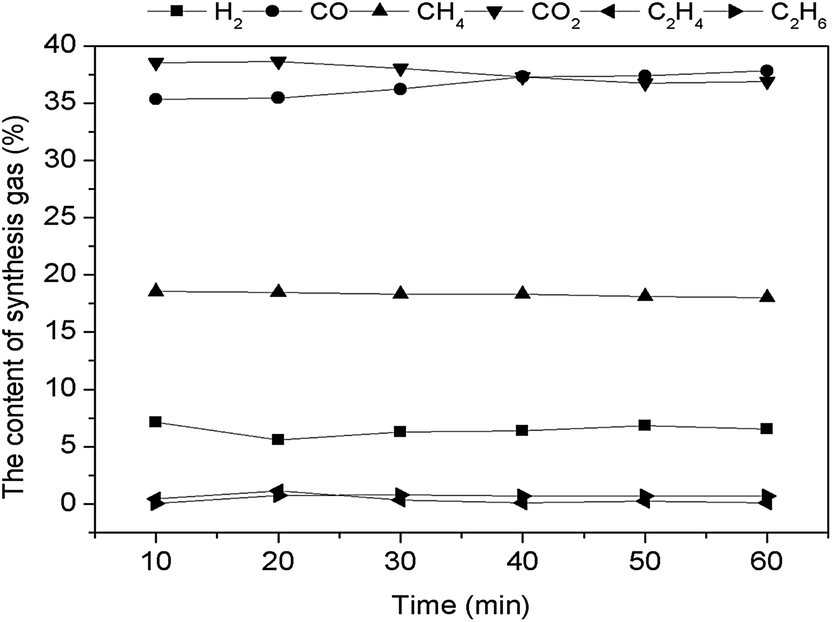 | ||
| Fig. 8 The catalytic reforming of gas with 0.1Ni–0.1Co/RHPC catalysts. | ||
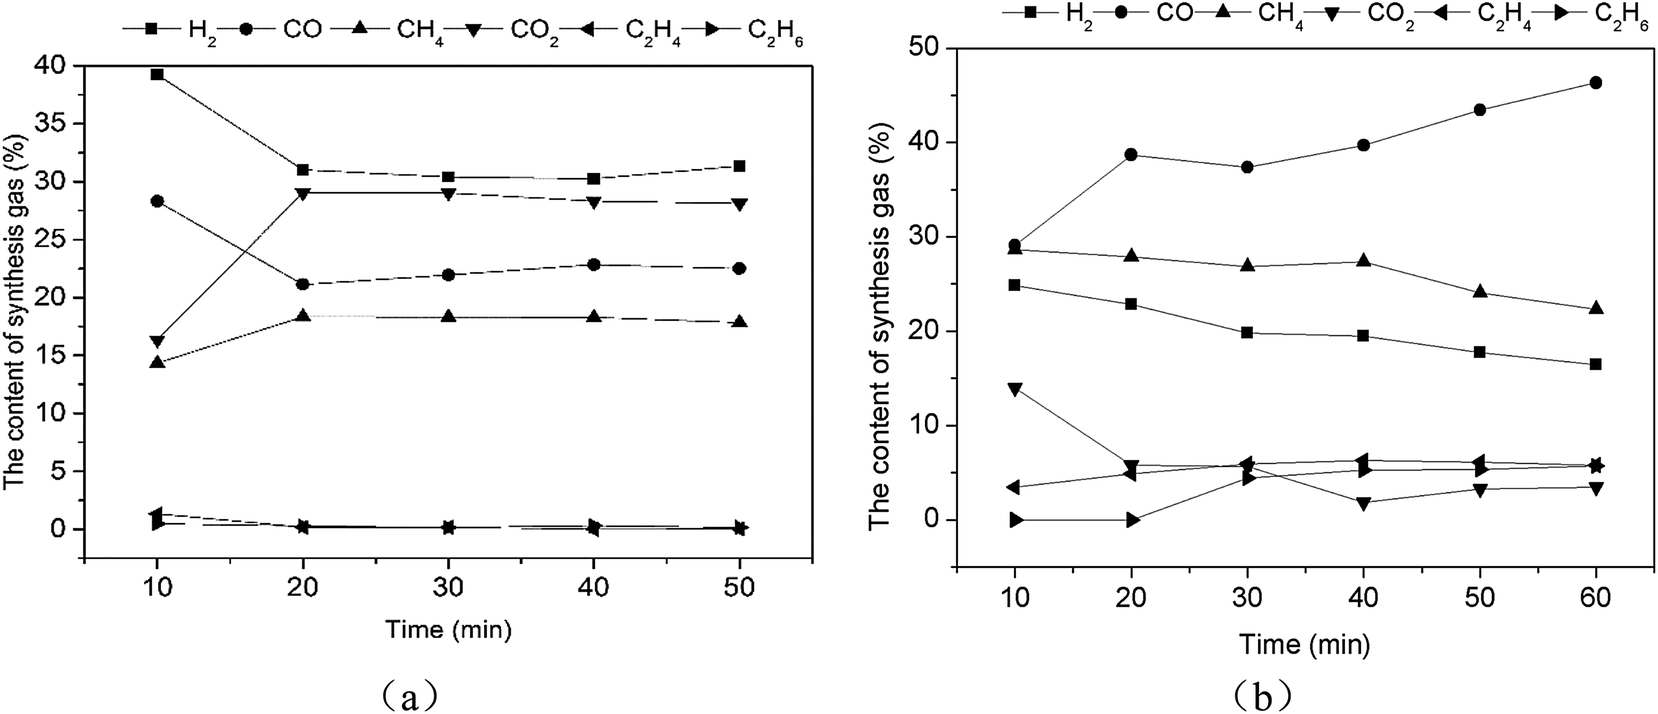 | ||
| Fig. 9 The catalytic reforming of real rice husk with catalysts 0.1Ni–0.1Co/RHPC ((a) models (mixed gas and bio-oil), (b) real pyrolysis volatile). | ||
As displayed in Fig. 9(b), the contents of the synthesis gases were sorted in the following order: CO, CH4, H2, C2H4, and C2H6 after the reforming reaction of the real pyrolysis volatile with 0.1Ni–0.1Co/RHPC. CO gradually increased, whereas both CH4 and H2 gradually decreased during the entire reaction. CO2 decreased rapidly after 10 min and became stable after 40 min. C2H4 content had no apparent change. C2H6 started to increase after 20 min and then gradually stabilized.
Real pyrolysis volatiles and simulants showed different content values with different catalyst. The total content of the main four gases from simulants was 99.47%. Specifically, H2, CO2, CO, and CH4 content values were 33.22%, 26.41%, 23.10%, and 16.74%, respectively. The total contents of the main four gas from the real pyrolysis volatile exceeded 91.12%. In particular, CO, CH4, H2, and CO2 content values were 39.10%, 26.18%, 20.18%, and 5.65%, respectively. Thus, some hydrocarbon matters in the volatile were not completely reformed and converted, because the components of the volatile were more complex than those of the simulants.
3.3. Influence of weight hourly space velocity (WHSV) on gas distribution
Given that other conditions remained unchanged, WHSV increased from 0.5 h−1 to 2 h−1 (the feeding quantity of simulants remained unchanged, whereas the dosage of catalyst was altered), and the influence on the gas products distribution was studied.As shown in Fig. 10(a), H2 contents decreased first and then increased as the WHSV increased. Their average values were 59.96%, 55.83%, and 56.04%. On the contrary, CO contents increased initially and then decreased as the WHSV increased. Their average values were 16.55%, 17.43%, and 15.51%, as shown in Fig. 10(b). From Fig. 10(c), CH4 contents presented a progressively increasing trend as the WHSV increased and had values of 8.48%, 9.15%, and 9.48%. CO2 contents were 14.94%, 16.35%, and 17.65% (Fig. 10(d)) and progressively increased as the WHSV increased. Meanwhile, C2H4 contents were 0.08%, 0.62%, and 0.59% (Fig. 10(e)). They increased first and then decreased as the WHSV increased. Moreover, as shown in Fig. 10(f), C2H6 contents were 0%, 0.61%, and 0.73% and increased as the WHSV increased.
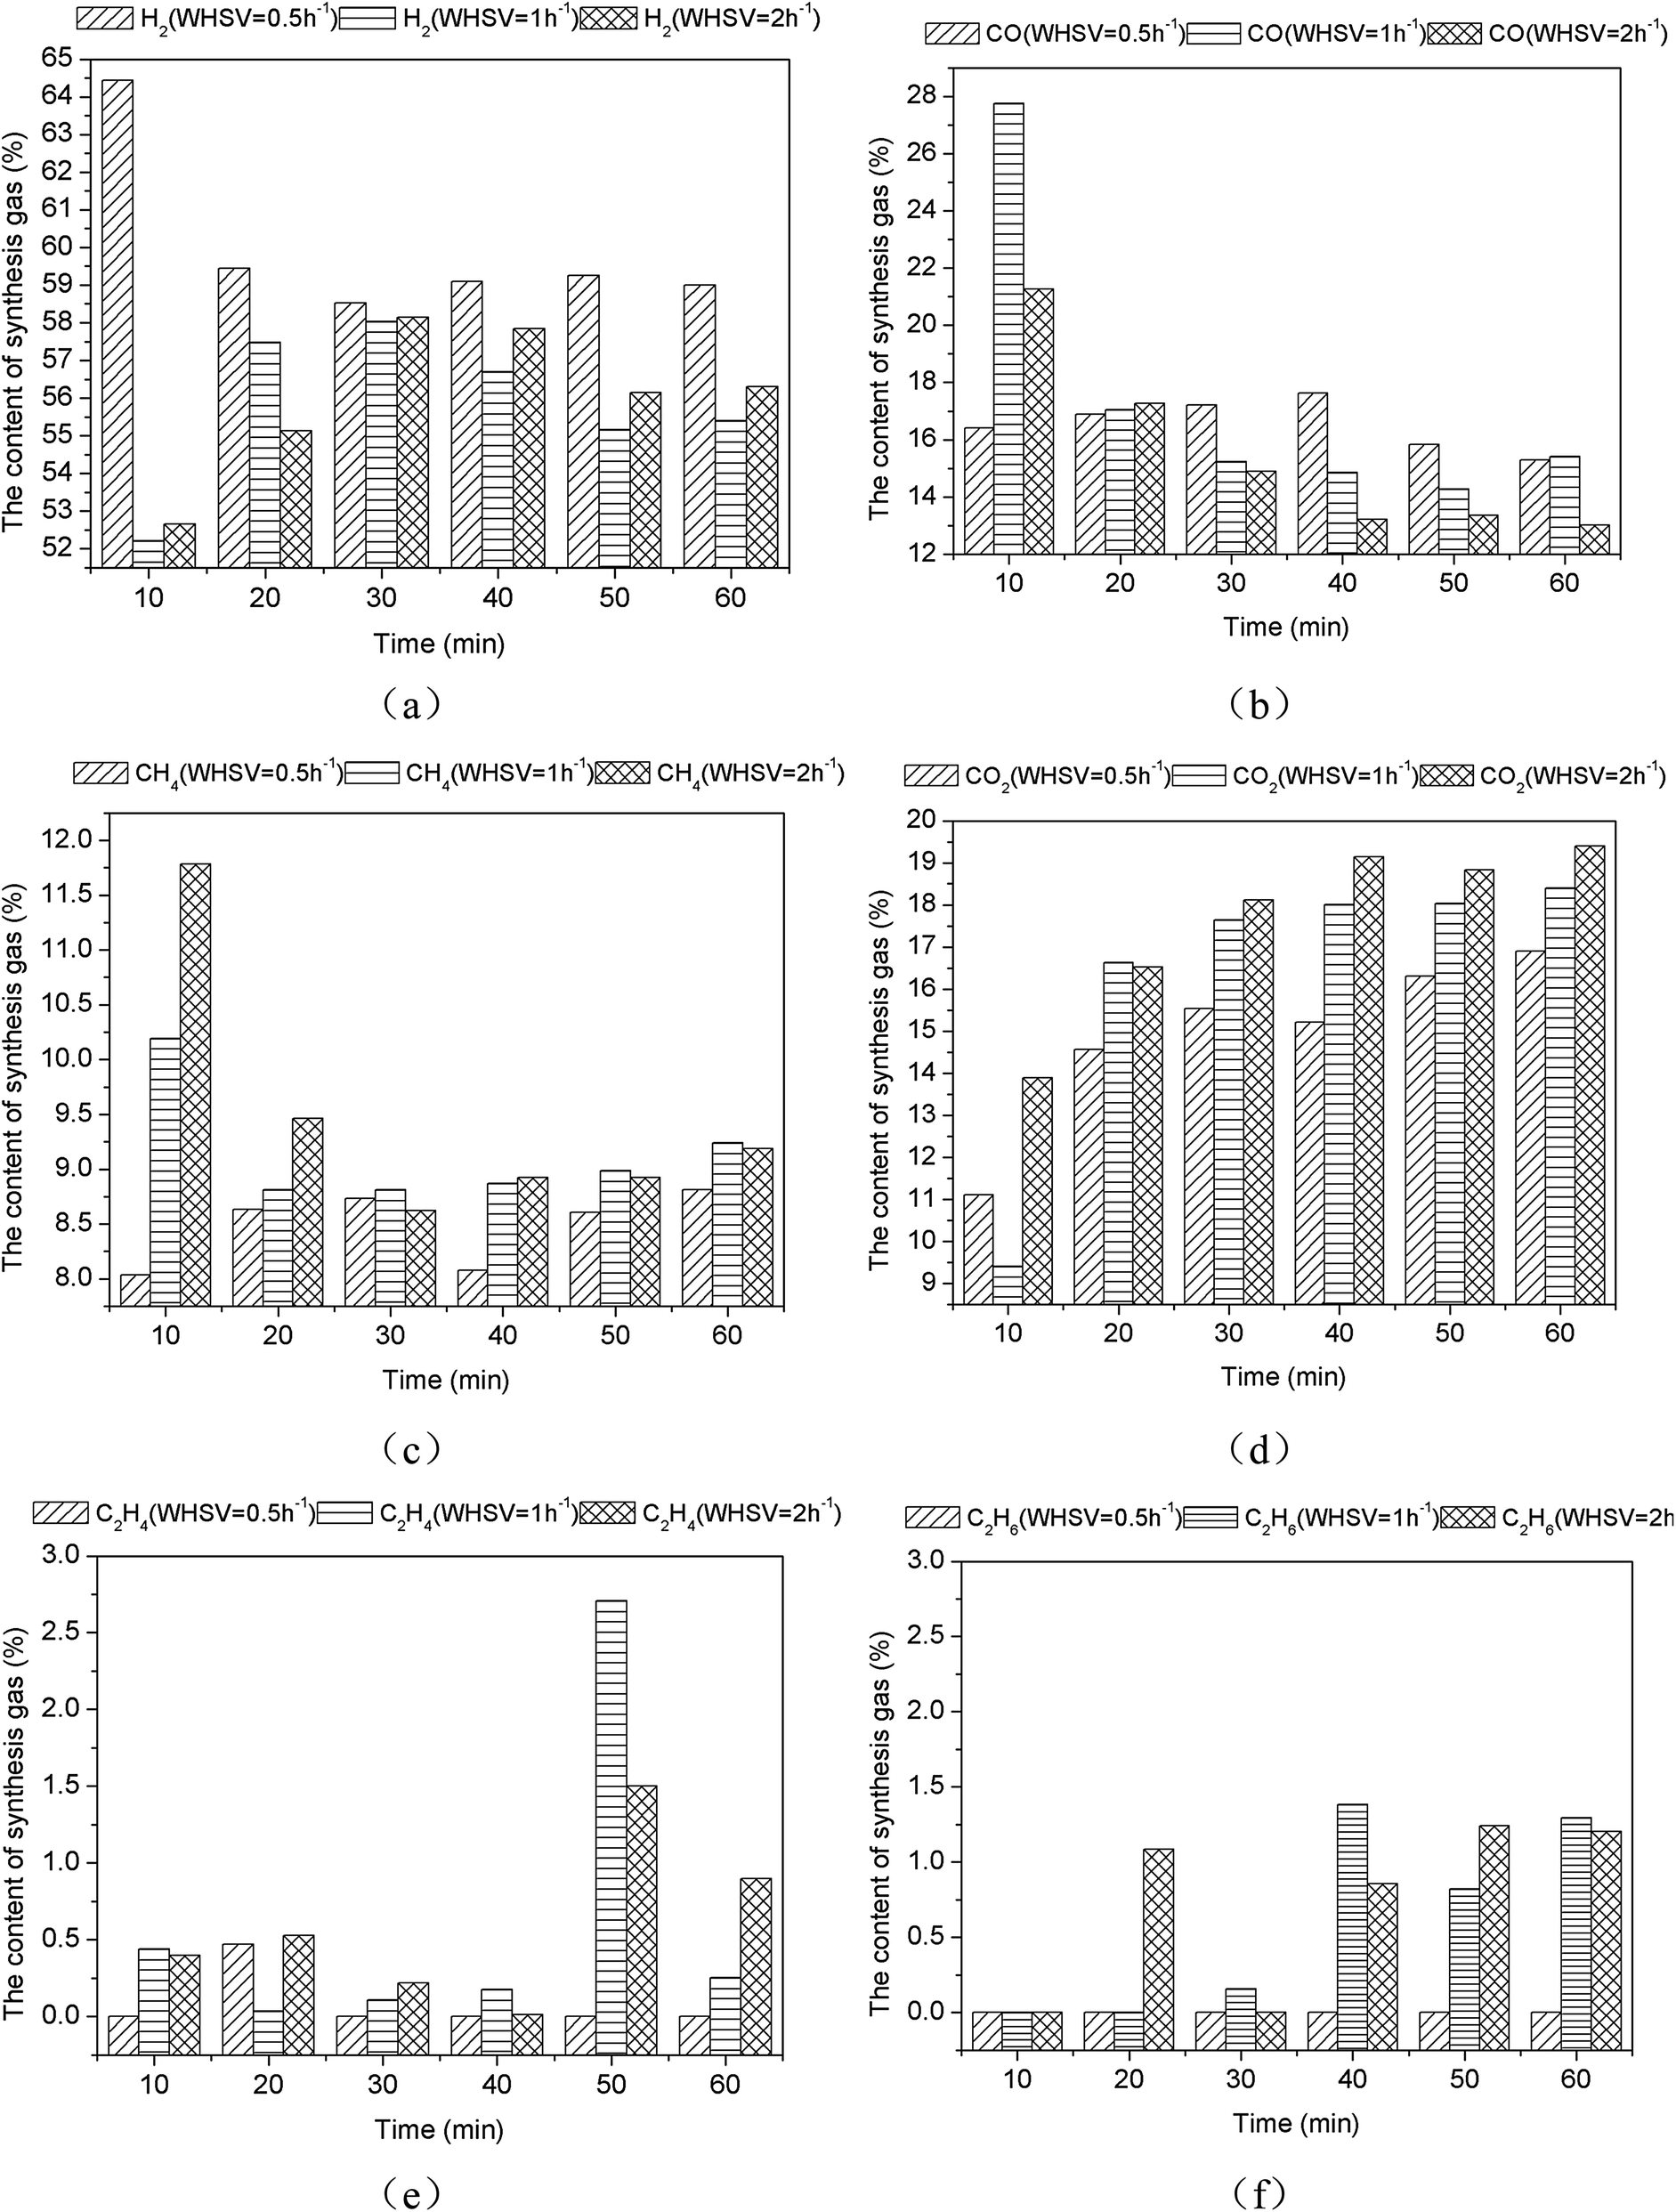 | ||
| Fig. 10 Influence of weight hourly space velocity (WHSV) on gas distribution through CR of bio-oil using 0.1Ni–0.1Co/RHPC ((a) H2, (b) CO, (c) CH4, (d) CO2, (e) C2H4, (f) C2H6). | ||
When the WHSV was 0.5 h−1, the H2 content reached its maximum value (64.44%), and the average content was approximately 59.96%. When WHSV was 1 h−1, CO, CH4, and C2H2 contents achieved their maximum values. Finally, when WHSV was 2 h−1, CO2 and C2H6 contents reached their maximum values. The results indicated that relatively low space velocity was beneficial for H2 generation and have improved selectivity for H2. However, relatively large space velocity displayed certain inhibitory effects on H2. This finding was identical to the results of Seyedeyn-Azad F. et al.33
3.4. Influence of temperature on product distribution
Fig. 11 illustrates the variation trend of gas products in CR of bio-oil at different temperatures. When the temperature increased from 500 °C to 900 °C, the H2 content in the gas decreased first and then increased, CO content gradually increased, CH4 content first remained stable and then decreased, and CO2 content gradually decreased. Meanwhile, C2H4 and C2H6 contents were small and thus had no apparent change. These results indicated that increasing the temperature is conducive to reforming reactions in equal (8). Notably, as the temperature increased, CH4 content decreased from 11.24% to 3.83% and CO2 content decreased from 20.04% to 2.40%, whereas CO content increased from 11.76% to 36.99%.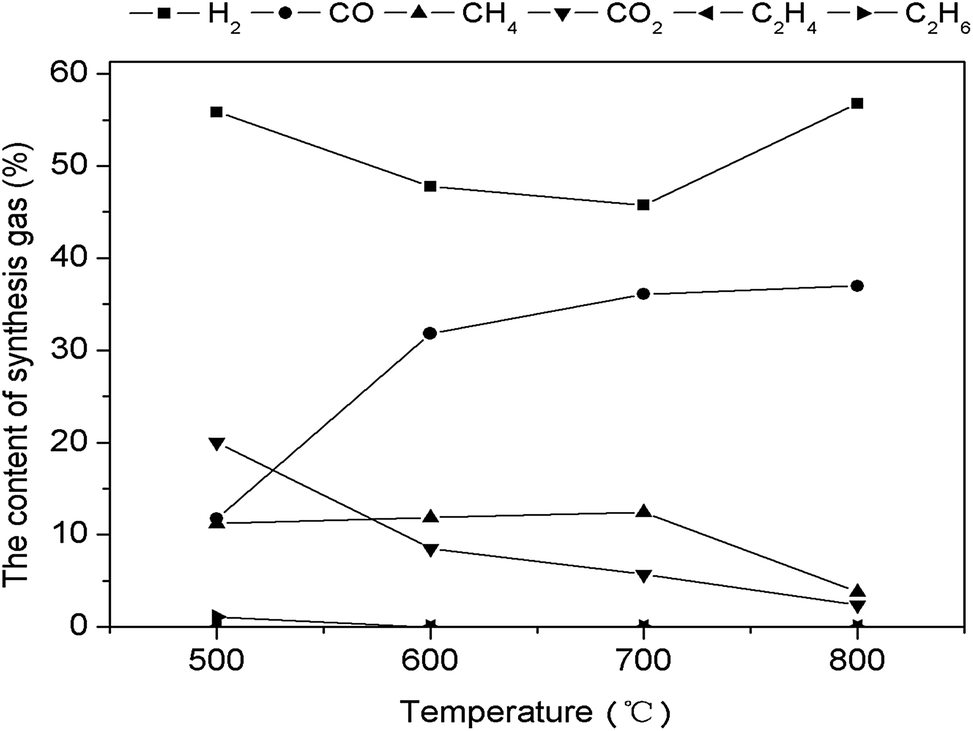 | ||
| Fig. 11 Influence of temperature on products distribution through CR of bio-oil using 0.1Ni–0.1Co/RHPC. | ||
H2 content rapidly increased when the reaction temperature increased to 800 °C. Under the role of steam, increasing the temperature facilitates the CR reaction. For example, steam catalytic reforming of hydrocarbon resulted in H2 generation. Although temperature increase promoted CO2 reduction reaction, it exerted a slight inhibitory effect on the water gas shift reaction. As a result, CO2 content continuously decreased, whereas CO content gradually increased. In addition, CH4 content started to decrease mainly because of the endothermic steam reforming reaction of hydrocarbons, and high temperature resulted in enhancing of methane CR reaction. Thus, temperature increase is beneficial to this reaction.
3.5. Life of RHPC catalysts
As shown in Fig. 12, the 0.1Ni–0.1Co/RHPC catalyst showed excellent catalytic performance, and H2 and CO2 content stabilized at 55.86% and 19.25% during 5 h, respectively. It indicated that 0.1Ni–0.1Co/RHPC catalyst taking rice husk pyrolysis carbon as support is stable and active34 H2, CO2, CO and CH4 were the main components. Meanwhile, H2 content was much higher than the CH4. Under the role of 0.1Ni–0.1Co/RHPC, the components of the gases gradually stabilized after 50 min, and were sorted in the following order: H2, CO2, CO, CH4, C2H6, and C2H4. H2 content constituted the largest proportion, and the gas contents during the entire reforming reaction process were stable. In addition, the surface property of catalyst showed favorable activity during the RC processing. And the life of catalyst was not weakened. Therefore, the catalysts exhibited good activities and long service time. | ||
| Fig. 12 Long-time 0.1Ni–0.1Co/RHPC reaction through CR of bio-oil. | ||
3.6. Reaction path
In the absence of catalysts, biomass pyrolysis volatile matters must undergo pyrolysis and reform under high-temperature. The components of rice husk pyrolysis volatiles was extremely complex. Thus, their reaction paths varied. The main paths during the CR process of the simulants were described as follows:7,20,35–38Pyrolysis:
| Biomass → char + tar + water (steam) + gases (CO, H2, CO2, H2O, CH4) + hydrocarbons bio-oil + ash + H2S + HCN + NH3 + HCl + sulfur species | (1) |
Catalytic reforming:
| CxHyOz → CmHnOj + kH2O + uC + gases (H2, CO, CO2, CH4, C2H4, …, CfHf+2) | (2) |
| CxHy + xH2O → xCO + (x + y/2)H2 (steam reforming) | (3) |
| CxHy + xCO2 → (2x)CO + (y/2)H2 (dry reforming) | (4) |
| CH4 + H2O → 3H2 + CO (steam reforming methane reaction) | (5) |
| CO + H2O → H2 + CO2 (water gas shift reaction) | (6) |
| C + H2O → H2 + CO (water gas reaction) | (7) |
| C + CO2 → 2CO | (8) |
The above reactions were important for gaseous products. The synthesis gases were the main components prepared through CR of rice husk pyrolysis volatiles or their simulants. Most of the reactions were endothermic. Therefore, high temperature is beneficial for the reaction. Furthermore, reaction temperature, space velocity, and catalyst type affected the chemical equilibrium of the reactions and thus influenced gaseous products' distribution. Theoretically, quantitative control gaseous product components can be implemented only if the above conditions were reasonably regulated.36
Rice husk pyrolysis volatiles during the reaction process mainly included the following reactions, namely, pyrolysis and CR (Fig. 13). The catalysts considerably affected product distribution, and rice husk pyrolysis typically generates CO, H2, CO2, CH4, tars (benzene and other aromatic hydrocarbons), char, organic vapors, water vapor, hydrogen sulfide (H2S), residual solids, and other trace species (HCN, NH3, and HCl), depending on the processing conditions. The general reaction of the rice husk pyrolysis is shown in eqn (1).38 The catalysts significantly influenced the components of synthesis gas, and the main reactions are SR (eqn (3)), dry reforming (eqn (4)), steam reforming methane (eqn (5)), water gas shift (eqn (6)), and water gas (eqn (7)). Synthesis gas generated after the reforming reaction mainly contained CH4, H2, CO2, CO, C2H6, and C2H4.
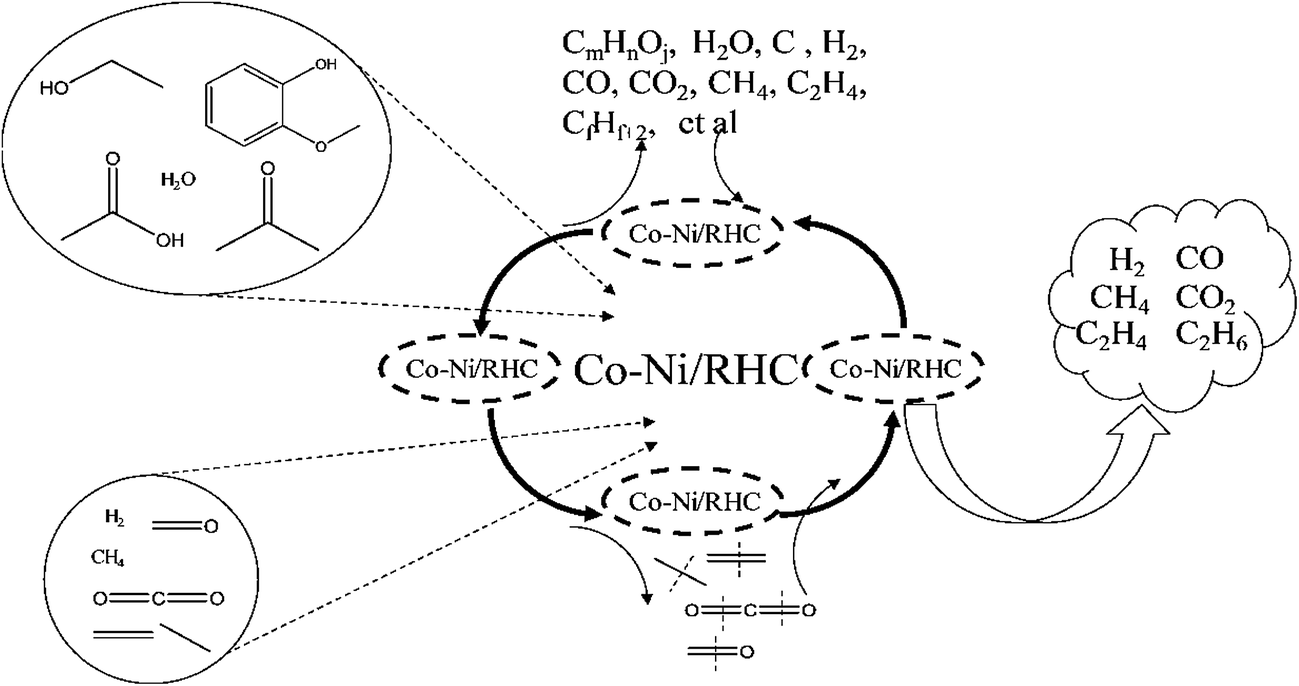 | ||
| Fig. 13 Possible reaction paths of synthesis gas prepared (simulant bio-oil and bio-gas) through 0.1Co–0.1Ni/RHPC CR. | ||
Simulant bio-oil underwent pyrolysis first (2) under high temperatures during the CR process and generated water, gases, and other organic matters. 0.1Ni–0.1Co/RHPC displayed the highest selectivity to H2, as shown in Fig. 8, especially during the steam reforming (3), water gas shift, (6) and water gas (3) reactions. Dry reforming was inhibited, and the water gas shift reaction was accelerated. Consequently, CO2 content was higher than CO. Meanwhile, the reforming reaction of CH4 was inhibited, and its content was lower than that of CO. Additionally, C2H6 and C2H4 residues were also present in extremely small quantities.
As shown in Fig. 9(a), the addition of 0.1Ni–0.1Co/RHPC during the CR process of simulant bio-oil and gas resulted in high conversion and selectivity to H2, especially during the steam reforming (3), water gas shift (6), and water gas reactions (7). Meanwhile, methane reforming was also accelerated. In Fig. 9(b), the addition of 0.1Ni–0.1Co/RHPC during the catalyst reforming reaction process of pyrolysis volatiles resulted in high conversion and selectivity to CH4 and H2. In addition, CH4 and H2 achieved the highest yield, both exceeding 53%.
4. Conclusions
(1) The rice husk was completely used for synthesis gas. The pyrolysis volatiles (gas and bio-oil) of rice husk was used as raw materials to produce synthesis gas. And the bio-char from the rice husk pyrolysis was used as the catalysts for catalytic reforming of pyrolysis volatiles of rice husk.(2) The characterization of catalysts results shows the metal Ni and Co promotes the catalytic conversion of organic material in the rice husk pyrolysis carbon, produces new and rich pore and channel and improves the property of HRPC. The BET of catalyst increased from 4 to 96 cm3 g−1. And the catalysts is stable during the reaction.
(3) During the catalytic reforming of bio-oil, 0.1Ni–0.1Co/RHPC displayed high selectivity to H2. Its average content was 56.50%. In addition, 0.1Ni–0.1Co facilitated CH4 and H2 yield in the gas. In the catalytic reforming reaction of real pyrolysis volatile, the addition of 0.1Ni–0.1Co/RHPC resulted in high conversion and good selectivity to CH4 and H2, whose yields exceeded 53%.
(4) When WHSV was 0.5 h−1, H2 content reached its maximum (64.44%). This result indicated that low space velocity is beneficial to H2 generation and improved selectivity to H2. High temperature is conducive to the reforming reaction. In particular, 500 °C is suitable for H2 and CH4 generation. The contents of various gases during the reforming reaction process with 0.1Ni–0.1Co/RHPC catalyst were stable and exhibited good activities. In addition, the life of the catalyst was not weakened.
Acknowledgements
This work was supported by the Science and Technology Planning Project of Guangdong Province, China (Grant No. 2016A020210073), National Natural Science Foundation of China (Grant No. 51576071), Cooperative exchange project between the National Natural Science Foundation of China (NSFC) and Royal Society (RS), China (Grant No. 51711530230), the Science and Technology Planning Project of Guangdong Province, China (Grant No. 2015B020237010), National Natural Science Foundation of China (Grant No. 51306190), and Natural Foundation of Hainan Province, China (Grant No. 314185).References
- S. Nakanishi, In situ CO2-emission Assisted Synthesis of Molybdenum Carbonitride Nanomaterial as Hydrogen Evolution Electrocatalyst, J. Am. Chem. Soc., 2016, 137(1), 110–113 Search PubMed.
- B. Cai, et al., Evaluating CO2 emission performance in China's cement industry: An enterprise perspective, Appl. Energy, 2016, 166, 191–200 CrossRef CAS.
- K. I. Galkin, et al., Critical Influence of 5-Hydroxymethylfurfural Aging and Decomposition on the Utility of Biomass Conversion in Organic Synthesis, Angew. Chem., 2016, 55(29), 8338–8342 CrossRef CAS PubMed.
- R. Daniel, S. Crossley and B. Wang, Zeolite-Catalysed C–C Bond Forming Reactions for Biomass Conversion to Fuels and Chemicals, Catal. Sci. Technol., 2016, 6(8), 2543–2559 Search PubMed.
- J. J. Roylance and K. S. Choi, Electrochemical reductive biomass conversion: direct conversion of 5-hydroxymethylfurfural (HMF) to 2,5-hexanedione (HD) via reductive ring-opening, Green Chem., 2016, 18(10), 2956–2960 RSC.
- Z. Zhang, et al., Acidic Ultrafine Tungsten Oxide Molecular Wires for Cellulosic Biomass Conversion, Angew. Chem., 2016, 55(35), 10390–10394 CrossRef.
- R. Trane, S. Dahl, M. S. Skjøth-Rasmussen and A. D. Jensen, Catalytic steam reforming of bio-oil, Int. J. Hydrogen Energy, 2012, 37(8), 6447–6472 CrossRef CAS.
- A. Tamošinas, P. Valatkeviius, V. Valinius and R. Levinskas, Biomass conversion to hydrogen-rich synthesis fuels using water steam plasma, C. R. Chim., 2016, 19, 433–440 CrossRef.
- L. Garcia, R. French, S. Czernik and E. Chornet, Catalytic steam reforming of bio-oils for the production of hydrogen: effects of catalyst composition, Appl. Catal., A, 2000, 201(2), 225–239 CrossRef CAS.
- R. K. Sharma and N. N. Bakhshi, Catalytic upgrading of biomass-derived oils to transportation fuels and chemicals, Can. J. Chem. Eng., 1991, 69(5), 1071–1081 CrossRef CAS.
- G. W. Huber, A. Sara Iborra and A. Corma, Synthesis of Transportation Fuels from Biomass: Chemistry, Catalysts, and Engineering, Chem. Rev., 2006, 4044–4098 CrossRef CAS PubMed.
- S. Nakamura, S. Kitano and K. Yoshikawa, Biomass gasification process with the tar removal technologies utilizing bio-oil scrubber and char bed, Appl. Energy, 2016, 170, 186–192 CrossRef CAS.
- W. Cai and R. Liu, Performance of a commercial-scale biomass fast pyrolysis plant for bio-oil production, Fuel, 2016, 182, 677–686 CrossRef CAS.
- S. R. Wu, et al., Comparison of oil-tea shell and Douglas-fir sawdust for the production of bio-oils and chars in a fluidized-bed fast pyrolysis system, Fuel, 2016, 175, 57–63 CrossRef CAS.
- U. Moralı, N. Yavuzel and S. Şensöz, Pyrolysis of hornbeam (Carpinus betulus L.) sawdust: Characterization of bio-oil and bio-char, Bioresour. Technol., 2016, 221, 682–685 CrossRef PubMed.
- D. K. Naik, et al., Pyrolysis of sorghum bagasse biomass into bio-char and bio-oil products, J. Therm. Anal. Calorim., 2017, 127(2), 1277–1289 CrossRef.
- N. Tran, Y. Uemura, S. Chowdhury and A. Ramli, A Review of Bio-Oil Upgrading by Catalytic Hydrodeoxygenation, Appl. Mech. Mater., 2014, 625, 255–258 CrossRef CAS.
- J. Payormhorm, Pt/Al2O3-catalytic deoxygenation for upgrading of Leucaena leucocephala-pyrolysis oil, Bioresour. Technol., 2013, 139(7), 128–135 CrossRef CAS PubMed.
- T. Hou, B. Yu, S. Zhang, T. Xu, D. Wang and W. Cai, Hydrogen production from ethanol steam reforming over Rh/CeO2 catalyst, Catal. Commun., 2015, 58, 137–140 CrossRef CAS.
- K. N. Papageridis, G. Siakavelas, N. D. Charisiou, D. G. Avraam, L. Tzounis and K. Kousi, et al., Comparative study of Ni, Co, Cu supported on γ-alumina catalysts for hydrogen production via the glycerol steam reforming reaction, Fuel Process. Technol., 2016, 152, 156–175 CrossRef CAS.
- Y. Wang, S. De and N. Yan, Rational control of nano-scale metal-catalysts for biomass conversion, Chem. Commun., 2016, 52(37), 6210–6224 RSC.
- S. Wang, Q. Cai, F. Zhang, X. Li, Z. Li and Z. Luo, Hydrogen production via catalytic reforming of the bio-oil model compounds: Acetic acid, phenol and hydroxyacetone, Int. J. Hydrogen Energy, 2014, 39(32), 18675–18687 CrossRef CAS.
- H. S. Roh, Y. Wang and D. L. King, Selective production of H2 from ethanol at low temperatures over Rh/ZrO2–CeO2 catalysts, Top. Catal., 2008, 49(1–2), 32–37 CrossRef CAS.
- J. G. Zhang, J. Teo, X. Chen, H. Asakura, T. Tanaka, K. Teramura and N. Yan, A Series of NiM (M = Ru, Rh, and Pd) Bimetallic Catalysts for Effective Lignin Hydrogenolysis in Water, ACS Catal., 2014, 4(5), 1574–1583 CrossRef CAS.
- H. Konnerth, J. Zhang, M. Ding, M. H. G. Prechtl and N. Yan, Base promoted hydrogenolysis of lignin model compounds and organosolv lignin over metal catalysts in water, Chem. Eng. Sci., 2015, 123, 155–163 CrossRef CAS.
- S. De, J. G. Zhang, R. Luque and N. Yan, Ni-Based bimetallic heterogeneous catalysts for energy and environmental applications, Energy Environ. Sci., 2016, 9, 3314–3347 CAS.
- X. W. Xu and E. C. Jiang, Hydrogen from wood vinegar via catalytic reforming over Ni/Ce/γ-Al2O3 catalyst, J. Anal. Appl. Pyrolysis, 2014, 107, 1–8 CrossRef CAS.
- X. B. Zhang, J. M. Yan, S. Han, H. Shioyama and Q. Xu, Magnetically recyclable Fe@Pt core–shell nanoparticles and their use as electrocatalysts for ammonia borane oxidation: the role of crystallinity of the core, J. Am. Chem. Soc., 2009, 131(8), 2778–2779 CrossRef CAS PubMed.
- Z. Peng, H. You and H. Yang, An Electrochemical Approach to PtAg Alloy Nanostructures Rich in Pt at the Surface, Adv. Funct. Mater., 2010, 20(21), 3734–3741 CrossRef CAS.
- A. R. Hidayu, N. F. Mohamad, S. Matali and A. S. A. K. Sharifah, Characterization of activated carbon prepared from oil palm empty fruit bunch using BET and FT-IR techniques, Procedia Eng., 2013, 68(68), 379–384 CrossRef CAS.
- J. Ryczkowski, S. Pasieczna, J. L. Figueiredo, M. F. R. Pereira and T. Borowiecki, Characterization of activated carbons by FT-IR/PAS and TPD, J. Phys. IV, 2004, 117(117), 57–64 CAS.
- R. R. Davda, J. W. Shabaker, G. W. Huber, R. D. Cortright and J. A. Dumesic, A review of catalytic issues and process conditions for renewable hydrogen and alkanes by aqueous-phase reforming of oxygenated hydrocarbons over supported metal catalysts, Appl. Catal., B, 2005, 56(1–2), 171–186 CrossRef CAS.
- F. Seyedeyn-Azad, E. Salehi, J. Abedi and T. Harding, Biomass to hydrogen via catalytic steam reforming of bio-oil over Ni-supported alumina catalysts, Fuel Abstr. Curr. Titles, 2011, 92(3), 563–569 CAS.
- S. H. Cho and D. J. Moon, Aqueous phase reforming of glycerol over Ni-based catalysts for hydrogen production, J. Nanosci. Nanotechnol., 2011, 11(8), 7311–7314 CrossRef CAS PubMed.
- J. R. Rostrup-Nielsen, J. Sehested and J. K. Nørskov, Hydrogen and synthesis gas by steam- and CO2, reforming, Adv. Catal., 2002, 47(02), 65–139 CAS.
- J. Remón, F. Broust, J. Valette, Y. Chhiti, I. Alava and A. R. Fernandez-Akarregi, et al., Production of a hydrogen-rich gas from fast pyrolysis bio-oils: Comparison between homogeneous and catalytic steam reforming routes, Int. J. Hydrogen Energy, 2014, 39(1), 171–182 CrossRef.
- X. W. Xu, E. C. Jiang, M. F. Wang and B. S. Li, Rich hydrogen production from crude gas secondary catalytic cracking over Fe/γ-Al2O3, Renewable Energy, 2012, 39(1), 126–131 CrossRef CAS.
- M. M. Yung, W. S. Jablonski and K. A. Magrinibair, Review of Catalytic Conditioning of Biomass-Derived Syngas, Energy Fuels, 2009, 23(4), 1874–1887 CrossRef CAS.
| This journal is © The Royal Society of Chemistry 2017 |