DOI:
10.1039/C7RA04510G
(Paper)
RSC Adv., 2017,
7, 33544-33551
Non-stoichiometric carbon-coated LiFexPO4 as cathode materials for high-performance Li-ion batteries†
Received
21st April 2017
, Accepted 28th June 2017
First published on 3rd July 2017
Abstract
A series of non-stoichiometric carbon-coated lithium iron phosphate (LiFexPO4/C) have been prepared by a solid-state reaction to study the variation of electrochemical performance at different x values. Characterized by XRD in conjunction with Rietveld refinement, Mössbauer, TEM, Raman, etc., it is indicated that the Li–O bond is elongated in the Fe-poor non-stoichiometric lithium iron phosphate with decreasing x value, while the content of Fe2P and graphitization degree of carbon layer in LiFexPO4/C samples is associated with the ratio of x. The powder electronic conductivity increases from 8.33 × 10⁻² S cm−1 to 16.67 × 10⁻² S cm−1 as the x value decreases from 1.04 to 0.98, which is due to a suitable amount of Fe2P and a superior graphitized carbon layer. Among different Fe/Li ratios, LiFe0.98PO4/C exhibits the highest rate capability of 163.5 mA h g−1 at 0.1C and 93.5 mA h g−1 at 20C, as well as the largest diffusion coefficient of 12.6 × 10⁻¹⁴ cm2 s−1. It is illustrated that the synergy effect of elongated Li–O bonds, moderate Fe2P and graphitized carbon layer results in the high performance of non-stoichiometric LiFexPO4/C.
1. Introduction
Lithium iron phosphate, with the characteristics of high theoretical capacity, inexpensive cost, environmental benignity and safety,1–3 except for low electronic conductivity and ionic diffusivity,4,5 has attracted much attention as a promising cathode material for Li-ion batteries.6,7 Numerous strategies have been adopted to overcome the intrinsic drawbacks of lithium iron phosphate (LiFePO4), involving surface modification with conductive agents,8–10 decreasing the particles to nanometer sizes,11–13 doping with supervalent ions,14–16 etc. In particular, some alien ion dopants have been reported to be capable of tailoring the lattice parameters of LiFePO4 crystals and accelerating the Li-ion migration.17 Yang et al. prepared LiFe0.95M0.05PO4 samples with different doped ions M including Mg2+, Ni2+, Al3+, V3+, respectively, and found that with the dopant of V3+ the average Li–O bond length increased from 2.140 Å of undoped LiFePO4 to 2.157 Å of LiFe0.95V0.05PO4, which exhibited larger Li-ion diffusion coefficient and higher discharging capacity of 152 mA h g−1 at 0.1C and 136 mA h g−1 at 1C.18 Gao et al. investigated the rate capability of Co-doped LiFe1−xCoxPO4 (x = 0–0.020) and found that LiFe0.99Co0.01PO4 with the largest length of Li–O average bonds exhibited the best electrochemical performance of 114.8 mA h g−1 at 10C.19 Generally, it is considered that the elongation of Li–O bonds can facilitate the Li-ion migration so as to achieve high capacity and decent rate capability.
The Li-ion diffusion channels in the pristine lithium iron phosphate could be blocked by Li–Fe anti-site defects, as reflected by the atomistic modelling20,21 and experimental characterizations including aberration-corrected high-angle annular dark-field STEM,22,23 neutron and X-ray diffraction,24 etc.25,26 To eliminate the negative effect of Li–Fe anti-site defects on the electrochemical performance, the non-stoichiometric lithium iron phosphate have been synthesized recently. For example, Chen et al. prepared Li1.08FePO4 by the microwave-assisted hydrothermal method, of which the excess content of Li could inhibit the anti-site defects so as to achieve discharge capacity of 95 mA h g−1 at high rate of 10C.27 Park et al. synthesized the lithium-excess Li1.05Fe0.95PO4 by the solid-state reaction, exhibiting 50C rate capability of 78 mA h g−1 caused by the elimination of FeLi defects.28 On the other hand, there appeared the literature indicating that the non-stoichiometric lithium iron phosphate consisted of certain impurities that played a significant role in the electrochemical performance. For instance, Kang and Ceder reported that the fast ion-conducting surface phase of Li4P2O7 was responsible for the ultrafast charging and discharging performance of LiFe1−2yP1−yO4−σ (y = 0.05), which exhibited nearly 100 mA h g−1 at 60C.29 Moreover, Hu et al. prepared LiFe1+2xP1+xO4+y/C using the solid-state technique, and concluded that the non-stoichiometric sample with 6.5% Fe2P exhibited better rate performance of 73 mA h g−1 at 5C, whereas the stoichiometric sample with 4.5% insulating Li3PO4 suffered a rapid decrease of the capacity at 4C.30 So far no report has been found on the evolution of lattice parameters of the non-stoichiometric lithium iron phosphate crystals, in particular, the variance of Li–O bond length.
In this article, we prepared a series of non-stoichiometric carbon-coated lithium iron phosphate (LiFexPO4/C) by a solid-state reaction. For the first time, our work is focused on the fine modulation of Li-ion diffusion channels of non-stoichiometric lithium iron phosphate in view of the variation of crystal lattice parameters. In combination with XRD, Mössbauer, TEM, Raman etc., it is indicated that the elongated Li–O bond appears in the Fe-poor non-stoichiometric lithium iron phosphate. Besides, the content of Fe2P and the graphitization degree of carbon layer is associated with the ratio of x. Through analysing the Li-ion diffusion coefficient and the electronic conductivity, it is illustrated that the synergy effect of elongated Li–O bonds, moderate Fe2P and the graphitized carbon layer results in the high performance of non-stoichiometric LiFexPO4/C.
2. Experimental
2.1. Material preparation
Non-stoichiometric LiFexPO4/C (x = 0.96, 0.98, 1.02, 1.04) were synthesized by a solid phase reaction. As a contrast, LiFe1.0PO4/C was prepared in the same way. The starting materials of Li2CO3 (99.99%; Shanghai Aladdin Bio-Chem Technology Co., Ltd.), FeC2O4·2H2O (99.99%; Alfa Aesar), NH4H2PO4 (99.99%; Shanghai Aladdin Bio-Chem Technology Co., Ltd.), and glucose (98%; Shanghai Aladdin Bio-Chem Technology Co., Ltd.) were mixed in a mole ratio of 1![[thin space (1/6-em)]](https://www.rsc.org/images/entities/char_2009.gif) :
:![[thin space (1/6-em)]](https://www.rsc.org/images/entities/char_2009.gif) x
x![[thin space (1/6-em)]](https://www.rsc.org/images/entities/char_2009.gif) :
:![[thin space (1/6-em)]](https://www.rsc.org/images/entities/char_2009.gif) 1
1![[thin space (1/6-em)]](https://www.rsc.org/images/entities/char_2009.gif) :
:![[thin space (1/6-em)]](https://www.rsc.org/images/entities/char_2009.gif) 0.5. The glucose was used as a carbon source. In a typical preparation, the reactants were ball-milled in 20 ml of 95 wt% alcohol solution for 6 h then dried under N2 protection at 25 °C. The pale yellow sample was ground into powder then preheated at 350 °C for 10 h under an N2 atmosphere. Then the obtained black precursor powder was heated at 700 °C at a heating rate of 5 °C min−1, and held for nearly 6 h to form a crystalline phase LiFexPO4/C. Finally, the prepared powder samples were cooled down to ambient temperature and reground before use. The LiFexPO4/C samples are denoted in terms of the x value, e.g., LiFe0.96PO4/C is the sample synthesized with the Fe/Li ratio of 0.96. For all the synthesized samples, including LiFe0.96PO4/C, LiFe0.98PO4/C, LiFe1.0PO4/C, LiFe1.02PO4/C, and LiFe1.04PO4/C, the elemental compositions of Li, Fe, P were analysed by Atomic Absorption Spectrometry (AAS), chemical titration, and inductively coupled plasma emission spectrometry (ICP), respectively, as listed in Table S1 in the ESI.† It is indicated that the ratios of Li
0.5. The glucose was used as a carbon source. In a typical preparation, the reactants were ball-milled in 20 ml of 95 wt% alcohol solution for 6 h then dried under N2 protection at 25 °C. The pale yellow sample was ground into powder then preheated at 350 °C for 10 h under an N2 atmosphere. Then the obtained black precursor powder was heated at 700 °C at a heating rate of 5 °C min−1, and held for nearly 6 h to form a crystalline phase LiFexPO4/C. Finally, the prepared powder samples were cooled down to ambient temperature and reground before use. The LiFexPO4/C samples are denoted in terms of the x value, e.g., LiFe0.96PO4/C is the sample synthesized with the Fe/Li ratio of 0.96. For all the synthesized samples, including LiFe0.96PO4/C, LiFe0.98PO4/C, LiFe1.0PO4/C, LiFe1.02PO4/C, and LiFe1.04PO4/C, the elemental compositions of Li, Fe, P were analysed by Atomic Absorption Spectrometry (AAS), chemical titration, and inductively coupled plasma emission spectrometry (ICP), respectively, as listed in Table S1 in the ESI.† It is indicated that the ratios of Li![[thin space (1/6-em)]](https://www.rsc.org/images/entities/char_2009.gif) :
:![[thin space (1/6-em)]](https://www.rsc.org/images/entities/char_2009.gif) Fe
Fe![[thin space (1/6-em)]](https://www.rsc.org/images/entities/char_2009.gif) :
:![[thin space (1/6-em)]](https://www.rsc.org/images/entities/char_2009.gif) P in all the samples are approximately to the mixing ratio of individual precursor.
P in all the samples are approximately to the mixing ratio of individual precursor.
2.2. Structural and morphological characterizations
The phase composition were determined by powder XRD (Rigaku D/MAX-2500) in the 2θ range from 10° to 65° with a Cu-Kα radiation (λ = 0.154 nm) at 40 kV. The scanning step is 4° min−1. The refined structural parameters were calculated by GSAS software, which eliminated the effects of impurities. Room-temperature 57Fe Mössbauer spectra were carried out on a WissEl/MSPCA spectrometer with a 57Co γ-ray radioactive source. The transmitted photons were measured by a proportional counter. The velocity calibration was conducted with the α-Fe spectrum at room temperature.31 The morphology of the samples and the thickness of carbon layer were observed by JEM-100CX-II high-resolution transmission electron microscopy (HR-TEM) at 100 kV. Thermogravimetry (TG) analysis was obtained on a Netzsch-STA 449C thermal analyser at a heating rate of 10 °C min−1 from 25 °C to 700 °C in air to determine the carbon content. Raman spectra were obtained on Renishaw inVia reflex Raman spectrometer equipped with a 532 nm laser. The powder electronic conductivity was detected with four-point probes resistivity measurement system.
2.3. Electrochemical measurements
To test the electrochemical performance, the LiFexPO4/C powder was mixed with polyvinylidene fluoride (PVDF) and battery grade acetylene black (80![[thin space (1/6-em)]](https://www.rsc.org/images/entities/char_2009.gif) :
:![[thin space (1/6-em)]](https://www.rsc.org/images/entities/char_2009.gif) 10
10![[thin space (1/6-em)]](https://www.rsc.org/images/entities/char_2009.gif) :
:![[thin space (1/6-em)]](https://www.rsc.org/images/entities/char_2009.gif) 10 wt%) in N-methyl-pyrrolidinone under magnetic stirring for 10 h. Next, the viscous black slurry was spread onto aluminum foil then dried for 12 h at 80 °C. The cathode films were punched into 1.3 cm diameter discs after roll-pressing, and dried at 120 °C in vacuum overnight. The electrolyte was prepared by dissolving 1 M LiPF6 in the mixed solvent of ethylene carbonate (EC) and dimethyl carbonate (DMC). We assembled Li/LiFexPO4 cells with standard CR2032 coin cell hardware fittings in an argon-filled glove box with H2O and O2 content under 0.1 ppm. The pieces of LiFexPO4/C cathode were separated by Celgard 2400 from lithium metal anodes. Charge/discharge cycle performance tests were conducted on a LAND-CT2011A battery test system (Wuhan, China) in voltages of 2.0 to 4.2 V at different rates. The electrochemical impedance spectroscopic analysis (EIS) was performed on a CHI660E electrochemical analyser (CH Instruments, China) with a 0.005 V amplitude signal with the frequency range from 0.1 Hz to 100 kHz, and the data was fitted by Z-view software. The cycle voltammetry (CV) test was performed on the electrochemical analyser (CH1604A, CH Instruments, China) at the scan rate of 0.1 mV s−1.
10 wt%) in N-methyl-pyrrolidinone under magnetic stirring for 10 h. Next, the viscous black slurry was spread onto aluminum foil then dried for 12 h at 80 °C. The cathode films were punched into 1.3 cm diameter discs after roll-pressing, and dried at 120 °C in vacuum overnight. The electrolyte was prepared by dissolving 1 M LiPF6 in the mixed solvent of ethylene carbonate (EC) and dimethyl carbonate (DMC). We assembled Li/LiFexPO4 cells with standard CR2032 coin cell hardware fittings in an argon-filled glove box with H2O and O2 content under 0.1 ppm. The pieces of LiFexPO4/C cathode were separated by Celgard 2400 from lithium metal anodes. Charge/discharge cycle performance tests were conducted on a LAND-CT2011A battery test system (Wuhan, China) in voltages of 2.0 to 4.2 V at different rates. The electrochemical impedance spectroscopic analysis (EIS) was performed on a CHI660E electrochemical analyser (CH Instruments, China) with a 0.005 V amplitude signal with the frequency range from 0.1 Hz to 100 kHz, and the data was fitted by Z-view software. The cycle voltammetry (CV) test was performed on the electrochemical analyser (CH1604A, CH Instruments, China) at the scan rate of 0.1 mV s−1.
3. Results and discussion
3.1. Structural characterization
The XRD patterns (Fig. 1) present the composition of LiFexPO4/C. For LiFexPO4/C with the x value unequal to 1.0, the major peaks are located similarly to the standard orthorhombic structure of LiFe1.0PO4/C confirmed with ICPDS file (no. 81-1173) except for small peaks of some impurities. In the case of LiFe0.96PO4/C, there are peaks of the impurities of Li3PO4 and Fe2P, while other non-stoichiometric samples including LiFe0.98PO4/C, LiFe1.02PO4/C and LiFe1.04PO4/C there exist the peaks of Fe2P impurity. Table 1 lists the refined lattice parameters, cell volume V, crystal size of particles, and carbon content of LiFexPO4/C composites. The crystal size of particles were calculated according to the (311) diffraction peak in Fig. 1 by Scherrer's equation (i.e., D(311) = 0.9λ/β![[thin space (1/6-em)]](https://www.rsc.org/images/entities/char_2009.gif) cos
cos![[thin space (1/6-em)]](https://www.rsc.org/images/entities/char_2009.gif) θ).32 The average crystalline size is respectively 64.5, 68, 71, 72.3, and 75.1 nm for LiFe0.96PO4/C, LiFe0.98PO4/C, LiFe1.0PO4/C, LiFe1.02PO4/C, and LiFe1.04PO4/C, suggesting that the crystalline size decreases at lower Fe/Li ratio.
θ).32 The average crystalline size is respectively 64.5, 68, 71, 72.3, and 75.1 nm for LiFe0.96PO4/C, LiFe0.98PO4/C, LiFe1.0PO4/C, LiFe1.02PO4/C, and LiFe1.04PO4/C, suggesting that the crystalline size decreases at lower Fe/Li ratio.
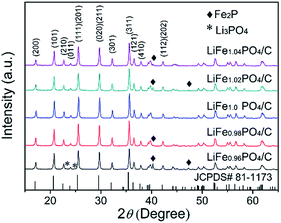 |
| | Fig. 1 XRD patterns of LiFexPO4/C. | |
Table 1 Refined lattice parameters, cell volume V and crystal size D(311) of LiFexPO4/C
| Sample |
a (Å) |
b (Å) |
c (Å) |
V (Å3) |
D(311) (nm) |
| LiFe0.96PO4/C |
10.3392 |
6.0150 |
4.7004 |
292.323 |
64.5 |
| LiFe0.98PO4/C |
10.3393 |
6.0154 |
4.7004 |
292.347 |
68 |
| LiFe1.0PO4/C |
10.3368 |
6.0141 |
4.7006 |
292.222 |
71 |
| LiFe1.02PO4/C |
10.3365 |
6.0142 |
4.7006 |
292.213 |
72.3 |
| LiFe1.04PO4/C |
10.3372 |
6.0141 |
4.7005 |
292.225 |
75.1 |
To demonstrate the variation in the local structure of LiFexPO4/C, the bond length parameters were calculated from Rietveld refinement using powder XRD data at room temperature. Fig. S1 and Table S2† present the detailed results of Rietveld refinement. To make the discussion clear, the oxygen atoms are classified into several groups according to previous literature.33 We focused on the interatomic distances around Fe and Li, displayed in Fig. 2. Table 2 lists the refined bond length parameters of LiFexPO4/C. The Li–O(1) bond length of LiFe1.0PO4/C is 2.161 Å, whereas it increases to 2.176 Å and 2.184 Å as the x value decreases to 0.98 and 0.96. Similarly, the values of Li–O(2) and Li–O(3) bond lengths rise at x values lower than 1.0. On the other hand, the bond lengths of Fe–O(1), Fe–O(2) and Fe–O(3) decrease with decreasing x values. Combining the results of Tables 1 and 2, it is demonstrated that LiFe0.96PO4/C and LiFe0.98PO4/C possess the enlarged Li–O bond length as well as the shorter diffusion distance in crystal particles in contrast to LiFe1.0PO4/C, which would be promising to achieve enhanced rate capability with improved rate of Li-ion extraction/intercalation.
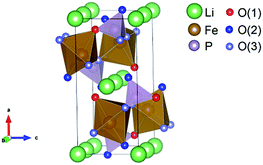 |
| | Fig. 2 Illustration of the atomic structure of LiFePO4. | |
Table 2 Refined bond length parameters of LiFexPO4/C
| Samples |
Interatomic distance (Å) |
| Fe–O(1) |
Fe–O(2) |
Fe–O(3) |
Li–O(1) |
Li–O(2) |
Li–O(3) |
| LiFe0.96PO4/C |
2.216(8) |
2.052(10) |
2.265(5) |
2.184(6) |
2.120(5) |
2.153(6) |
| LiFe0.98PO4/C |
2.209(7) |
2.066(8) |
2.271(4) |
2.176(5) |
2.102(4) |
2.139(5) |
| LiFe1.0PO4/C |
2.219(7) |
2.067(8) |
2.275(4) |
2.161(4) |
2.100(4) |
2.135(5) |
| LiFe1.02PO4/C |
2.215(7) |
2.064(8) |
2.268(4) |
2.165(5) |
2.099(4) |
2.132(5) |
| LiFe1.04PO4/C |
2.216(8) |
2.057(9) |
2.271(5) |
2.160(5) |
2.102(5) |
2.129(6) |
3.2. Mössbauer spectra
In order to determine the amount of impurity phases, the 57Fe Mössbauer spectra were carried out at room temperature. As shown in Fig. 3, all spectra curves contain two doublets which means two different iron environments in LiFexPO4/C. The green curves correspond to octahedral Fe2+ in LiFePO4, while the blue curves are due to the presence of Fe2P. For Fe2+ in LiFePO4, the isomer shift (IS) of the green symmetrical doublet is 1.23 mm s−1, and the quadrupole splitting (QS) is 2.99 mm s−1. Compared to the IS and QS values in previous literature, the parameters of the blue doublet are similar to that of Fe3+ at 3f site in Fe2P,34,35 which is formed due to the following carbonthermal reduction:| | |
6LiFePO4 + 8C → 3Fe2P + 2Li3PO4 + P↑ + 8CO2↑
| (1) |
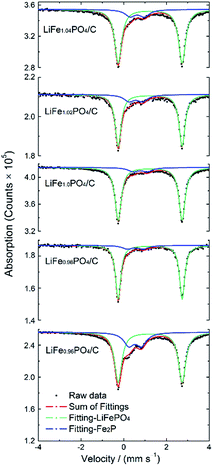 |
| | Fig. 3 Mössbauer spectra of LiFexPO4/C. | |
Table 3 lists the Mössbauer parameters and the percentage of iron in different environments. When every mole of Fe2P is generated, there appears 2/3 mole of Li3PO4 according to eqn (1). In order to obtain the accurate content of Fe2P, the fraction of Li3PO4 should be taken into account. The weight and mole percent of Fe2P, Li3PO4 and LiFePO4 in LiFexPO4/C samples are listed in Table 4. The calculated weight ratio of Fe2P is 12.82 wt% for LiFe0.96PO4/C, 5.34 wt% for LiFe0.98PO4/C, 4.95 wt% for LiFe1.0PO4/C, 8.36 wt% for LiFe1.02PO4/C and 9.32 wt% for LiFe1.04PO4/C. Because 57Fe Mössbauer spectra are highly sensitive to detect both crystalline and non-crystalline phases, the results indicate the existence of small amount of Fe2P impurity in LiFe1.0PO4/C, although the peak is not detectable in XRD pattern. Previously, Fe2P was reported to have an amphoteric effect on the electrochemical properties of LiFePO4, suggesting that Fe2P can only serve an electronic conductive function when its concentration is maintained below a critical value.36 Compared to LiFe1.0PO4/C, the excessive Fe2P in LiFe1.02PO4/C and LiFe1.04PO4/C would probably block the one-dimensional diffusion channel and reduce the Li-ion mobility, leading to the degradation of the rate capability and cycle performance, which can be deduced in LiFe0.96PO4/C in the same way.
Table 3 57Fe Mössbauer spectra and fitted data for LiFexPO4/C
| Samples |
Fe3+ in Fe2P |
Fe2+ in LiFePO4 |
| IS (mm s−1) |
QS (mm s−1) |
Γ (FWHM) |
mol% |
IS (mm s−1) |
QS (mm s−1) |
Γ (FWHM) |
mol% |
| LiFe0.96PO4/C |
0.5345 |
0.5927 |
0.582 |
26.1 |
1.2377 |
2.9951 |
0.408 |
73.9 |
| LiFe0.98PO4/C |
0.5474 |
0.7505 |
0.582 |
11.4 |
1.2369 |
2.9954 |
0.292 |
88.6 |
| LiFe1.0PO4/C |
0.7761 |
0.6655 |
0.582 |
10.6 |
1.2367 |
2.9914 |
0.355 |
89.4 |
| LiFe1.02PO4/C |
0.5682 |
0.6364 |
0.582 |
17.5 |
1.2370 |
2.9937 |
0.338 |
82.5 |
| LiFe1.04PO4/C |
0.6338 |
0.6660 |
0.582 |
19.4 |
1.2371 |
2.9936 |
0.394 |
80.6 |
Table 4 The weight and mole percent of Fe2P, Li3PO4 and LiFePO4 in LiFexPO4/C
| Samples |
Fe2P |
Li3PO4 |
LiFePO4 |
| wt% |
mol% |
wt% |
mol% |
wt% |
mol% |
| LiFe0.96PO4/C |
12.82 |
13.60 |
6.94 |
9.09 |
80.24 |
77.31 |
| LiFe0.98PO4/C |
5.34 |
5.84 |
2.89 |
3.87 |
91.77 |
90.29 |
| LiFe1.0PO4/C |
4.95 |
5.39 |
2.68 |
3.59 |
92.37 |
91.02 |
| LiFe1.02PO4/C |
8.36 |
9.01 |
4.52 |
6.01 |
87.12 |
84.98 |
| LiFe1.04PO4/C |
9.32 |
10.02 |
5.04 |
6.68 |
85.64 |
83.30 |
3.3. Morphological characterization
Fig. 4 displays the HR-TEM images of the LiFexPO4/C samples. It is indicated that all of the samples consist of similar spherical particles with the particle size distribution around 30–100 nm (Fig. 4(a)–(e)). Some flocculent carbon structure appear between particles, which provide a larger contact area on the particle–particle and electrode–electrolyte interface, alleviating the diffusion limitation problems. The thickness of the amorphous carbon coating layer varies between 5–10 nm (Fig. 4(f)–(j)), contributing to improve the electronic conductivity. The carbon content measured by TG analysis are 13.21 wt%, 14.59 wt%, 14.18 wt%, 12.99 wt% and 12.77 wt% for LiFe0.96PO4/C, LiFe0.98PO4/C, LiFe1.0PO4/C, LiFe1.02PO4/C, and LiFe1.04PO4/C, respectively (Table S3 and Fig. S2†).
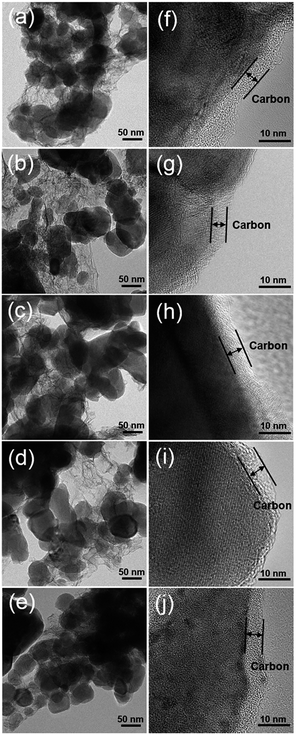 |
| | Fig. 4 TEM images of LiFe0.96PO4/C (a) and (f), LiFe0.98PO4/C (b) and (g), LiFe1.0PO4/C (c) and (h), LiFe1.02PO4/C (d) and (i), and LiFe1.04PO4/C (e) and (j). | |
3.4. Raman spectra
Aiming to clarify the conductivity contribution of the carbon layer, Raman spectra were adopted to investigate the degree of carbon disorder on the surface of LiFexPO4/C. As Fig. 5 shows, the two dominant peaks around 1350 cm−1 and 1580 cm−1 represent disorder (D) band and graphitic (G) band, respectively.37 The D band is characteristic of the disordered structure ascribed to the breathing vibration at the boundary of graphene sheet, whereas the G band is corresponding to bond stretching of the graphitized carbon atoms.38 Graphitized carbon is known to possess better electronic conductivity than disordered carbon. Generally, the peak intensity ratio (ID/IG) is used to indicate the graphitization of the carbon layers. As listed in Table 5, the LiFe0.98PO4/C shows relatively higher degree of graphitization than the others.
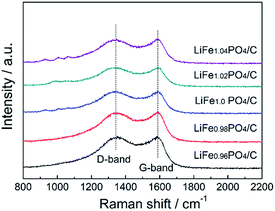 |
| | Fig. 5 Raman spectra of LiFexPO4/C. | |
Table 5 ID/IG values of LiFexPO4/C
| Samples |
ID/IG |
| LiFe0.96PO4/C |
0.993 |
| LiFe0.98PO4/C |
0.986 |
| LiFe1.0PO4/C |
0.998 |
| LiFe1.02PO4/C |
0.994 |
| LiFe1.04PO4/C |
1.001 |
3.5. Electrochemical characterizations
Fig. 6 shows the electrochemical performances of LiFexPO4/C samples. Fig. 6(a) presents the profiles of initial charge/discharge capacity versus potential from 2.2 V to 4.2 V at 0.1C. The flat voltage plateaus from 3.39 V to 3.46 V correspond to the redox reaction between LiFePO4 and FePO4.39,40 From the result of Fig. 6(a), the discharge capacities of LiFe0.96PO4/C, LiFe0.98PO4/C, LiFe1.0PO4/C, LiFe1.02PO4/C, and LiFe1.04PO4/C are 157.7 mA h g−1, 163.5 mA h g−1, 153.7 mA h g−1, 148 mA h g−1, and 143.5 mA h g−1, respectively. The corresponding coulombic efficiencies are calculated as 95.9%, 96.3%, 94.3%, 94.3% and 95%. Furthermore, the rate capability of LiFexPO4/C are illustrated with five cycles at every rates of 0.1C, 1C, 2C, 5C, 10C and 20C in Fig. 6(b), indicating the superior performance of LiFe0.98PO4/C. The loading amount of the active material in the each cathode are 1.07, 1.07, 1.02, 1.06 and 1.08 mg cm−2 for LiFe0.96PO4/C, LiFe0.98PO4/C, LiFe1.0PO4/C, LiFe1.02PO4/C, and LiFe1.04PO4/C, respectively. As Fig. 6(c) shows, all of the LiFexPO4/C samples demonstrate excellent cycle performance at 20C. The capacity retention rates after 100 cycles are 98.8%, 99.2%, 98.7%, 97.4% and 90.2%, respectively. In particular, LiFe0.98PO4/C retains 90.9% capacity even after 500 cycles, as shown in Fig. 6(d). It is illustrated that Fe-poor LiFe0.98PO4/C exhibits the outstanding discharge capacity, coulombic efficiency and rate capability, which could be attributed to the faster Li-ion migration and enhanced electronic conductivity originated from the elongated Li–O bond lengths, appropriate content of Fe2P and highly graphitized carbon layer on the grain surface. Although LiFe0.96PO4/C has the longest Li–O bond length (Table 2), too much content of Fe2P blocks the Li-ion diffusion pathways and hinders Li-ion movement, resulting in an inferior discharge capacity of LiFe0.96PO4/C comparing with LiFe0.98PO4/C.
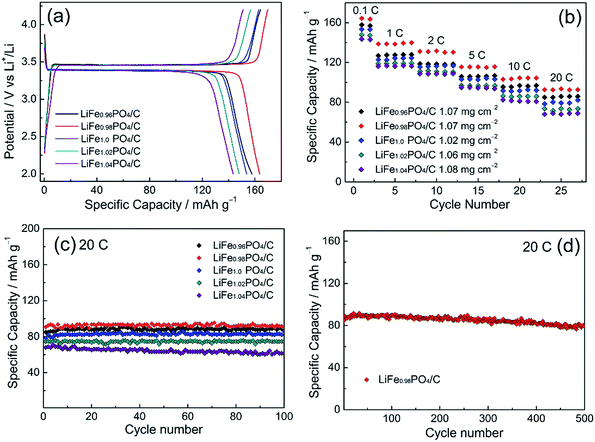 |
| | Fig. 6 Electrochemical performance of LiFexPO4/C: (a) initial charge/discharge curves at 0.1C; (b) the multi-rate capability and cycle performance; (c) performance within 100 cycles at 20C and (d) 500-cycle performance for LiFe0.98PO4/C at 20C. | |
The first-around CVs profiles of LiFexPO4/C are shown in Fig. 7(a). It can be seen that all the CV curves consist of distinct anodic peaks and cathode peaks, corresponding to the extraction and insertion process of Li ions, respectively. Among them, LiFe0.98PO4/C shows the sharpest redox peaks, implying the superior electrode kinetics. According to the CV curves, it is indicated that the peak potential difference between anodic and cathode peak is 0.145 V for LiFe0.98PO4/C, 0.171 V for LiFe0.96PO4/C, 0.187 V for LiFe1.0PO4/C, 0.201 V for LiFe1.02PO4/C, 0.263 V for LiFe1.04PO4/C, respectively. Thus, LiFe0.98PO4/C exhibits the smallest value of the potential interval and the highest peak current in CV curves, suggesting an enhanced electrode reaction reversibility and a better rate capability, which is consistent with the electrochemical performance shown in Fig. 6.
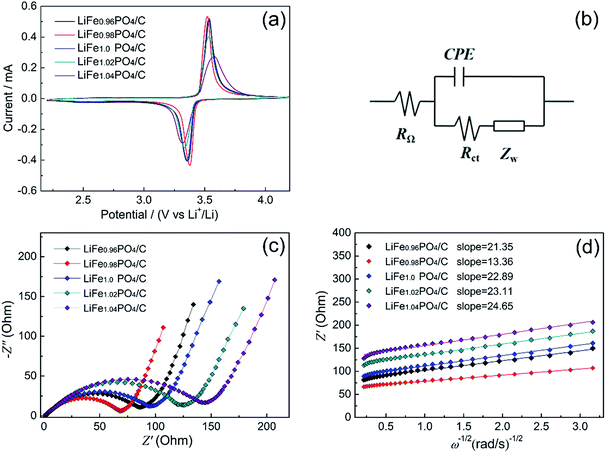 |
| | Fig. 7 (a) Cyclic voltammograms of the LiFexPO4/C at the scan rate of 0.1 mV s−1; (b) equivalent circuit model; (c) Nyquist plots of the LiFexPO4/C samples; (d) the relationship between Z′ and the reciprocal square root of the angular frequency (ω−1/2). | |
The electrode reaction dynamics and Li-ion diffusion characteristics of LiFexPO4/C were studied by electrochemical impedance spectroscopy (EIS). Fig. 7(b) displays the concise equivalent circuit model applied to analyse the impedance spectra which is shown in Fig. 7(c). Here, RΩ refers to the ohmic resistance of electrolyte presented as intercept on the abscissa axis at high frequency. The component CPE (constant phase angle element) reflects the impedance caused by irregular surface structure and energy barrier at mass and charge transfer.41 The Rct component represents the charge transfer resistance appearing in electrochemical reactions, which includes the resistances derived from particle–particle and electrolyte–electrode contacts, and exhibits as a semicircle within the medium frequency region. The Warburg impedance ZW is associated with the diffusion kinetics of Li ions in the crystal lattice, corresponding to the inclined line in the low frequency. Furthermore, the Li-ion diffusion coefficient D for each sample can be computed as follows:42
where
R refers to the gas constant (8.314 J mol
−1 K
−1),
T is the absolute temperature (298 K),
A is the surface area of the cathode,
n represents the number of electrons per molecule during oxidation,
F is the Faraday constant (96
![[thin space (1/6-em)]](https://www.rsc.org/images/entities/char_2009.gif)
485.333C mol
−1),
C is the concentration of Li ions, and
σ represents the Warburg factor connected with
Z′:
| | |
Z′ = RD + RL + σω−1/2
| (3) |
where
RD and
RL are the resistance of charge transfer and solution resistance, respectively, and
σ is the angular frequency (2π
f).
Fig. 7(d) reflects the relationship between
Z′ and
ω−1/2 in the low-frequency region. The slopes of the individual lines are the outcome of linear least squares fitting, and the scattered points represent the experimental values. The values of
D for Li ions in the samples are calculated according to the slope parameters in
Fig. 7(d) and
eqn (2) and
(3). In addition, the powder electronic conductivity were detected by four-point probe methods. Both the simulated and calculated parameters and the value of electronic conductivity of LiFe
xPO
4/C samples are listed in
Table 6.
Table 6 The fitting results of the data given in Fig. 7 using sectionalized simulation and the powder electronic conductivity of LiFexPO4/C detected by four-point probe method
| Sample |
RΩ (Ω cm2) |
Rct (Ω) |
DLi+ (× 10−14 cm2 s−1) |
Electronic conductivity (10−2 S cm−1) |
| LiFe0.96PO4/C |
1.077 |
88.85 |
8.48 |
7.69 |
| LiFe0.98PO4/C |
1.866 |
68.78 |
12.6 |
16.67 |
| LiFe1.0PO4/C |
1.582 |
101.6 |
7.38 |
14.29 |
| LiFe1.02PO4/C |
1.700 |
130.2 |
7.24 |
9.09 |
| LiFe1.04PO4/C |
1.209 |
152.3 |
6.36 |
8.33 |
Obviously, Rct decreases according to the Fe/Li ratio in descending order, except for LiFe0.98PO4/C, which shows the lowest charge transfer resistance of 68.78 Ω and the highest electronic conductivity of 16.67 × 10⁻² S cm−1. It can be ascribed to the moderate Fe2P and superior graphitization degree of carbon layer. In addition, it was reported that the increase of active sites was represented by a decreasing semicircle diameter and increasing frequency at which the sloping line begins.43 Here, the EIS data suggest the reason for the better cycle stability and electrochemical performance observed for the LiFe0.98PO4/C sample, which exhibits the smallest semicircle diameter. The exchange current density io is obtained from Rct using eqn (4):
where
n is the charge transfer number per molecule during intercalation. The value of
io obtained for the LiFe
0.98PO
4/C sample is 0.37 mA, which is higher than 0.29 mA for LiFe
0.96PO
4/C, 0.25 mA for LiFe
1.0PO
4/C, 0.19 mA for LiFe
1.02PO
4/C and 0.17 mA for LiFe
1.04PO
4/C.
In general, the value of exchange current density is associated with the reversibility of electrode.44 LiFe0.98PO4/C exhibits the higher current density than any of others, which coincides with the optimal battery performance. As shown in Table 6, the value of D for Li ions in the LiFe0.98PO4/C sample is calculated as 12.6 × 10⁻¹⁴ cm2 s−1, which is considerably greater than the values of other samples, which is 8.48 × 10⁻¹⁴, 7.38 × 10⁻¹⁴, 7.24 × 10⁻¹⁴ and 6.36 × 10⁻¹⁴ cm2 s−1 for LiFe0.96PO4/C, LiFe1.0PO4/C LiFe1.02PO4/C and LiFe1.04PO4/C, respectively. Thus, it is reasonable to conclude that the enlarged Li–O bond lengths in non-stoichiometric Fe-poor LiFe0.98PO4/C result in the accelerated Li-ion migration through the LiFePO4 bulk and electrode–electrolyte interface via enhanced Li-ion intercalation/de-intercalation processes, consequently achieving the high electrochemical performance.
4. Conclusions
Non-stoichiometric LiFexPO4/C (x = 0.96, 0.98, 1.02, 1.04) cathode materials have been synthesized by a simple solid-state reaction. Based on the refined lattice parameters, it is indicated that the Fe-poor samples possess the enlarged Li–O bond lengths, facilitating the Li-ion migration. Moreover, Mössbauer spectra show that the content of Fe2P impurity is related to Fe/Li ratio, which enhances the conductivity at low concentration. The graphitization degree of carbon is slightly elevated with high content of carbon. Due to the enlarged Li–O bond length, proper content of Fe2P impurity and relatively high graphitization degree of carbon layer, the Li-ion diffusivity and electronic conductivity of LiFe0.98PO4/C are superior to other non-stoichiometric samples. The synergy effect of these factors makes LiFe0.98PO4/C exhibit the highest discharge capacity, rate capability, as well as excellent cycle performance. The disclosed relationship among the crystal lattice parameters, the composition and the electrochemical performance of non-stoichiometric LiFexPO4/C provides a pathway to design new material of other type olivine phosphate so as to improve the electrochemical performance.
Acknowledgements
This work was financially supported by the National Natural Science Foundation of China (No. 21476158, 21621004), and Program for Changjiang Scholars and Innovative Research Team in University (No. IRT_15R46).
Notes and references
- A. Padhi, K. Nanjundaswamy, C. Masquelier, S. Okada and J. Goodenough, J. Electrochem. Soc., 1997, 144, 1609–1613 CrossRef CAS.
- L.-X. Yuan, Z.-H. Wang, W.-X. Zhang, X.-L. Hu, J.-T. Chen, Y.-H. Huang and J. B. Goodenough, Energy Environ. Sci., 2011, 4, 269–284 CAS.
- G. Pagot, F. Bertasi, G. Nawn, E. Negro, G. Carraro, D. Barreca, C. Maccato, S. Polizzi and V. Di Noto, Adv. Funct. Mater., 2015, 25, 4032–4037 CrossRef CAS.
- F. Yu, L. Zhang, Y. Li, Y. An, M. Zhu and B. Dai, RSC Adv., 2014, 4, 54576–54602 RSC.
- Z. Yang, Y. Dai, S. Wang and J. Yu, J. Mater. Chem. A, 2016, 4, 18210–18222 CAS.
- M. M. Thackeray, C. Wolverton and E. D. Isaacs, Energy Environ. Sci., 2012, 5, 7854–7863 CAS.
- J. B. Goodenough and K. S. Park, J. Am. Chem. Soc., 2013, 135, 1167–1176 CrossRef CAS PubMed.
- J. Zhang, N. Nie, Y. Liu, J. Wang, F. Yu, J. Gu and W. Li, ACS Appl. Mater. Interfaces, 2015, 7, 20134–20143 CAS.
- Z. Jinli, W. Jiao, L. Yuanyuan, N. Ning, G. Junjie, Y. Feng and L. Wei, J. Mater. Chem. A, 2015, 3, 2043–2049 Search PubMed.
- Y. Liu, J. Gu, J. Zhang, F. Yu, J. Wang, N. Nie and W. Li, RSC Adv., 2015, 5, 9745–9751 RSC.
- Y. Liu, J. Gu, J. Zhang, J. Wang, N. Nie, Y. Fu, W. Li and F. Yu, Electrochim. Acta, 2015, 173, 448–457 CrossRef CAS.
- D. Rangappa, K. Sone, T. Kudo and I. Honma, J. Power Sources, 2010, 195, 6167–6171 CrossRef CAS.
- J. Lee and A. S. Teja, Mater. Lett., 2006, 60, 2105–2109 CrossRef CAS.
- A. Moretti, G. Giuli, F. Nobili, A. Trapananti, G. Aquilanti, R. Tossici and R. Marassi, J. Electrochem. Soc., 2013, 160, A940–A949 CrossRef CAS.
- D. Jang, K. Palanisamy, J. Yoon, Y. Kim and W.-S. Yoon, J. Power Sources, 2013, 244, 581–585 CrossRef CAS.
- S. Novikova, S. Yaroslavtsev, V. Rusakov, A. Chekannikov, T. Kulova, A. Skundin and A. Yaroslavtsev, J. Power Sources, 2015, 300, 444–452 CrossRef CAS.
- R. Qing, M.-C. Yang, Y. S. Meng and W. Sigmund, Electrochim. Acta, 2013, 108, 827–832 CrossRef CAS.
- M.-R. Yang and W.-H. Ke, J. Electrochem. Soc., 2008, 155, A729–A732 CrossRef CAS.
- H. Gao, L. Jiao, J. Yang, Z. Qi, Y. Wang and H. Yuan, Electrochim. Acta, 2013, 97, 143–149 CrossRef CAS.
- C. A. J. Fisher, V. M. H. Prieto and M. S. Islam, Chem. Mater., 2008, 20, 5907–5915 CrossRef CAS.
- M. S. Islam, D. J. Driscoll, C. A. J. Fisher and P. R. Slater, Chem. Mater., 2005, 17, 5085–5092 CrossRef CAS.
- S. Y. Chung, S. Y. Choi, T. Yamamoto and Y. Ikuhara, Phys. Rev. Lett., 2008, 100, 125502 CrossRef PubMed.
- S.-Y. Chung, Y.-M. Kim and S.-Y. Choi, Adv. Funct. Mater., 2010, 20, 4219–4232 CrossRef CAS.
- S.-P. Badi, M. Wagemaker, B. L. Ellis, D. P. Singh, W. J. H. Borghols, W. H. Kan, D. H. Ryan, F. M. Mulder and L. F. Nazar, J. Mater. Chem., 2011, 21, 10085 RSC.
- S. Yang, Y. Song, P. Y. Zavalij and M. S. Whittingham, Electrochem. Commun., 2002, 4, 239–244 CAS.
- P. Axmann, C. Stinner, M. Wohlfahrt-Mehrens, A. Mauger, F. Gendron and C. M. Julien, Chem. Mater., 2009, 21, 1636–1644 CrossRef CAS.
- R. Chen, X. Wang and X. Kong, Mater. Lett., 2014, 120, 76–78 CrossRef CAS.
- K. Y. Park, I. Park, H. Kim, G. Yoon, H. Gwon, Y. Cho, Y. S. Yun, J. J. Kim, S. Lee and D. Ahn, Energy Environ. Sci., 2016, 9, 2902–2915 Search PubMed.
- B. Kang and G. Ceder, Nature, 2009, 458, 190–193 CrossRef CAS PubMed.
- C. Hu, H. Yi, H. Fang, B. Yang, Y. Yao, W. Ma and Y. Dai, Mater. Lett., 2011, 65, 1323–1326 CrossRef CAS.
- X. Li, L. Yuan, J. Wang, L. Jiang, A. I. Rykov, D. L. Nagy, C. Bogdan, M. A. Ahmed, K. Zhu, G. Sun and W. Yang, Nanoscale, 2016, 8, 2333–2342 RSC.
- H. Shang, W. Chu, J. Cheng, F. Pan, D. Cheng, D. Xia, W. Wang and Z. Wu, J. Mater. Chem. A, 2013, 1, 6635–6641 CAS.
- N. Meethong, Y.-H. Kao, S. A. Speakman and Y.-M. Chiang, Adv. Funct. Mater., 2009, 19, 1060–1070 CrossRef CAS.
- K. S. Dhindsa, A. Kumar, G. A. Nazri, V. M. Naik, V. K. Garg, A. C. Oliveira, P. P. Vaishnava, Z. X. Zhou and R. Naik, J. Solid State Electrochem., 2016, 20, 2275–2282 CrossRef CAS.
- Y.-H. Rho, L. F. Nazar, L. Perry and D. Ryan, J. Electrochem. Soc., 2007, 154, A283–A289 CrossRef CAS.
- M.-S. Song, D.-Y. Kim, Y.-M. Kang, Y.-I. Kim, J.-Y. Lee and H.-S. Kwon, J. Power Sources, 2008, 180, 546–552 CrossRef CAS.
- J. Zhu, K. Yoo, I. El-Halees and D. Kisailus, ACS Appl. Mater. Interfaces, 2014, 6, 21550–21557 CAS.
- K. F. Hsu, S. Y. Tsay and B. J. Hwang, J. Mater. Chem., 2004, 14, 2690–2695 RSC.
- B. Wang, Y. Qiu and L. Yang, Electrochem. Commun., 2006, 8, 1801–1805 CrossRef CAS.
- Y. Xia, W. Zhang, H. Huang, Y. Gan, J. Tian and X. Tao, J. Power Sources, 2011, 196, 5651–5658 CrossRef CAS.
- M. Lebrini, M. Lagrenée, H. Vezin, M. Traisnel and F. Bentiss, Corros. Sci., 2007, 49, 2254–2269 CrossRef CAS.
- H. Liu, C. Li, H. P. Zhang, L. J. Fu, Y. P. Wu and H. Q. Wu, J. Power Sources, 2006, 159, 717–720 CrossRef CAS.
- J. Molenda, W. Ojczyk and J. Marzec, J. Power Sources, 2007, 174, 689–694 CrossRef CAS.
- H. Shu, X. Wang, W. Wen, Q. Liang, X. Yang, Q. Wei, B. Hu, L. Liu, X. Liu, Y. Song, M. Zho, Y. Bai, L. Jiang, M. Chen, S. Yang, J. Tan, Y. Liao and H. Jiang, Electrochim. Acta, 2013, 89, 479–487 CrossRef CAS.
Footnote |
| † Electronic supplementary information (ESI) available: The detailed results of Rietveld refinement, TG measurement and element analysis of LiFexPO4/C. See DOI: 10.1039/c7ra04510g |
|
| This journal is © The Royal Society of Chemistry 2017 |
Click here to see how this site uses Cookies. View our privacy policy here.  Open Access Article
 d,
Jinli Zhangac,
Ning Niea and
Wei Li
 *a
*a
![[thin space (1/6-em)]](https://www.rsc.org/images/entities/char_2009.gif) :
:![[thin space (1/6-em)]](https://www.rsc.org/images/entities/char_2009.gif) x
x![[thin space (1/6-em)]](https://www.rsc.org/images/entities/char_2009.gif) :
:![[thin space (1/6-em)]](https://www.rsc.org/images/entities/char_2009.gif) 1
1![[thin space (1/6-em)]](https://www.rsc.org/images/entities/char_2009.gif) :
:![[thin space (1/6-em)]](https://www.rsc.org/images/entities/char_2009.gif) 0.5. The glucose was used as a carbon source. In a typical preparation, the reactants were ball-milled in 20 ml of 95 wt% alcohol solution for 6 h then dried under N2 protection at 25 °C. The pale yellow sample was ground into powder then preheated at 350 °C for 10 h under an N2 atmosphere. Then the obtained black precursor powder was heated at 700 °C at a heating rate of 5 °C min−1, and held for nearly 6 h to form a crystalline phase LiFexPO4/C. Finally, the prepared powder samples were cooled down to ambient temperature and reground before use. The LiFexPO4/C samples are denoted in terms of the x value, e.g., LiFe0.96PO4/C is the sample synthesized with the Fe/Li ratio of 0.96. For all the synthesized samples, including LiFe0.96PO4/C, LiFe0.98PO4/C, LiFe1.0PO4/C, LiFe1.02PO4/C, and LiFe1.04PO4/C, the elemental compositions of Li, Fe, P were analysed by Atomic Absorption Spectrometry (AAS), chemical titration, and inductively coupled plasma emission spectrometry (ICP), respectively, as listed in Table S1 in the ESI.† It is indicated that the ratios of Li
0.5. The glucose was used as a carbon source. In a typical preparation, the reactants were ball-milled in 20 ml of 95 wt% alcohol solution for 6 h then dried under N2 protection at 25 °C. The pale yellow sample was ground into powder then preheated at 350 °C for 10 h under an N2 atmosphere. Then the obtained black precursor powder was heated at 700 °C at a heating rate of 5 °C min−1, and held for nearly 6 h to form a crystalline phase LiFexPO4/C. Finally, the prepared powder samples were cooled down to ambient temperature and reground before use. The LiFexPO4/C samples are denoted in terms of the x value, e.g., LiFe0.96PO4/C is the sample synthesized with the Fe/Li ratio of 0.96. For all the synthesized samples, including LiFe0.96PO4/C, LiFe0.98PO4/C, LiFe1.0PO4/C, LiFe1.02PO4/C, and LiFe1.04PO4/C, the elemental compositions of Li, Fe, P were analysed by Atomic Absorption Spectrometry (AAS), chemical titration, and inductively coupled plasma emission spectrometry (ICP), respectively, as listed in Table S1 in the ESI.† It is indicated that the ratios of Li![[thin space (1/6-em)]](https://www.rsc.org/images/entities/char_2009.gif) :
:![[thin space (1/6-em)]](https://www.rsc.org/images/entities/char_2009.gif) Fe
Fe![[thin space (1/6-em)]](https://www.rsc.org/images/entities/char_2009.gif) :
:![[thin space (1/6-em)]](https://www.rsc.org/images/entities/char_2009.gif) P in all the samples are approximately to the mixing ratio of individual precursor.
P in all the samples are approximately to the mixing ratio of individual precursor.
![[thin space (1/6-em)]](https://www.rsc.org/images/entities/char_2009.gif) :
:![[thin space (1/6-em)]](https://www.rsc.org/images/entities/char_2009.gif) 10
10![[thin space (1/6-em)]](https://www.rsc.org/images/entities/char_2009.gif) :
:![[thin space (1/6-em)]](https://www.rsc.org/images/entities/char_2009.gif) 10 wt%) in N-methyl-pyrrolidinone under magnetic stirring for 10 h. Next, the viscous black slurry was spread onto aluminum foil then dried for 12 h at 80 °C. The cathode films were punched into 1.3 cm diameter discs after roll-pressing, and dried at 120 °C in vacuum overnight. The electrolyte was prepared by dissolving 1 M LiPF6 in the mixed solvent of ethylene carbonate (EC) and dimethyl carbonate (DMC). We assembled Li/LiFexPO4 cells with standard CR2032 coin cell hardware fittings in an argon-filled glove box with H2O and O2 content under 0.1 ppm. The pieces of LiFexPO4/C cathode were separated by Celgard 2400 from lithium metal anodes. Charge/discharge cycle performance tests were conducted on a LAND-CT2011A battery test system (Wuhan, China) in voltages of 2.0 to 4.2 V at different rates. The electrochemical impedance spectroscopic analysis (EIS) was performed on a CHI660E electrochemical analyser (CH Instruments, China) with a 0.005 V amplitude signal with the frequency range from 0.1 Hz to 100 kHz, and the data was fitted by Z-view software. The cycle voltammetry (CV) test was performed on the electrochemical analyser (CH1604A, CH Instruments, China) at the scan rate of 0.1 mV s−1.
10 wt%) in N-methyl-pyrrolidinone under magnetic stirring for 10 h. Next, the viscous black slurry was spread onto aluminum foil then dried for 12 h at 80 °C. The cathode films were punched into 1.3 cm diameter discs after roll-pressing, and dried at 120 °C in vacuum overnight. The electrolyte was prepared by dissolving 1 M LiPF6 in the mixed solvent of ethylene carbonate (EC) and dimethyl carbonate (DMC). We assembled Li/LiFexPO4 cells with standard CR2032 coin cell hardware fittings in an argon-filled glove box with H2O and O2 content under 0.1 ppm. The pieces of LiFexPO4/C cathode were separated by Celgard 2400 from lithium metal anodes. Charge/discharge cycle performance tests were conducted on a LAND-CT2011A battery test system (Wuhan, China) in voltages of 2.0 to 4.2 V at different rates. The electrochemical impedance spectroscopic analysis (EIS) was performed on a CHI660E electrochemical analyser (CH Instruments, China) with a 0.005 V amplitude signal with the frequency range from 0.1 Hz to 100 kHz, and the data was fitted by Z-view software. The cycle voltammetry (CV) test was performed on the electrochemical analyser (CH1604A, CH Instruments, China) at the scan rate of 0.1 mV s−1.
![[thin space (1/6-em)]](https://www.rsc.org/images/entities/char_2009.gif) cos
cos![[thin space (1/6-em)]](https://www.rsc.org/images/entities/char_2009.gif) θ).32 The average crystalline size is respectively 64.5, 68, 71, 72.3, and 75.1 nm for LiFe0.96PO4/C, LiFe0.98PO4/C, LiFe1.0PO4/C, LiFe1.02PO4/C, and LiFe1.04PO4/C, suggesting that the crystalline size decreases at lower Fe/Li ratio.
θ).32 The average crystalline size is respectively 64.5, 68, 71, 72.3, and 75.1 nm for LiFe0.96PO4/C, LiFe0.98PO4/C, LiFe1.0PO4/C, LiFe1.02PO4/C, and LiFe1.04PO4/C, suggesting that the crystalline size decreases at lower Fe/Li ratio.

![[thin space (1/6-em)]](https://www.rsc.org/images/entities/char_2009.gif) 485.333C mol−1), C is the concentration of Li ions, and σ represents the Warburg factor connected with Z′:
485.333C mol−1), C is the concentration of Li ions, and σ represents the Warburg factor connected with Z′:


