
 Open Access Article
 This Open Access Article is licensed under a
 Creative Commons Attribution 3.0 Unported Licence
New instrumentation for large-scale quantitative analysis of components spanning a wide polarity range by column-switching hydrophilic interaction chromatography-turbulent flow chromatography-reversed phase liquid chromatography-tandem mass spectrometry†
Qingqing Songa,
Yunfang Zhaoa,
Xiaojia Chenb,
Jun Lia,
Peng Lib,
Yong Jiangc,
Yitao Wangb,
Yuelin Song *a and
Pengfei Tu*a
*a and
Pengfei Tu*a
aModern Research Center for Traditional Chinese Medicine, School of Chinese Materia Medica, Beijing University of Chinese Medicine, Beijing 100029, China. E-mail: pengfeitu@163.com; syltwc2005@163.com; Fax: +86-10-8280-2750; Fax: +86-10-6428-6100; Tel: +86-10-8280-2750 Tel: +86-10-6428-6100
bState Key Laboratory of Quality Research in Chinese Medicine, Institute of Chinese Medical Sciences, University of Macau, Taipa 999078, Macao
cState Key Laboratory of Natural and Biomimetic Drugs, School of Pharmaceutical Sciences, Peking University, Beijing 100191, China
First published on 21st June 2017
Abstract
The achievement of satisfactory chromatographic performance for every component regardless of the polarity plays a pivotal role in large-scale targeted metabolomics of complicated matrices; however, it is almost impossible to achieve comprehensive retention of all hydrophilic and hydrophobic substances by solely employing either hydrophilic interaction chromatography (HILIC) or reversed-phase liquid chromatography (RPLC). Given the great complementarity between HILIC and RPLC, we attempted herein to find a superior instrumentation scheme for their online hyphenation. New instrumentation, namely column-switching HILIC-turbulent flow chromatography-RPLC-tandem mass spectrometry (HILIC-TFC-RPLC-MS/MS) was firstly constructed by employing five solvent pumps, two electronic 6-port/2-channel valves, three columns including an Amide-type HILIC column, an HSS T3-type RP column along with a TFC column, a hybrid triple quadrupole-linear ion trap mass spectrometer (Qtrap-MS), as well as some other essential units. Each analytical run was automatically fragmented into loading (0–4 min) and parallel elution (4–32 min) phases via switching both valves. The TFC column was in charge of trapping apolar compounds from the diluted effluent of the Amide column within the loading phase and subsequently transmitting them into the HSS T3 column according to back-flushing in the parallel elution phase. Chromatographic separations of hydrophobic substances were accomplished on the HSS T3 column, whereas the Amide column took the load of separating the other substances. Qtrap-MS always received both eluents from the HILIC and RP columns. Three existing hyphenated HILIC-RPLC schemes, such as serially coupled RPLC-HILIC, guard column-(HILIC/RPLC), and HILIC-trapping column-RPLC, were involved for comparisons. With the assignment of an optimized elution program for each scheme, HILIC-TFC-RPLC-MS/MS was slightly better than the other ones for large-scale monitoring of polar and apolar components in a mimic compound pool containing 100 components. Above all, the integrated HILIC-TFC-RPLC-MS/MS platform can serve as a feasible choice to gain a holistic view regarding both hydrophilic and hydrophobic components in complicated matrices.
1. Introduction
The universal acquisition of quantitative information for both hydrophilic and hydrophobic compounds in complicated matrices serves a key role for the accomplishment of large-scale targeted metabolomics;1 however, it is a great challenge to find a viable analytical tool to simultaneously and sensitively monitor a large array of components regardless of the polarity. Liquid chromatography-tandem mass spectrometry (LC-MS/MS) is favored by metabolomics scientists from all over the world because of its merits in terms of simple sample preparation, sensitive detection, high throughput, and great metabolite coverage in comparison with gas chromatography-tandem mass spectrometry (GC-MS/MS) and/or nuclear magnetic resonance (NMR) spectroscopy. Regarding the MS domain, we have proposed a practical work-flow to gain quasi-concentrations for primary analytes in the complicated matrices.2 In the LC domain, however, it is still challenging to comprehensively retain both polar and apolar substances on a single column, although vast cutting-edge technologies have been developed to prompt the chromatographic performances, such as core–shell type particles,3 sub-micron particles4 and monolithic column,5 etc. It has been widely claimed that great complementarity occurs between hydrophilic interaction chromatography (HILIC) and reversed-phase liquid chromatography (RPLC);6 therefore, their online combination should be qualified as a promising “all-in-one” pipeline7 to match with the chromatographic demands from large-scale targeted metabolomics.Despite the employment of identical solvents, such as acetonitrile (ACN) along with water, in RPLC and HILIC, it is still annoying in practice to achieve online hyphenation of RPLC and HILIC because the stronger elution solvent in HILIC will be the weaker one in RPLC, and vice versa.8 Several efforts have been devoted, until now, to tackle this technical bottleneck, and some schemes have been proposed. Serially coupled RPLC-HILIC has been developed through placing dilution pump(s) at the outlet of RP column to enlarge metabolite coverage in comparison with a single RP or HILIC column;9–16 however, the peak capacity hasn't been significantly expanded and the signals usually gather at the two relatively narrow regions of the chromatogram.10 In addition, it is risky that the retention behaviors serve as clues for structural identification via quantitative structure–retention relationship (QSRR) modeling14,17–19 because various retention mechanisms are fused for the direct coupling. Moreover, a facile hyphenation of HILIC and RPLC that can be named as guard column-(HILIC/RPLC) was accomplished in our previous report6 by implementing a RP guard column for pre-fractionation prior to the entrances of those polar and apolar compounds into HILIC and RP columns, respectively; however, significant peak broadening took place. The combination has also been achieved by employing a trapping column (TC, usually a short RP-C18 column) as an interface between HILIC and RP columns, namely HILIC-TC-RPLC. Those compounds in the eluate of the first column can be focused in TC20–22 and then back-flushed into the second analytical column; however, it is still an annoying workload for TC to prevent the resolution decrement of the second column through enriching compounds in the strong fluid at the front of TC. It is worthy to mention that parallel column analysis system was configured by Klavins et al.;23 however, its potential for qualitative profiling of complicated matrices is limited because each analyte corresponds to two signals.
To cope with the shortcomings of those aforementioned equipment setups, an array of attempts has been carried out in our group to find a superior interface between HILIC and RP columns. Fortunately, turbulent flow chromatographic (TFC) column (flow rate > 1.5 mL min−1) which is embedded with large-size particles (approximately 50–100 μm) shows a unique retention mechanism attributing to the application of turbulent flow instead of laminar flow in routine columns and can thereby satisfy trapping of small molecules (usually < 1500 Da), because those smaller molecules in turbulence continuously diffuse into and out of the pores and then assemble in the front of TFC column. Hence, TFC column could exactly match with the requirements of online extracting components from the diluted effluent (flow rate > 2.0 mL min−1) of the first HILIC column and then transmitting them into the second RP column.
Aiming to fulfill the chromatographic requirements from widely chemical analysis of complicated matrices, the configuration of a fit-for-purpose platform namely HILIC-TFC-RPLC-MS/MS was attempted, and comparisons among HILIC-TFC-RPLC-MS/MS and those conventional schemes, such as RPLC-HILIC, guard column-(HILIC/RPLC), and HILIC-TC-RPLC were also carried out by assaying the overall chromatographic performances of a mimic complicated sample containing 100 compounds. We envision that the integrated chromatographic platform could serve as a promising tool for large-scale targeted metabolomics.1
2. Materials and methods
2.1 Chemicals and materials
A total of 100 compounds spanning a wide polarity range as well as covering diverse chemical families, were employed to construct a mimic sample for the biological matrices following administration of traditional Chinese medicine (TCM). Except for those primary metabolites, the other compounds were purified from a popular TCM namely Baoyuan decoction that consists of four famous herbal medicines, such as Ginseng Radix and Rhizoma, Astragali Radix, Glycyrrhizae Radix and Rhizoma Praeparata Cum Melle, and Cinnamomi Cortex. The details regarding all reference compounds are described in ESI† A. The purities of all the reference compounds were determined to be greater than 98% by HPLC-DAD-IT-TOF-MS (Shimadzu, Tokyo, Japan). Moreover, four internal standards (ISs), including benzoylhypaconine (IS1, for hydrophilic analytes) along with 1,7-dimethoxyxanthone (IS2, for hydrophobic analytes) for positive ionization mode and lancerin (IS3, for hydrophilic analytes) along with 6-hydroxy-1,2,3,7-tetramethoxyxanthone (IS4, for hydrophobic analytes) for negative ionization mode were previously purified in our group.HPLC grade formic acid, ammonium formate, and methanol, as well as ACN were purchased from Thermo-Fisher (Pittsburgh, PA, USA). Dimethylsulfoxide (DMSO) was supplied by Merck (Darmstadt, Germany). Distilled water was prepared in-house using a Milli-Q Integral water purification system (Millipore, Bedford, MA, USA). The other chemicals were of analytical reagent grade and obtained financially from Beijing Chemical Co. Ltd. (Beijing, China).
2.2 Apparatus
Regarding LC domain, a Shimadzu modular LC system (Kyoto, Japan) consisting of nine units, i.e. four LC-20ADXR pumps (pumps A, B, C, and D), one LC-20AD module (pump E), a SIL-20ACXR auto-sampler, a CTO-20AC column oven, a DGU-20A3R degasser, two FCV-12AH electronic 2-channel/6-port valves (valves I and II), and a CBM-20A controller was involved, and an ABSciex 5500 Qtrap mass spectrometer (Foster City, CA, USA) mounted with an electrospray ionization (ESI) was responsible for quantitative measurements. Analyst Software package (Version 1.6.2, ABSciex) was utilized to synchronize the entire system and for data acquisition and processing as well.2.3 Sample preparation
Stock solutions of all authentic compounds were prepared with methanol or water. A 5 μL aliquot of each stock solution was diluted with 50% aqueous methanol to appropriate concentration (50–100 ng mL−1). The obtained solutions were implemented for mass spectrometric parameter optimization following the recommended protocols24 and utilized for signal assignment as well. A mimic sample was afforded by mixing all stock solutions, and subsequently 100-fold diluted with phosphate buffer solution (PBS, pH 7.4, Thermo-Fisher, Logan, UT, USA) to universally assess the chromatographic performances of all analytes. The concentrations of the compounds in the mimic sample, a compound pool actually, exhibited a great variation among 0.10–3.00 μg mL−1.On the other side, selected stock solutions that covered all chemical families, including ginsenoside Rh1, protopanaxatriol (PPT), liquiritigenin-7,4′-di-O-β-D-glucopyranoside, isoliquiritin apioside, calycosin-7-O-β-D-glucopyranoside, notoginsenoside R1, formononetin, licochalcone A, liquiritin, isoliquiritin, liquiritin apioside, calycosin, liquiritigenin, isoliquiritigenin, glycyrrhetic acid, betulinic acid, maleic acid, nicotinic acid, adenine, inosine, arachidonic acid (AA), 5-hydroxy-eicosatetraenoic acid (5-HETE), cholic acid (CA), hyodeoxycholic acid (HDCA), taurohyodeoxycholic acid (THDCA), betaine, nicotinamide, isoleucine, leucine, aspartic acid, thymidine, cytidine, uridine, adenosine, testosterone, uracil, and astragaloside II (37 ones in total), were pooled thoroughly to afford the partial mixed standard solution for method validation. The resultant solution was successively diluted with DMSO to yield a series of solutions that were individually 20-fold diluted with PBS to generate a set of calibration samples with desired concentration levels.
A 50 μL aliquot of each calibration sample or the mimic sample was thoroughly mixed with 150 μL ACN containing all ISs (500 ng mL−1 for IS1, IS3 and IS4, yet 100 ng mL−1 for IS2), and successively subjected for 15![[thin space (1/6-em)]](https://www.rsc.org/images/entities/char_2009.gif) 000 × g centrifugation at 4 °C for 10 min and filtration through a 0.22 μm nylon membrane (Jinteng, Tianjin, China) to remove those involatile substances.
000 × g centrifugation at 4 °C for 10 min and filtration through a 0.22 μm nylon membrane (Jinteng, Tianjin, China) to remove those involatile substances.
2.4 Configuration of HILIC-TFC-RPLC-MS/MS
As aforementioned, the stronger elution phase in HILIC will be the weaker one in RPLC, and vice versa, although both of them share similar solvents, such as water, methanol, and ACN, to compose the mobile phase. In order to tackle this annoying technical barrier, a smart system configuration was accomplished by employing a versatile TFC column (TurboFlow C18-P XL column, 1.0 × 50 mm, Thermo Fisher, Rockford, IL, USA) as the interface to extract small molecules from the effluent of Waters BEH Amide column (2.1 × 100 mm, 1.7 μm, Milford, MA, USA) and to transmit them into a Waters HSS T3 column (2.1 × 100 mm, 1.8 μm) via back-flushing. Auto-sampler injected 2 μL of sample into HILIC column. Pumps A and B supplied 10 mM aqueous ammonium formate fortified with 0.1% formic acid (A) and 95% aqueous ACN containing 10 mM ammonium formate along with 0.1% formic acid, respectively, into HILIC column with a gradient elution program as follows: 0–2.0 min, 100% B; 2.0–10.0 min, 100–60% B; 10.0–10.1 min, 60–100% B; 10.1–32.0 min, 100% B; and flow rate, 0.2 mL min−1. The eluate of HILIC column was 20-fold expanded with a dilution pump (pump E) via delivering pure water at 4.0 mL min−1. On the other side, pumps C and D were responsible for supplying 0.1% aqueous formic acid (C) and ACN (D), respectively, into RP-C18 column, and the elution was programmed as below: 0–4.0 min, 10% D; 4.0–14.0 min, 10–30% D; 14.0–20.0 min, 30–50% D; 20.0–25.0 min, 50–100% D; 25.0–28.0 min, 100% D; 28.0–28.1 min, 100–10% B; 28.1–32.0 min, 10% D; and flow rate, 0.3 mL min−1 (Table 1). Each single analytical run was automatically fragmented into loading (0–4.0 min, Fig. 1A) and parallel elution (4.0–32.0 min, Fig. 1B) phases via switching both valves at 4.0 min, and the entire system restored to the initial status at 32.0 min according to the channel transformation of both valves. The system dead volume was miniaturized by replacing all connecting tubes with minimal lengths of 0.13 mm (I.D.) poly ether ketone (PEEK) tubes.| Pump A | Pump B | Pump C | Pump D | Pump E | Columnsa | Valve I | Valve II | |
|---|---|---|---|---|---|---|---|---|
| a Note: column I, Waters HSS T3 column (2.1 × 100 mm, 1.8 μm); column II, Waters XBridge Amide column (4.6 × 150 mm, 3.5 μm); column III, Security Guard™, RP-C18 column (3.0 × 4 mm, 3.5 μm); column IV, Waters BEH Amide column (2.1 × 100 mm, 1.7 μm); column V, Cosmosil 5C18-AR-II column (4.6 × 50 mm, 3.5 μm); and column VI, Thermo Fisher, TurboFlow C18-P XL column (1.0 × 50 mm). | ||||||||
| RPLC-HILIC | 0.1% aqueous formic acid | ACN | 10 mM aqueous NH4COOH containing 0.1% formic acid | 95% aqueous ACN containing 10 mM ammonium formate and 0.1% formic acid | I and II | — | — | |
| 0–4.0 min, 10% B; 4.0–14.0 min, 10–30% B; 14.0–20.0 min, 30–50% B; 20.0–25.0 min, 50–100% B; 25.0–28.0 min, 100% B; 28.1–32.0 min, 10% B; flow rate, 0.2 mL min−1 | 0–4.0 min, 100% D; 4.0–14.0 min, 100–60% D; 14.0–20.0 min, 65–50% D; 20.1–32 min, 100% D; flow rate, 1.0 mL min−1 | |||||||
| Guard column-(HILIC/RPLC) | 0.1% aqueous formic acid | ACN | 10 mM aqueous NH4COOH containing 0.1% formic acid | 95% aqueous ACN containing 10 mM ammonium formate and 0.1% formic acid | I, II, and III | Loading phase (0–1.0 min): A; parallel elution phase (1.0–32 min): B | — | |
| 0–4.0 min, 10% B; 4.0–14.0 min, 10–30% B; 14.0–20.0 min, 30–50% B; 20.0–25.0 min, 50–100% B; 25.0–28.0 min, 100% B; 28.1–32.0 min, 10% B; flow rate, 0.2 mL min−1 | 0–1.0 min, 100% D, flow rate, 0.8 mL min−1 1.0–10.0 min, 82–60% D, flow rate, 1.0 mL min−1; 10.1–32 min, 100% D, flow rate, 1.0 mL min−1 | |||||||
| HILIC-TC-RPLC | 10 mM aqueous NH4COOH containing 0.1% formic acid | 95% aqueous ACN containing 10 mM ammonium formate and 0.1% formic acid | 0.1% aqueous formic acid | ACN | H2O, 4.0 mL min−1 | I, IV, and V | Loading phase (0–4.0 min): I-A and II-A; parallel elution phase (4.0–32 min): I-B and II-B | |
| 0–2.0 min, 100% B; 2.0–10.0 min, 100–60% B; 10.1–32.0 min, 100% B; flow rate, 0.2 mL min−1 | 0–4.0 min, 10% D; 4.0–14.0 min, 10–30% D; 14.0–20.0 min, 30–50% D; 20.0–25.0 min, 50–100% D; 25.0–28.0 min, 100% D; 28.1–32.0 min, 10% D; flow rate, 0.3 mL min−1 | |||||||
| HILIC-TFC-RPLC | 10 mM aqueous NH4COOH containing 0.1% formic acid | 95% aqueous ACN containing 10 mM ammonium formate and 0.1% formic acid | 0.1% aqueous formic acid | ACN | H2O, 4.0 mL min−1 | I, IV, and VI | Loading phase (0–4.0 min): I-A and II-A; parallel elution phase: I-B and II-B | |
| 0–2.0 min, 100% B; 2.0–10.0 min, 100–60% B; 10.1–32.0 min, 100% B; flow rate, 0.2 mL min−1 | 0–4.0 min, 10% D; 4.0–14.0 min, 10–30% D; 14.0–20.0 min, 30–50% D; 20.0–25.0 min, 50–100% D; 25.0–28.0 min, 100% D; 28.1–32.0 min, 10% D; flow rate, 0.3 mL min−1 | |||||||
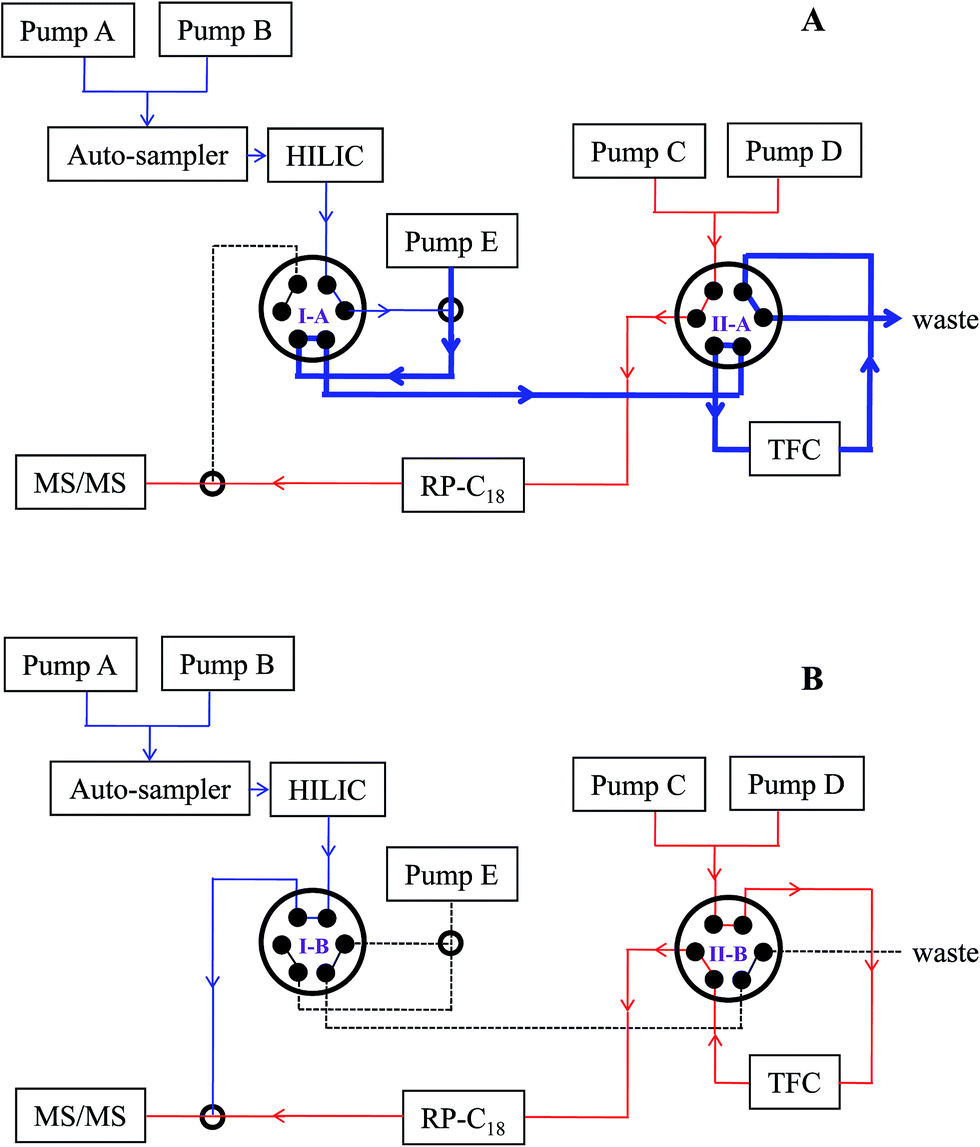 | ||
| Fig. 1 Brief schematic of HILIC-TFC-RPLC-MS/MS platform: (A), loading phase (0–4.0 min) and (B), parallel elution phase (4.0–32.0 min). The details in regard of the operation principles can be found in Section “2.4 Configuration of HILIC-TFC-RPLC-MS/MS”. | ||
Regarding Qtrap-MS domain, the ESI interface was always in charge of receiving both effluents from Amide and HSS T3 columns through a Shimadzu HP-mixer. Positive and negative multiple reaction monitoring (MRM) modes were utilized to analyze all samples in two separate runs. To match with the fluid (total flow rate, 0.5 mL min−1) reached at ESI interface, the ion source parameters were set as follows: temperature, 500 °C; ion-spray voltages, 5500 V and −4500 V for positive and negative ionization polarities, respectively; GS1, 55 psi; GS2, 55 psi; and CUR, 35 psi. The precursor-to-product ion transitions of all analytes, declustering potential (DP) and collision energy (CE) values are presented in Table 1. The dwell time was fixed at 10 ms for each ion transition. Moreover, MRM mode also served as the survey experiment to trigger two separate enhanced product ion (EPI) scans according to an information dependent acquisition (IDA) algorithm with a threshold as 500 cps. The key parameters for EPI scans were −30/30 eV for CE and 20 eV for collision energy spread (CES).
2.5 Method validation
Following method development, the quantitative terms with respect to linearity, limit of detection (LOD), lower limit of quantitation (LOQ), precision, repeatability, stability, mutual interference by the co-injection of the effluents from both columns, recovery, and matrix effect were assayed using those solutions derived from the partial mixed standard solution. All variations were determined using relative standard deviations (RSDs%).Moreover, a well-defined protocol was followed to assess matrix effects.25 Briefly, the mimic sample was firstly diluted and subsequently used to dilute, instead of PBS, those serial solutions derived from the partial mixed standard solution to yield another set of calibration samples. The obtained solutions were further processed with ISs fortified ACN and subjected to construct calibration curves. The slope of the new calibration curve of each analyte was compared with the slope of that obtained before to calculate the signal suppression/enhancement (SSE) for quantitative assessment of the matrix effects, according to following equation defined by Sulyok et al.:25 SSE = slopespiked extract/slopeliquid standard × 100%.
2.6 Chromatographic separations using RPLC-HILIC, guard column-(HILIC/RPLC), and HILIC-TC-RPLC
Until now, diverse efforts have been spent onto the online hyphenation of HILIC and RPLC to significantly expand the polarity coverage within a single analytical run, and several smart equipment schemes, such as RPLC-HILIC, guard column-(HILIC/RPLC), and HILIC-TC-RPLC, have been described. Comparisons were thereby carried out here among HILIC-TFC-RPLC and those existing equipment setups. All brief connectivity sketches, except for HILIC-TFC-RPLC, are illustrated in Fig. S1 (ESI† B).Identical HSS T3 column was applied in any case. A wide-bore Amide column (4.6 × 150 mm, 3.5 μm) participated in the configuration of either RPLC-HILIC or guard column-(HILIC/RPLC), while HILIC-TC-RPLC and HILIC-TFC-RPLC shared a same narrow-bore Amide column (2.1 × 100 mm, 1.7 μm). Moreover, a Phenomenex RP-C18 guard column (3.0 × 4 mm, 3.5 μm, Torrance, CA, USA) and a short RP-C18 column (Cosmosil 5C18-AR-II column, 4.6 × 50 mm, 3.5 μm, Kyoto, Japan) served as the additional columns for guard column-(HILIC/RPLC) and HILIC-TC-RPLC, respectively. The mimic sample served as the test sample for the comparative assays, and careful optimizations were performed to advance the chromatographic performance of each platform as far as possible. Information in terms of columns, mobile phase, elution programs, and valve switching schedules can be found in Table 1. In order to minimize the solvent effect between RPLC and HILIC, 5-fold dilution was set for either RPLC-HILIC or guard column-(HILIC/RPLC), whereas the chromatographic program of HILIC-TC-RPLC was exactly identical with HILIC-TFC-RPLC.
3. Results and discussions
3.1 Configuration of HILIC-TFC-RPLC-MS/MS and method development
The achievement of satisfactory chromatographic performance for each compound regardless of polarity is the premise for large-scale targeted metabolomics.1 After comparing the chromatographic performances of those existing schemes for the hyphenation of HILIC and RPLC,20–22 HILIC-TC-RPLC was selected as the frame to conduct modifications. Our preliminary evaluations demonstrated that HILIC column rather than RP column was the superior choice to directly receive the injected sample, and the TurboFlow C18-P XL column that took advantage of retaining apolar components, was correspondingly chosen to act as the trap column. Afterwards, the two chromatographs were interconnected according to two electronic 6-port/2-channel valves. In sight of the great specificity and selectivity of MRM mode, Qtrap-MS was qualified for receiving both eluents (total flow rate, 0.5 mL min−1) from HILIC and RPLC to significantly improve the throughput. Above all, the connectivity sketch of the integrated platform is elucidated in Fig. 1. A series of parameters and elution programs were carefully evaluated to satisfy the requirements for simultaneous determination of hydrophilic and hydrophobic compounds in complex matrices.| No. | Analyte | Retentiona | Polarity | cLogP | Cluster | tR (min) | Q1 | Q3 | DP (V) | CE (eV) |
|---|---|---|---|---|---|---|---|---|---|---|
| a Analyte was retained on Waters BEH Amide column (Amide) or Waters HSS T3 column (T3). | ||||||||||
| 1 | Oxalic acid | Amide | Neg. | −1.745 | I | 11.94 | 89.0 | 43.0 | −40 | −18 |
| 2 | Alanine | Amide | Pos. | −3.124 | I | 12.67 | 90.0 | 44.0 | 25 | 17 |
| 3 | GABA | Amide | Pos. | −2.771 | I | 12.29 | 104.0 | 87.0 | 40 | 16 |
| 4 | Serine | Amide | Pos. | −2.811 | I | 13.27 | 106.0 | 60.0 | 40 | 16 |
| 5 | Uracil | Amide | Pos. | −1.056 | I | 6.98 | 113.0 | 96.0 | 40 | 27 |
| 6 | Maleic acid | Amide | Neg. | −0.166 | I | 4.26 | 115.0 | 71.0 | −35 | −15 |
| 7 | Proline | Amide | Pos. | −2.413 | I | 12.27 | 116.0 | 70.0 | 50 | 20 |
| 8 | Succinic acid | Amide | Neg. | −0.526 | I | 8.77 | 117.0 | 73.0 | −35 | −12 |
| 9 | Betaine | Amide | Pos. | −8.173 | I | 11.82 | 118.0 | 58.0 | 40 | 41 |
| 10 | Valine | Amide | Pos. | −2.286 | I | 12.03 | 118.0 | 72.0 | 25 | 18 |
| 11 | Threonine | Amide | Pos. | −2.502 | I | 12.88 | 120.0 | 102.0 | 30 | 10 |
| 12 | Nicotinic acid | Amide | Neg. | 0.799 | I | 8.61 | 122.0 | 78.0 | −50 | −20 |
| 13 | Nicotinamide | Amide | Pos. | −2.060 | II | 4.83 | 123.0 | 80.0 | 30 | 30 |
| 14 | Thymine | Amide | Pos. | −0.557 | II | 6.05 | 127.0 | 110.0 | 40 | 23 |
| 15 | Leucine | Amide | Pos. | −1.667 | I | 11.32 | 132.0 | 86.0 | 50 | 18 |
| 16 | Isoleucine | Amide | Pos. | −1.757 | I | 11.55 | 132.0 | 86.0 | 50 | 18 |
| 17 | Malic acid | Amide | Neg. | −1.520 | I | 11.41 | 133.0 | 115.0 | −40 | −20 |
| 18 | Asparagine | Amide | Pos. | −3.544 | I | 13.35 | 133.0 | 74.0 | 30 | 23 |
| 19 | Adenine | Amide | Neg. | −0.148 | II | 9.50 | 134.0 | 107.0 | −70 | −18 |
| 20 | Aspartic acid | Amide | Pos. | −2.412 | I | 12.49 | 134.0 | 74.0 | 25 | 21 |
| 21 | Salicylic acid | Amide | Neg. | 2.187 | II | 4.40 | 137.0 | 93.0 | −50 | −21 |
| 22 | Protocatechuic aldehyde | T3 | Neg. | 1.030 | IV | 6.50 | 137.0 | 108.0 | −120 | −31 |
| 23 | Adipic acid | Amide | Neg. | −0.024 | I | 5.66 | 145.0 | 101.0 | −35 | −21 |
| 24 | Glutamic acid | Amide | Pos. | −2.694 | I | 13.34 | 148.0 | 84.0 | 25 | 23 |
| 25 | Protocatechnic A | Amide | Neg. | 1.062 | II | 6.60 | 153.0 | 109.0 | −70 | −19 |
| 26 | Phenylalanine | Amide | Pos. | −1.556 | II | 11.10 | 166.0 | 120.0 | 50 | 19 |
| 27 | Vanillic acid | Amide | Neg. | 1.355 | III | 8.31 | 167.0 | 123.0 | −50 | −16 |
| 28 | Gallic acid | Amide | Neg. | 0.425 | I | 9.60 | 169.0 | 125.0 | −60 | −21 |
| 29 | Caffeic acid | Amide | Neg. | 0.975 | II | 5.42 | 179.0 | 117.0 | −120 | −34 |
| 30 | Galactitol | Amide | Neg. | −2.046 | I | 12.29 | 181.0 | 163.0 | −100 | −16 |
| 31 | Ferulic acid | T3 | Neg. | 1.421 | III | 8.90 | 193.0 | 134.0 | −90 | −21 |
| 32 | Thymidine | Amide | Pos. | −1.385 | II | 7.87 | 243.0 | 127.0 | 30 | 16 |
| 33 | Cytidine | Amide | Pos. | −2.195 | II | 11.50 | 244.0 | 112.0 | 25 | 17 |
| 34 | Uridine | Amide | Pos. | −2.219 | II | 10.03 | 245.0 | 113.0 | 40 | 23 |
| 35 | Liquiritigenin | T3 | Neg. | 2.534 | IV | 12.64 | 255.0 | 119.0 | −120 | −30 |
| 36 | Isoliquiritigenin | T3 | Neg. | 2.786 | IV | 13.71 | 255.0 | 119.0 | −120 | −30 |
| 37 | Estradiol | T3 | Pos. | 3.784 | IV | 16.41 | 255.0 | 159.0 | 120 | 20 |
| 38 | Inosine | Amide | Neg. | −3.106 | II | 10.71 | 267.0 | 135.0 | −80 | −30 |
| 39 | Formononetin | T3 | Neg. | 2.645 | IV | 14.06 | 267.0 | 252.0 | −130 | −28 |
| 40 | Adenosine | Amide | Pos. | −2.158 | II | 9.91 | 268.0 | 136.0 | 40 | 30 |
| 41 | Genistein | T3 | Neg. | 2.405 | IV | 13.27 | 269.0 | 135.0 | −150 | −39 |
| 42 | Estrone | T3 | Pos. | 3.382 | IV | 17.88 | 271.0 | 253.0 | 116 | 20 |
| 43 | Calycosin | T3 | Neg. | 1.908 | IV | 12.76 | 283.0 | 268.0 | −100 | −27 |
| 44 | Guanosine | Amide | Pos. | −3.325 | II | 11.60 | 284.0 | 152.0 | 40 | 25 |
| 45 | Kaempferol | T3 | Neg. | 2.100 | IV | 13.30 | 285.0 | 117.0 | −180 | −50 |
| 46 | Testosterone | T3 | Pos. | 3.409 | IV | 17.02 | 289.0 | 97.0 | 120 | 33 |
| 47 | Quercetin | Amide | Neg. | 1.504 | IV | 5.08 | 301.0 | 151.0 | −130 | −27 |
| 48 | Methyltestosterone | T3 | Pos. | 3.928 | IV | 18.04 | 303.0 | 109.0 | 190 | 30 |
| 49 | AA | T3 | Neg. | 7.392 | IV | 24.17 | 303.0 | 259.0 | −90 | −18 |
| 50 | Isorhamnetin | T3 | Neg. | 1.951 | IV | 13.44 | 315.0 | 300.0 | −120 | −29 |
| 51 | 15-HETE | T3 | Neg. | 5.445 | IV | 19.81 | 319.0 | 219.0 | −110 | −17 |
| 52 | 12-HETE | T3 | Neg. | 5.445 | IV | 20.21 | 319.0 | 179.0 | −110 | −18 |
| 53 | 5-HETE | T3 | Neg. | 5.445 | IV | 20.44 | 319.0 | 115.0 | −110 | −16 |
| 54 | LTB4 | T3 | Neg. | 3.468 | IV | 22.70 | 335.0 | 195.0 | −110 | −20 |
| 55 | Licochalcone A | T3 | Neg. | 4.701 | IV | 15.43 | 337.0 | 305.0 | −100 | −30 |
| 56 | Sucrose | Amide | Neg. | −3.087 | I | 13.05 | 341.0 | 89.0 | −80 | −30 |
| 57 | PGE2 | T3 | Neg. | 2.013 | IV | 16.37 | 351.0 | 271.0 | −120 | −24 |
| 58 | Chlorogenic acid | Amide | Neg. | −1.879 | I | 11.22 | 353.0 | 191.0 | −110 | −22 |
| 59 | Cortisone | T3 | Pos. | 1.485 | IV | 13.38 | 361.0 | 163.0 | 120 | 30 |
| 60 | Cortisol | T3 | Pos. | 1.887 | IV | 13.27 | 363.0 | 121.0 | 130 | 36 |
| 61 | 6-Keto-PGF1α | Amide | Neg. | 0.962 | III | 5.81 | 369.0 | 163.0 | −120 | −35 |
| 62 | TXB2 | T3 | Neg. | 1.229 | IV | 14.80 | 369.0 | 169.0 | −120 | −25 |
| 63 | Cholesterol | T3 | Pos. | 9.520 | IV | 19.18 | 387.0 | 331.0 | 160 | 20 |
| 64 | DCA | Amide | Neg. | 4.514 | III | 4.10 | 391.0 | 391.0 | −120 | −30 |
| 65 | HDCA | Amide | Neg. | 4.514 | III | 4.57 | 391.0 | 391.0 | −120 | −30 |
| 66 | CA | Amide | Neg. | 2.427 | III | 7.29 | 407.0 | 343.0 | −120 | −45 |
| 67 | Isoliquiritin | Amide | Neg. | 1.289 | III | 8.62 | 417.0 | 255.0 | −130 | −26 |
| 68 | Liquiritin | Amide | Neg. | 1.037 | III | 8.95 | 417.0 | 255.0 | −130 | −26 |
| 69 | Ononin | Amide | Neg. | 0.938 | III | 8.53 | 429.0 | 267.0 | −40 | −16 |
| 70 | Genistin | Amide | Neg. | 0.909 | III | 8.73 | 431.0 | 268.0 | −180 | −35 |
| 71 | Orientin | Amide | Neg. | −0.012 | III | 10.20 | 447.0 | 357.0 | −100 | −29 |
| 72 | PD | T3 | Pos. | 7.220 | IV | 27.21 | 461.3 | 425.4 | 100 | 23 |
| 73 | Glycyrrhetic acid | T3 | Neg. | 6.478 | IV | 20.97 | 469.2 | 425.2 | −100 | −51 |
| 74 | PPT | Amide | Neg. | 4.696 | III | 4.26 | 475.4 | 391.5 | −100 | −40 |
| 75 | Calycosin-7-O-β-D-glucoside | Amide | Neg. | 0.202 | III | 8.90 | 491.0 | 283.0 | −40 | −20 |
| 76 | PT | Amide | Pos. | 5.133 | III | 8.86 | 494.4 | 344.1 | 100 | 40 |
| 77 | TCDCA | Amide | Neg. | 2.075 | III | 8.90 | 498.0 | 80.0 | −150 | −120 |
| 78 | THDCA | Amide | Neg. | 2.075 | III | 9.13 | 498.0 | 80.0 | −150 | −120 |
| 79 | Betulinic acid | T3 | Neg. | 8.477 | IV | 23.70 | 501.0 | 455.0 | −100 | −15 |
| 80 | Oleanolic acid | T3 | Neg. | 8.370 | IV | 24.00 | 501.0 | 455.0 | −100 | −15 |
| 81 | TCCA | Amide | Neg. | −0.012 | III | 9.50 | 514.0 | 80.0 | −100 | −125 |
| 82 | Isoliquiritin apioside | Amide | Neg. | −0.015 | III | 9.25 | 549.0 | 255.0 | −150 | −35 |
| 83 | Liquiritin apioside | Amide | Neg. | −0.267 | III | 9.67 | 549.0 | 255.0 | −150 | −42 |
| 84 | Apigenin-6,8-di-C-β-D-glucopyranoside | Amide | Neg. | 0.930 | III | 11.61 | 593.0 | 353.0 | −50 | −50 |
| 85 | Liquiritigenin-7,4′-di-O-β-D-glucoside | Amide | Neg. | −0.743 | III | 10.75 | 625.0 | 417.0 | −100 | −23 |
| 86 | Rh2 | Amide | Neg. | 5.821 | III | 8.40 | 667.0 | 621.0 | −90 | −32 |
| 87 | Rh1 | Amide | Neg. | 3.734 | III | 8.73 | 683.0 | 637.0 | −90 | −32 |
| 88 | Glycyrrhizic acid | Amide | Neg. | 3.031 | III | 11.20 | 821.0 | 351.0 | −40 | −55 |
| 89 | F2 | Amide | Neg. | 4.359 | III | 9.52 | 829.0 | 783.0 | −90 | −32 |
| 90 | Astragaloside A | T3 | Neg. | 2.720 | IV | 10.27 | 829.4 | 783.3 | −100 | −36 |
| 91 | F11 | Amide | Neg. | 2.638 | III | 9.79 | 845.0 | 799.0 | −90 | −32 |
| 92 | Rg1 | Amide | Neg. | 2.272 | III | 10.10 | 845.0 | 845.0 | −90 | −15 |
| 93 | Astragaloside II | Amide | Neg. | 2.624 | III | 9.12 | 871.4 | 871.4 | −50 | −13 |
| 94 | Astragaloside I | Amide | Neg. | 3.181 | III | 8.70 | 913.6 | 913.6 | −40 | −7 |
| 95 | Ro | Amide | Neg. | 4.331 | III | 10.92 | 955.0 | 955.0 | −90 | −5 |
| 96 | Notoginsenoside R1 | Amide | Neg. | 1.667 | III | 10.76 | 977.5 | 931.5 | −40 | −33 |
| 97 | Rd | Amide | Neg. | 1.635 | III | 10.53 | 991.0 | 945.0 | −90 | −32 |
| 98 | Re | Amide | Neg. | 2.186 | III | 10.65 | 991.0 | 945.0 | −90 | −32 |
| 99 | Rb2 | Amide | Neg. | 1.678 | III | 10.80 | 1123.0 | 1077.0 | −90 | −32 |
| 100 | Rb1 | Amide | Neg. | 1.646 | III | 11.07 | 1153.0 | 1107.0 | −90 | −32 |
| IS1 | Amide | Pos. | 8.37 | 574.0 | 542.0 | 103 | 47 | |||
| IS2 | T3 | Pos. | 17.41 | 257.0 | 242.0 | 120 | 30 | |||
| IS3 | Amide | Neg. | 9.42 | 405.0 | 285.0 | −160 | −33 | |||
| IS4 | T3 | Neg. | 13.52 | 331.0 | 301.0 | −180 | −28 | |||
Following the application of those optimized parameters, the chromatographic performances as well as the mass spectrometric responses of most analytes could meet the demands for large-scale quantitative analysis. The representative overlaid chromatogram is shown in Fig. 2A, and those separated chromatogram of each analyte can be found in Fig. S2 (ESI† B).
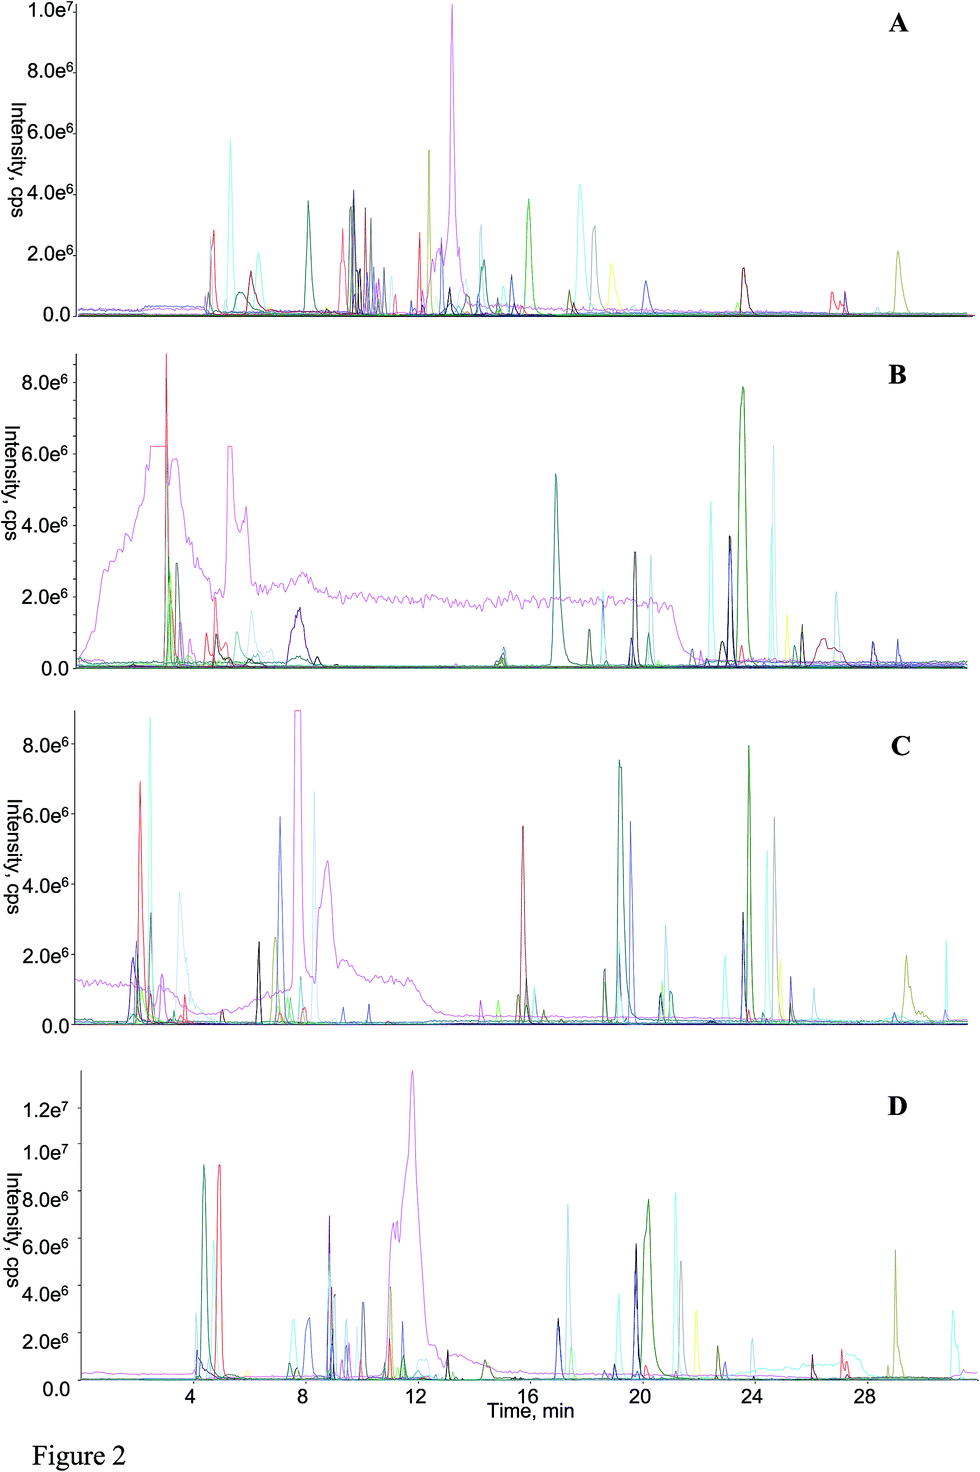 | ||
| Fig. 2 Representative overlaid all extracted ion current chromatograms of the mimic sample using both positive (dotted line) and negative (continuous line) polarities obtained from HILIC-TFC-RPLC-MS/MS (A), RPLC-HILIC-MS/MS (B), guard column-(HILIC/RPLC)-MS/MS (C), HILIC-TC-RPLC-MS/MS (D) platform. | ||
3.2 Method validation
A total of 37 analytes covering diverse chemical families participated in method validation assays. The results regarding linearity, LOQ, and LOD assays are summarized in Table 3. Great linear characteristics (greater than 0.99) were afforded for all assayed components. Except for a couple of analytes, such as Rh1, PPT, and astragaloside II, LOQs of all involved analytes are lower than 40 ng mL−1, suggesting that sensitive quantitation could be achieved using the developed method. The RSDs% of intra- and inter-day precisions were among 1.77–16.49% and 2.95–19.05% for all analytes, respectively (Table S1, ESI† A). Concerning repeatability assay, RSDs% of all analytes were less than 17.54% (Table S1†). Regarding the stability, RSDs% of all analytes were less than 14.79%, except for HDCA (30.89%), which can be attributed to its extensive degradation (Table S1†). All recoveries were ranged from 70.05% to 139.57% (Table S1†). The protocols previously proposed were followed for matrix effect assay,15 and two sets of calibration curves were gained. The SSE values were calculated among 80.52–130.00%, indicating that none significant matrix effect occurred for all analytes. Together, the developed HILIC-TFC-RPLC-MS/MS method was demonstrated to be sensitive, precise, and accurate for simultaneous determination of numerous targets in complicated matrices.| No. | Analyte | Formula | r | Weighting | Range (ng mL−1) | LOD (ng mL−1) | LOQ (ng mL−1) | Matrix effect (%) |
|---|---|---|---|---|---|---|---|---|
| 1 | Uracil | y = 0.174x + 5.29 × 10⁻⁵ | 0.9969 | None | 10.00–500.00 | 5.00 | 10.00 | 101.84 |
| 2 | Maleic acid | y = 60.9x + 0.169 | 0.9958 | 1/x | 50.00–500.00 | 10.00 | 20.00 | 80.53 |
| 3 | Betaine | y = 177x + 3.52 | 0.9944 | 1/x | 10.00–500.00 | 0.16 | 0.40 | 99.89 |
| 4 | Nicotinic acid | y = 13.7x + 0.00384 | 0.9987 | 1/x | 10.00–500.00 | 5.00 | 10.00 | 128.53 |
| 5 | Nicotinamide | y = 28x + 0.000753 | 0.9990 | 1/x | 0.80–500.00 | 0.40 | 0.80 | 102.14 |
| 6 | Leucine | y = 4.59x + 0.0634 | 0.9931 | 1/x | 20.00–500.00 | 0.40 | 0.80 | 130.00 |
| 7 | Isoleucine | y = 5.78x + 0.0781 | 0.9924 | 1/x | 20.00–500.00 | 0.40 | 0.80 | 88.86 |
| 8 | Adenine | y = 16x + 0.0124 | 0.9961 | 1/x | 30.00–750.00 | 20.00 | 30.00 | 101.00 |
| 9 | Aspartic acid | y = 0.0905x + 0.000884 | 0.9923 | 1/x | 10.00–250.00 | 5.00 | 10.00 | 82.74 |
| 10 | Thymidine | y = 2.47x + 0.000227 | 0.9993 | 1/x | 6.00–1500.00 | 3.00 | 6.00 | 81.06 |
| 11 | Cytidine | y = 21.2x + 0.0406 | 0.9980 | 1/x | 16.00–1000.00 | 0.40 | 0.80 | 124.53 |
| 12 | Uridine | y = 0.403x + 0.000386 | 0.9992 | 1/x | 32.00–4000.00 | 16.00 | 32.00 | 95.12 |
| 13 | Liquiritigenin | y = 63x − 0.0167 | 0.9975 | None | 12.50–625.00 | 0.50 | 2.50 | 98.10 |
| 14 | Isoliquiritigenin | y = 159x + 0.0116 | 0.9996 | None | 2.50–625.00 | 0.20 | 1.00 | 87.41 |
| 15 | Inosine | y = 17.6x + 0.000854 | 0.9968 | 1/x | 4.00–100.00 | 3.00 | 4.00 | 121.17 |
| 16 | Formononetin | y = 545x + 0.0144 | 0.9984 | 1/x | 0.20–125.00 | 0.01 | 0.02 | 99.26 |
| 17 | Adenosine | y = 30.3x + 0.00436 | 0.9954 | 1/x | 8.00–200.00 | 4.00 | 8.00 | 99.74 |
| 18 | Calycosin | y = 107x + 0.0223 | 0.9990 | None | 1.00–625.00 | 0.20 | 1.00 | 84.55 |
| 19 | Testosterone | y = 29.6x − 7.79 × 10⁻⁶ | 0.9979 | 1/x | 1.15–144.00 | 0.58 | 1.15 | 95.95 |
| 20 | AA | y = 46.4x − 0.00139 | 0.9976 | 1/x | 1.52–380.00 | 0.80 | 1.52 | 84.38 |
| 21 | 5-HETE | y = 3.91x − 0.00208 | 0.9971 | 1/x | 7.90–395.00 | 3.00 | 7.90 | 96.22 |
| 22 | Licochalcone A | y = 16.9x + 0.00138 | 0.9983 | 1/x | 0.68–84.50 | 0.34 | 0.68 | 124.72 |
| 23 | HDCA | y = 9.64x + 0.023 | 0.9953 | 1/x | 39.20–980.00 | 25.00 | 39.20 | 120.33 |
| 24 | CA | y = 5.6x + 0.000494 | 0.9973 | 1/x | 8.16–1020.00 | 4.08 | 8.16 | 119.64 |
| 25 | Isoliquiritin | y = 57.1x − 0.00322 | 0.9970 | 1/x | 2.50–625.00 | 0.25 | 0.50 | 88.42 |
| 26 | Liquiritin | y = 48.2x + 0.00131 | 0.9992 | 1/x | 2.50–625.00 | 0.25 | 0.50 | 124.48 |
| 27 | Glycyrrhetic acid | y = 7.26x + 0.00505 | 0.9995 | 1/x | 5.00–625.00 | 2.50 | 5.00 | 113.74 |
| 28 | PPT | y = 0.209x − 0.000217 | 0.9925 | 1/x | 47.60–1190.00 | 30.00 | 47.60 | 91.73 |
| 29 | Calycosin-7-O-β-D-glucoside | y = 25.6x + 2.48 × 10⁻⁵ | 0.9973 | 1/x | 3.00–1875.00 | 0.20 | 1.00 | 126.88 |
| 30 | THDCA | y = 22x − 0.00162 | 0.9989 | 1/x | 5.15–1290.00 | 0.20 | 0.41 | 124.55 |
| 31 | Betulinic acid | y = 4.1x − 0.0144 | 0.9956 | 1/x | 22.80–570.00 | 15.00 | 22.80 | 128.93 |
| 32 | Isoliquiritin apioside | y = 37.6x + 0.000282 | 0.9959 | 1/x | 1.50–1875.00 | 0.60 | 1.50 | 99.47 |
| 33 | Liquiritin apioside | y = 75.8x + 0.0056 | 0.9963 | 1/x | 3.00–1875.00 | 0.20 | 0.60 | 100.79 |
| 34 | Liquiritigenin-7,4′-di-O-β-D-glucoside | y = 5.73x + 0.00043 | 0.9953 | 1/x | 5.00–1250.00 | 2.00 | 5.00 | 96.86 |
| 35 | Rh1 | y = 15.2x − 0.00805 | 0.9966 | None | 50.00–1250.00 | 25.00 | 50.00 | 99.61 |
| 36 | Astragaloside II | y = 0.522x − 0.000587 | 0.9916 | 1/x | 66.16–8270.00 | 33.08 | 66.16 | 89.00 |
| 37 | Notoginsenoside R1 | y = 0.171x − 0.000102 | 0.9934 | 1/x | 37.50–1875.00 | 20.00 | 37.50 | 90.88 |
3.3 Comparisons among RPLC-HILIC, guard column-(HILIC/RPLC), HILIC-TC-RPLC, and HILIC-TFC-RPLC platforms
Regarding the equipment schemes, the most facile instrumentation corresponded to RPLC-HILIC because none valve and only two columns were involved for the hardware configuration. In comparison of RPLC-HILIC, one electronic valve as well as one more columns participated in the construction of guard column-(HILIC/RPLC). In the meanwhile, HILIC-TFC-RPLC exhibited comparable sophisticated equipment scheme with HILIC-TC-RPLC, and the only difference occurred at the replacement of TC with TFC. The representative chromatograms afforded from all four integrated platforms of the mimic sample are shown in Fig. 2. Overall, most of targeted compounds could be found in the chromatograms of RPLC-HILIC, guard column-(HILIC/RPLC), and HILIC-TC-RPLC, indicating comparable retention windows with HILIC-TFC-RPLC. It made sense that most analytes were observable in the chromatograms of either RPLC-HILIC or guard column-(HILIC/RPLC), because there wasn't any effluent escaping from the entire system. On the other side, the comprehensive retention of those compounds in HILIC eluates trapped by TC and TFC columns led to the existences of all analytes in the chromatograms of HILIC-TC-RPLC and HILIC-TFC-RPLC.The retention behaviors of all compounds on the four schemes were compared. The scatter plot diagrams of cLogP value that was the key parameters for structure–retention relationship modeling and calculated using ChemBioDraw Ultra 14.0 software (CambridgeSoft, Cambridge, MA, USA) versus retention time are shown in Fig. 3. Given the simple chromatographic mechanism (HILIC or RP mechanism) of guard column-(HILIC/RPLC), most hydrophilic metabolites that could not be retained (retention time lower than 1.0 min) by guard column, solely underwent chromatographic separation in HILIC column, whereas those hydrophobic substances successively passed through the guard and RP columns. Therefore, negative correlations were observed between retention times and cLogP values for those compounds underwent HILIC separation,28 while the retention behaviors of the other analytes showed positive correlations with their polarity sequence attributing to RPLC separation29 (Fig. 3C). In contrast, it was quite difficult to find the correlations between the elution time and the polarity of a given analyte on RPLC-HILIC (Fig. 3B) because each analyte received two different chromatographic separations, and most hydrophilic analytes gathered at a relatively narrow window of 3.0–7.0 min, whereas most hydrophobic ones were eluted after 15.0 min. The elution patterns of most analytes on HILIC-TFC-RPLC (Fig. 3A) and HILIC-TC-RPLC (Fig. 3D) could match with that on guard column-(HILIC/RPLC); however, some glycosides, including triterpenoid saponins, flavonoids, as well as some bile acids, solely passed through HILIC column instead of RP column and their retention times showed downward trends with the increment of cLogP values (Fig. 3A and D and Table 2).
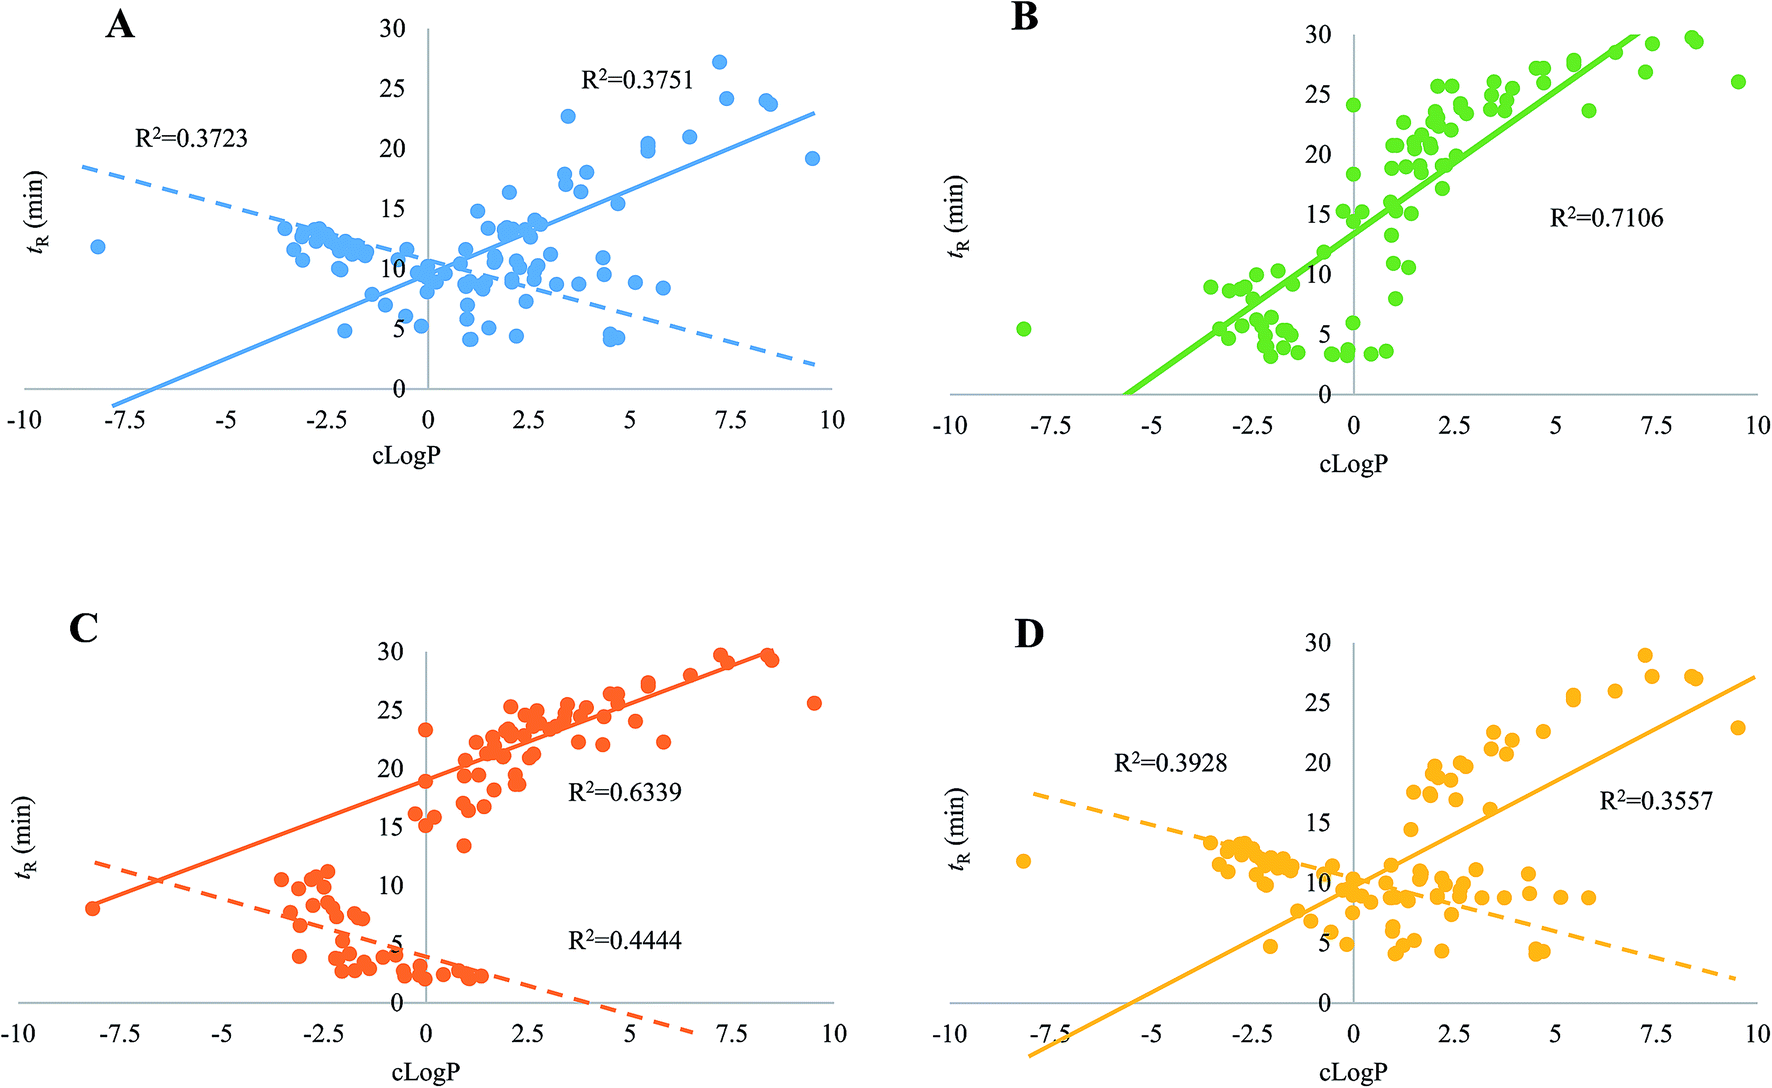 | ||
| Fig. 3 The cLogP value vs. retention time scatter plot diagrams of HILIC-TFC-RPLC-MS/MS (A), RPLC-HILIC-MS/MS (B), guard column-(HILIC/RPLC)-MS/MS (C), and HILIC-TC-RPLC-MS/MS (D). Two separated regressive lines, including one for HILIC separation mechanism (dotted line with downward trend) and the other for RPLC separation mechanism (continuous line with upward trend), can be constructed for the correlations between cLogP values and retention times of analyte on guard column-(HILIC/RPLC), HILIC-TC-RPLC, and HILIC-TFC-RPLC, whereas only one regressive line (continuous line with upward trend) can be built for the correlations between cLogP values and retention times of analyte on RPLC-HILIC because of hybrid separation mechanism. | ||
The aim of online hyphenating HILIC and RPLC was to comprehensively retain compounds regardless of the polarity in complicated matrices. For convenient comparison, all analytes were grouped into a couple of clusters (clusters I–IV, Table 2) based on their retention behaviors. Cluster I included the compounds that weren't retained by RP column at all, such as most amino acids and nucleosides. The retention times of those substances in cluster II were more than the dead time (t0) on RP analytical column;30 however, they received HILIC separations on guard column-(HILIC/RPLC), mainly including some amino acids as well as some nucleic bases. Cluster III corresponded to those compounds that obtained chromatographic separations on RP column of guard column-(HILIC/RPLC) yet HILIC column of either HILIC-TC-RPLC or HILIC-TFC-RPLC, mainly including some bile acids, triterpenoid saponins, along with flavonoids. At last, the other compounds that always underwent RP chromatographic separations existed in the cluster IV. Some representative compounds covering all clusters, e.g. leucine & isoleucine (cluster I), uridine & cytidine (cluster II), Rd & Re (cluster III), 5-HETE, 12-HETE, & 15-HETE (cluster IV) were randomly selected to carry out in-depth comparison regarding the chromatographic performances among those four platforms in terms of peak shape and resolution (Fig. 4). Regarding leucine and isoleucine, RPLC-HILIC afforded the worst performance and the potential reason was that RP column suppressed the separation capacity of HILIC for those compounds with significant polarity attributing to their contrary chromatographic mechanisms. In the case of uridine vs. cytidine, satisfactory chromatographic behaviors could not yield from guard column-(HILIC/RPLC), because HILIC column arduously resisted the separation potency of compounds in cluster II on the RP-C18 guard column. Because of the different mechanisms between HILIC and RPLC, Rd and Re were co-eluted on RPLC-HILIC, and incomparable resolution with guard column-(HILIC/RPLC) was generated from the other two platforms owing to the separation responsibility from HILIC column instead of RP column. For those analytes in cluster IV, the best chromatographic patterns of 5-HETE, 12-HETE, & 15-HETE were detected on HILIC-TFC-RPLC being successively followed by HILIC-TC-RPLC, guard column-(HILIC/RPLC), and RPLC-HILIC, in regard of peak width as well as height. It is necessary to highlight the differences between HILIC-TC-RPLC and HILIC-TFC-RPLC, which almost shared identical instrument schemes and elution program. Identical performances were yielded for the compounds belonging to clusters I–III that solely underwent chromatographic separations in HILIC column. However, better retention behaviors, mainly regarding retention time and peak width, were generated for those hydrophobic compounds (cluster IV) on HILIC-TFC-RPLC, attributing to the robuster trapping potential from TFC than that of TC; hence, more sensitive detection of apolar components could be accomplished on HILIC-TFC-RPLC.
 | ||
| Fig. 4 Comparisons of the chromatographic performances of some representative analytes covering four clusters (I–IV) among those four integrated platforms, such as HILIC-TFC-RPLC-MS/MS (A), RPLC-HILIC-MS/MS (B), guard column-(HILIC/RPLC)-MS/MS (C), and HILIC-TC-RPLC-MS/MS (D). | ||
Although comprehensive retention took place for all involved analytes in current study, it was still risky of analyte missing for HILIC-TC-RPLC and HILIC-TFC-RPLC, since some compounds might escape from the effluents of TC or TFC within the loading phase when TC or TFC could not fully trap all analytes. In addition, given the employment of valve(s) in guard column-(HILIC/RPLC), HILIC-TC-RPLC, and HILIC-TFC-RPLC, a single compound might be split into two signals, when the phase switching just occurred during the pass of a certain compound through the outlet of the column, such as the guard column of guard column-(HILIC/RPLC) and HILIC column of HILIC-TC-RPLC or HILIC-TFC-RPLC. Because all compounds passed through the entire column of the guard column, the separation potential for the compounds in cluster II afforded by the RP-C18 guard column should be non-ignorable, and subsequently significant peak width for those compounds would occur; hence, the greatest risk of peak splitting might occur for guard column-(HILIC/RPLC). Meanwhile, a single compound solely corresponded to one peak on RPLC-HILIC attributing to being free of valve. The peak capacity of guard column-(HILIC/RPLC), HILIC-TC-RPLC, or HILIC-TFC-RPLC was the sum, theoretically, of HILIC along with RPLC, and thereby significantly greater than that of RPLC-HILIC. Moreover, more organic solvents that played key roles for LC-initiated pollution as well as cost, were involved for the measurements on both RPLC-HILIC and guard column-(HILIC/RPLC), and also it is more difficult to optimize the entire elution programs for these two platforms. Taking all information above into account, HILIC-TFC-RPLC was regarded as a slightly better choice when all units were available and the other ones could serve as alternatives.
4. Conclusions
The extensive polarity span of the components in complicated matrices gave rise to a challenging workload for comprehensive quantitation, and the primary technical obstacle was the achievement of satisfactory chromatographic performance for each constituent regardless of its polarity. To enlarge the metabolite coverage of single column LC-MS/MS, a smart instrumentation namely HILIC-TFC-RPLC-MS/MS was configured. Online hyphenation of HILIC and RPLC was accomplished via introducing a TFC column as the convertor being responsible for trapping and transmitting those hydrophobic substances. An entire analytical run was automatically fragmented into loading (0–4 min) and parallel elution (4–32 min) phases, and most hydrophilic and hydrophobic components, 100 ones in total, were separated using HILIC and RP columns, respectively. Diverse method validation assays demonstrated the developed method to be sensitive, precise, accurate, and reproducible. Moreover, in-depth comparisons were carried out amongst HILIC-TFC-RPLC and three existing schemes, and the results in terms of overall chromatographic performance, retaining profile and instrumentation, suggested that the newly developed system was slightly better than the other ones. Above all, the integrated HILIC-TFC-RPLC-MS/MS platform can serve as a feasible choice for large-scale targeted metabolomics.Acknowledgements
This work was financially supported by National Science Fund of China (No. 81403073, 81530097, and 81503227), the funds from Beijing University of Chinese Medicine (No. 2016-JYB-XJQ004 and 2016-JYB-XS090), and the Macao Science and Technology Development Fund (007/2014/AMJ).References
- J. Zhou and Y. Yin, Analyst, 2016, 141, 6362–6373 RSC.
- Y. L. Song, Q. Q. Song, Y. Liu, J. Li, J. B. Wan, Y. T. Wang, Y. Jiang and P. F. Tu, Anal. Chim. Acta, 2017, 953, 40–47 CrossRef CAS PubMed.
- G. Du, H. Y. Zhao, Y. L. Song, Q. W. Zhang and Y. T. Wang, J. Sep. Sci., 2011, 34, 2576–2585 CrossRef CAS PubMed.
- C. Yao, L. Qi, G. Yang and F. Wang, J. Sep. Sci., 2010, 33, 475–483 CrossRef CAS PubMed.
- T. Ikegami and N. Tanaka, Annu. Rev. Anal. Chem., 2016, 9, 317–342 CrossRef CAS PubMed.
- Y. L. Song, N. Zhang, S. P. Shi, J. Li, Q. Zhang, Y. F. Zhao, Y. Jiang and P. F. Tu, J. Chromatogr. A, 2015, 1407, 106–118 CrossRef CAS PubMed.
- H. Wang, J. Xu, Y. Chen, R. Zhang, J. He, Z. Wang, Q. Zang, J. Wei, X. Song and Z. Abliz, Anal. Chem., 2016, 88, 3459–3464 CrossRef CAS PubMed.
- L. Montero, M. Herrero, M. Prodanov, E. Ibanez and A. Cifuentes, Anal. Bioanal. Chem., 2013, 405, 4627–4638 CrossRef CAS PubMed.
- G. Greco, S. Grosse and T. Letzel, J. Sep. Sci., 2014, 37, 630–634 CrossRef CAS PubMed.
- G. Greco, S. Grosse and T. Letzel, J. Sep. Sci., 2013, 36, 1379–1388 CrossRef CAS PubMed.
- J. Chen, L. Gao, Z. Li, S. Wang, J. Li, W. Cao, C. Sun, L. Zheng and X. Wang, Anal. Chim. Acta, 2016, 914, 117–126 CrossRef CAS PubMed.
- S. Louw, A. S. Pereira, F. Lynen, M. Hanna-Brown and P. Sandra, J. Chromatogr. A, 2008, 1208, 90–94 CrossRef CAS PubMed.
- J. Haggarty, M. Oppermann, M. J. Dalby, R. J. Burchmore, K. Cook, S. Weidt and K. E. Burgess, Metabolomics, 2015, 11, 1465–1470 CrossRef CAS PubMed.
- M. Rajab, G. Greco, C. Heim, B. Helmreich and T. Letzel, J. Sep. Sci., 2013, 36, 3011–3018 CAS.
- Z. Yan and R. Yan, Anal. Chim. Acta, 2015, 894, 65–75 CrossRef CAS PubMed.
- T. Alvarez-Segura, J. R. Torres-Lapasio, C. Ortiz-Bolsico and M. C. Garcia-Alvarez-Coque, Anal. Chim. Acta, 2016, 923, 1–23 CrossRef CAS PubMed.
- G. M. Randazzo, D. Tonoli, S. Hambye, D. Guillarme, F. Jeanneret, A. Nurisso, L. Goracci, J. Boccard and S. Rudaz, Anal. Chim. Acta, 2016, 916, 8–16 CrossRef CAS PubMed.
- K. Gorynski, B. Bojko, A. Nowaczyk, A. Bucinski, J. Pawliszyn and R. Kaliszan, Anal. Chim. Acta, 2013, 797, 13–19 CrossRef CAS PubMed.
- J. P. Andries, H. A. Claessens, Y. V. Heyden and L. M. Buydens, Anal. Chim. Acta, 2009, 652, 180–188 CrossRef CAS PubMed.
- S. Wang, J. Li, X. Shi, L. Qiao, X. Lu and G. Xu, J. Chromatogr. A, 2013, 1321, 65–72 CrossRef CAS PubMed.
- Q. Ren, C. Wu and J. Zhang, J. Chromatogr. A, 2013, 1304, 257–262 CrossRef CAS PubMed.
- S. Wang, L. Qiao, X. Shi, C. Hu, H. Kong and G. Xu, Anal. Bioanal. Chem., 2015, 407, 331–341 CrossRef CAS PubMed.
- K. Klavins, H. Drexler, S. Hann and G. Koellensperger, Anal. Chem., 2014, 86, 4145–4150 CrossRef CAS PubMed.
- Y. L. Song, W. H. Jing, G. Du, F. Q. Yang, R. Yan and Y. T. Wang, J. Chromatogr. A, 2014, 1338, 24–37 CrossRef CAS PubMed.
- M. Sulyok, F. Berthiller, R. Krska and R. Schuhmacher, Rapid Commun. Mass Spectrom., 2006, 20, 2649–2659 CrossRef CAS PubMed.
- X. L. Ma, X. Y. Guo, Y. L. Song, L. R. Qiao, W. G. Wang, M. B. Zhao, P. F. Tu and Y. Jiang, Sci. Rep., 2016, 6, 38379 CrossRef CAS PubMed.
- Q. Q. Song, Y. L. Song, N. Zhang, J. Li, Y. Jiang, K. R. Zhang, Q. Zhang and P. F. Tu, RSC Adv., 2015, 5, 57372–57382 RSC.
- M. Cao, K. Fraser, J. Huege, T. Featonby, S. Rasmussen and C. Jones, Metabolomics, 2015, 11, 696–706 CrossRef CAS PubMed.
- T. Baczek, R. Kaliszan, K. Novotná and P. Jandera, J. Chromatogr. A, 2005, 1075, 109–115 CrossRef CAS PubMed.
- K. S. Yun, C. Zhu and J. F. Parcher, Anal. Chem., 1995, 67, 613–619 CrossRef CAS.
Footnote |
| † Electronic supplementary information (ESI) available. See DOI: 10.1039/c7ra03788k |
| This journal is © The Royal Society of Chemistry 2017 |