 Open Access Article
The effects of calcination atmosphere on the catalytic performance of Ce-doped TiO2 catalysts for selective catalytic reduction of NO with NH3†
Yiqing Zenga,
Shule Zhang *a,
Yanan Wanga,
Guangli Liub and
Qin Zhong*a
aSchool of Chemical Engineering, Nanjing University of Science and Technology, Nanjing 210094, PR China. E-mail: shulezhang@163.com; Fax: +86 25 84315517; Tel: +86 25 84315517
bLanzhou Petrochemical Research Center, PetroChina, Lanzhou 730060, PR China
First published on 27th April 2017
Abstract
A series of well-reported Cex–Ti catalysts with a low content of Ce species were synthesized by a sol–gel method. The aim of this study was to investigate the influence of different calcination atmospheres on the formation of the Ce–O–Ti structure that comprises active sites for the selective catalytic reduction (SCR) of NO by NH3. Catalytic activity tests showed that the Cex–Ti–N (calcined under a nitrogen atmosphere) catalysts exhibited a significantly higher NO removal efficiency than Cex–Ti–A (calcined under air). Characterization results confirmed that more Ce species could incorporate into the TiO2 lattice when calcined under a nitrogen atmosphere, thus, more Ce–O–Ti structures were obtained over the Cex–Ti–N surface. This improved the NH3 adsorption and electron transfer from Ti to Ce. Therefore, N2 calcination increased the acid sites and improved the redox ability for Cex–Ti–N catalysts. In addition, it was found that the redox ability was the critical factor, which effectively promoted the low temperature SCR performance. Amongst the Cex–Ti–N catalysts, Ce5–Ti–N revealed the best SCR activity, catalytic stability and resistance to H2O and SO2. This study demonstrated the feasibility of N2 calcination in the syntheses of doped SCR catalysts and also explored the SCR reaction mechanism over the well-reported Cex–Ti catalysts. We expect that this study could shed some light on the development of feasible preparative routes for the syntheses of Metal-Ti catalysts for SCR application.
1. Introduction
NOx emitted from coal-fired power plants remains a major source of photochemical smog, acid rain and the depletion of tropospheric ozone.1 At present, the selective catalytic reduction (SCR) of NOx with NH3 in the presence of excess oxygen on commercial V2O5/WO3 (MoO3)/TiO2 is the most widely used technology for the removal of NOx.2 However, some critical problems, such as a high temperature window (>320 °C) and the toxicity of vanadium species, still exist in the practical applications of vanadium-based catalysts. Considering these disadvantages, many researchers focus on studies to replace the vanadium with other metal elements.3 CeO2–TiO2 based catalysts are considered a potential replacement of V2O5/WO3–TiO2 catalysts due to their excellent NO conversion, high N2 selectivity in SCR and environmentally friendly features.4–7The SCR mechanism of CeO2–TiO2 based catalysts had been widely study, and the excellent performance of cerium oxide catalysts could be attributed to their high oxygen storage capacity, strong interaction with metals, good redox properties (redox couple of Ce3+/Ce4+).8–10 For Ce-doped TiO2 catalysts, the Ce–O–Ti short-range order species with the interaction between Ce and Ti in atomic scale are considered to be the active sites.11–16 To obtain better catalytic activity, many methods that could strengthen the interaction between Ce and Ti in atomic scale have been used to modifying the Ce-doped TiO2 catalysts.16–18 Shan et al. has reported that Fe, Mo and W doping, especially W, could effectively improve the NO removal efficiency of Ce-doped TiO2 catalysts, because the introduction of W species could increase the amount of active sites, oxygen vacancies, and Brønsted and Lewis acid sites over the catalyst.17 According to the studies of Liu et al., the preparative routes of catalysts has significantly effects on its physical/chemical properties, and a strong metal-support interaction for Ce-doped TiO2 catalysts could obtained by using a supercritical water synthesis route.16 Although numerous works having been conducted to strengthen the interaction between Ce and Ti, studies on calcination atmospheres seemed being given very little care. As a matter of fact, the physical/chemical properties of the catalysts are strongly relied on the calcination atmospheres. Thus, researches on the effects of calcination atmospheres on Ce-doped TiO2 catalysts would be very necessary.
Herein, a series of Ce-doped TiO2 catalysts calcined under air or nitrogen atmosphere were prepared by sol–gel method. Catalytic performance test proposed that the Ce-doped TiO2 catalysts calcined in nitrogen atmosphere displayed a higher NO removal efficiency than that calcined under air. To elucidate the effect of calcination atmosphere, XRD, BET, NH3-TPD, H2-TPR, XPS and in situ DRIFT were used to study the structure, surface acidity, redox properties and surface composition of samples. It was found that more Ce species could dope into the TiO2 lattice when calcined under nitrogen atmosphere, thus, more Ce–O–Ti structure were obtained over the Cex–Ti–N surface. This effect could improve the surface area, surface acidity and redox ability. In addition, we made clear the relationship the surface area, surface acidity and redox ability for the SCR activity and found that redox ability was the critical factor, which effectively promoted its SCR performance at low temperature. This information would contribute to a better way to prepare the Ce–Ti catalyst and a better understanding of the SCR processes over Ce system SCR catalysts.
2. Experimental
2.1 Catalysts preparation
The catalysts were prepared by a sol–gel method. A certain nitrate hexahydrate was dissolved into 80 mL ethanol, then 20 mL tetrabutyl titanate were dropped into under vigorous stirring, and then stirring at room temperature for 30 min to obtain solution A. Subsequently, a mixed solution of 20 mL ethanol, 8 mL deionized water and 8 mL acetic acid were dropped into solution A. After stirring at room temperature for 2 h, the solution heat in a water bath at 60 °C to obtain transparent sol. The transparent sol kept at room temperature overnight. Then the gel was dried at 120 °C to form xerogel, and half them calcined at 500 °C in air and N2 atmosphere for 3 h, respectively. Finally, Cex–Ti–A (calcined under air atmosphere, x represent the CeO2 contents in weight) and Cex–Ti–N (calcined under N2 atmosphere) samples were obtained.2.2 Catalytic activity tests
The SCR of NOx was carried out at 120–300 °C in a fixed-bed flow reactor (i.d. 6.8 mm) using 0.2 mL catalyst with 100–120 mesh under atmospheric pressure. The typical reactant gas composition was as follows: 500 ppm NO, 500 ppm NH3, 5% O2 and N2 as the balance gas. Total flow rate was 150 mL min−1, corresponding to a space velocity of about 45![[thin space (1/6-em)]](https://www.rsc.org/images/entities/char_2009.gif) 000 h−1. The concentration of NOx, N2O in the inlet and outlet gas was measured by in situ FT-IR gas analyzer SERVOPRO 4900. The values of NO conversion can be calculated by:
000 h−1. The concentration of NOx, N2O in the inlet and outlet gas was measured by in situ FT-IR gas analyzer SERVOPRO 4900. The values of NO conversion can be calculated by:| NO conversion (%) = ([NO]in − [NOx]out)/NOin × 100% |
2.3 Characterization
The crystal phase composition of samples was determined by X-ray diffraction measurements (Purkinje General Instrument Cu, Ltd, China, XD-3) at room temperature. The Brunauer–Emmett–Teller (BET) surface areas of the products were determined using a nitrogen adsorption analyzer (Quadrasorb-S1, Quantachrome, USA) and the pore-size distribution was estimated by the Barrett–Joyner–Halenda method. X-ray photoelectron spectroscopy (XPS) was carried out on a RBD upgraded PHI-5000C ESCA system (Perkin Elmer) with Mg Kα radiation (hν = 1253.6 eV), calibrated by the C 1s peak at 284.6 eV with an accuracy of ± 0.2 eV.Ammonia temperature-programmed desorption (NH3-TPD) and hydrogen temperature-programmed reduction (H2-TPR) experiments were carried out in quartz U-tube reactor on an automated chemisorption analyzer (Quantachrome Instruments). Each catalyst was preheated at 120 °C for 24 h before TDP and H2-TPR experimental and about 100 mg of sample was used. The TDP experimental began with NH3 adsorption under a flow rate of 60 mL min−1 at room temperature for 1 h. Then the gas was switch to He for 0.5 h. Subsequently, TPD was performed by ramping the temperature at 10 °C min−1 to 800 °C in He (60 mL min−1). In the H2-TPR experimental, the sample was purged with 60 mL min−1 He at 50 °C for 0.5 h and then heating the sample to 800 °C at a rate of 10 °C min−1 after switched to a H2/N2 gas mixture (10% H2, v/v) at a flow rate of 60 mL min−1. The consumption of H2, NH3 was detected by a thermal conductivity detector (TCD).
In situ FTIR experiments were carried out by a Nicolet IZ10 FTIR spectrometer, equipped with a liquid-nitrogen cooled MCT detector. Prior to each experiment, background was taken by recording the IR spectrum of KBr in a N2 stream at 300 °C, and had been deducted for each spectrum. During the experiment, 32 scans were averaged for each IR spectra, which were recorded at a resolution of 4 cm−1. The reaction conditions were as follows: 500 ppm NO, 500 ppm NH3, 5% O2, N2 as the balance gas and a 35 mL min−1 flow rate. Each catalyst was preheated at 300 °C for 60 min in N2, and then cooled to 240 °C in 10 °C min−1. After 30 min, the spectra were recorded as initial spectra. Then the NH3/(NO + O2) were introduced to the gas chamber and the spectra were recorded at the desired time.
3. Result and discussion
3.1 SCR catalytic activity
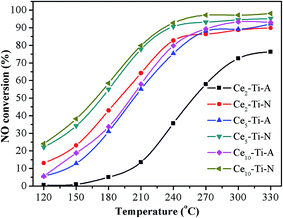
NH3-SCR performances of Ce–Ti–N and Ce–Ti–A catalysts with 2–10% CeO2 were measured as a function of temperature, and the results are shown in Fig. 1. It was obvious that the SCR activity of Cex–Ti–A and Cex–Ti–N increased with the increase of Ce content. Additionally, the NO conversion of Cex–Ti–N catalysts was much more prominent than that of Cex–Ti–A. The NO conversion of Ce5–Ti–N catalyst was 54.9%, 77.8% and 90.7% at 180, 210 and 240 °C, respectively, and it increased by 24.0%, 22.8% and 15.4% compared with Ce5–Ti–A at the same reaction temperatures. Interestingly, the NO removal efficiency over Ce2–Ti–N was even higher than Ce10–Ti–A when the reaction temperature below 240 °C, indicating that content of CeO2 was not the critical factor in determining the catalytic activity of Ce–Ti. According to the previous studies, the Ce–O–Ti short range structure is the active sites for Ce–Ti catalyst in the SCR reaction.11,12,19,20 Hence, more Ce–O–Ti structures might exist in Ce2–Ti–N in comparison with Ce10–Ti–A catalyst. This would be discussed in next sections. The remarkable point was that only a slight amount of N2O (<5 ppm) appeared over all of the catalysts during experiments, indicating that all the prepared catalysts showed a good N2 selectively.3.2 The durability and stability
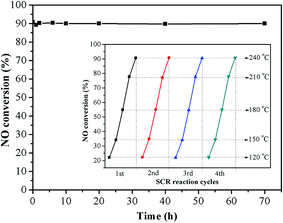
Ce5–Ti–N was chosen as representative for investigating the catalytic stability of Cex–Ti–N catalysts. Fig. 2 shows the durability test results of Ce5–Ti–N. It was clear that no deactivation occurred during 70 h at 240 °C. After that, four SCR reaction cycles at 120–240 °C was carried out. As shown in illustration, the NO conversion was almost same at each cycle. Therefore, the active sites of Ce5–Ti–N catalyst were stable. The resistance to H2O, SO2 at 250 °C was also tested (Fig. S1†). The catalytic activity of Ce5–Ti–N showed a slightly increase after 5% of H2O was introduced. However, the lowest NO conversion with 5% of H2O and 500 ppm SO2 was 68.33%. It was worth noting that as the H2O and SO2 cut off, the catalytic activity of Ce5–Ti–N could recover by raising reaction temperature to 300 °C. Then, as the reaction temperature was reduced back to 250 °C, the NO conversion restored to the initial state and kept stable. The results clearly suggested that the deposit of ammonium sulphate was the main cause for the loss of SCR activity as SO2 was introduced. Therefore, the Ce5–Ti–N catalysts displayed a good resistance to H2O and SO2.3.3 XRD characterization
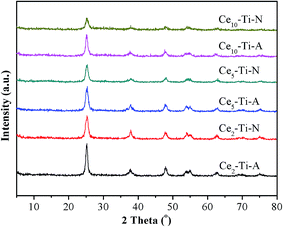
The XRD patterns of prepared catalysts are showed in Fig. 3. For all the catalysts, only anatase phase (2θ = 25.5°, 37.1°, 48.3°, 54.1°, 55.3°, 62.8°, 70.3°, 75.3°) (PDF#21–1272) was observed, indicating that Ce species dispersed well. It can also be seen that the intensity of the peaks due to anatase TiO2 decreased with the accumulation of Ce content. This result means that the interaction between Ce and Ti in atomic scale had a significantly enhancement by increasing the Ce content.4 The previous studies had confirmed that the Ce–Ti catalyst had a higher NO conversion than the supported CeO2/TiO2 catalysts, and the interaction between Ce and Ti in atomic scale was via a Ce–O–Ti short-range order species in Ce-doped TiO2 catalysts, which would significantly improve the NH3-SCR performance.11 Hence, with the increase of Ce content, the higher NH3-SCR performance could be attributed to the accumulation of Ce–O–Ti short-range order species in catalysts. As compared to Cex–Ti–A catalysts, weaker diffraction peaks due to anatase TiO2 could be observed on Cex–Ti–N catalysts. These results meant that the N2 calcination atmosphere could promote the incorporation of Ce species into TiO2 lattice. More Ce–O–Ti structure could form in Cex–Ti–N catalysts, which could significantly improve it's the catalytic activity.3.4 BET results
The BET results of prepared catalysts are summarized in Table 1. In compared with Ce5–Ti catalysts, Ce2–Ti and Ce10–Ti catalysts exhibited a much lower surface area. It indicated that suitable content of Ce doping could effectively improve the specific surface areas of the catalysts, because suitable Ce content could inhibit the agglomeration of the TiO2 crystallites. These results well agreement to the results of previous studies.4,11,17 It was clear that the Ce5–Ti–A had a higher surface area than the Ce2–Ti–N catalyst, but it showed a much lower SCR activity. Therefore, the surface area was not the critical factor to the catalytic activity difference of Cex–Ti–A and Cex–Ti–N catalysts.| Sample | Surface area (m2 g−1) | Pore volume (cm3 g−1) | Pore size (nm) |
|---|---|---|---|
| Ce2–Ti–A | 51.1 | 0.061 | 5.610 |
| Ce2–Ti–N | 109.2 | 0.097 | 5.597 |
| Ce5–Ti–A | 152.7 | 0.308 | 9.519 |
| Ce5–Ti–N | 178.0 | 0.335 | 9.529 |
| Ce10–Ti–A | 106.3 | 0.127 | 4.883 |
| Ce10–Ti–N | 86.2 | 0.105 | 4.893 |
3.5 Raman analysis
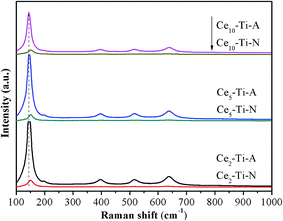
To further investigate the role of the N2 calcination atmosphere in formation of short order Ce–O–Ti species, the catalysts were characterized by Raman. As shown in Fig. 4, all the catalysts only showed Raman-active modes of the anatase phase, indicating that a high dispersion or an incorporation of Ce species into the TiO2 support for the catalysts.21,22 This was well consistent with the result of XRD. As compared to Cex–Ti–A, a slight shift of Eg (TiO2) peak was observed in Cex–Ti–N catalysts, indicating that the interaction between Ce species and TiO2 supports in Cex–Ti–N was stronger than that over Cex–Ti–A catalyst. More importantly, the intensity of Raman peak of Cex–Ti–N catalysts decreased significantly compared with Cex–Ti–A catalysts. In general, the larger of the content of symmetric vibration bonds, the stronger the Raman signal. Therefore, the reduction of Raman signals could be attributed to the decrease of the amount of Ti–O–Ti symmetric vibration, which was resulted from more Ce–O–Ti formation. It suggested that more CeO2 was on Cex–Ti–A catalysts than that of Cex–Ti–N and N2 calcination improved Ce species into TiO2 to form more Ce–O–Ti structure. The decrease of Raman peak of catalysts with lower Ce content in this study was similar to SC-Ce0.25TiO2 (25 wt%) and AM-CeTi (30 mol%) catalysts of previous studies.13,163.6 XPS analysis
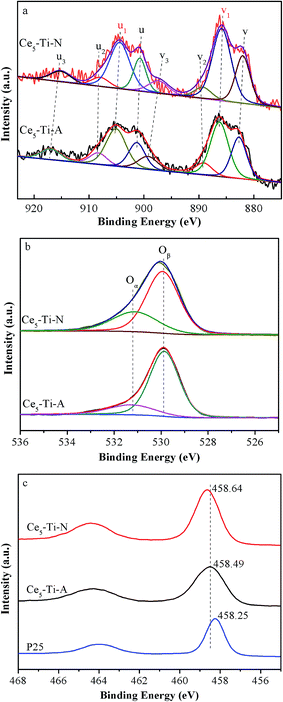
The incorporation of Ce ions into TiO2 lattice would lead to the changes of chemical surrounding of surface species.23,24 To investigate the effects of N2 calcination atmospheres on surface component and chemical state of elements in catalysts, XPS was used. Fig. 5a displays the XPS results of Ti 2p. As compared to P25 (Degussa), the peaks of Ce5–Ti–A catalysts shifted to a high binding energy, indicating that the Ti species of Ce–Ti–A had a lower density of electron cloud than that of TiO2. This result could be attributed to the formation of Ce–O–Ti due to the larger electronegativity of Ce4+ than Ti4+. In comparison to Ce5–Ti–A, a shift to high binding energy was observed in Ce5–Ti–N catalysts. Therefore, it suggested that more Ce–O–Ti species formed in Ce–Ti–N to decrease further density of electron cloud of Ti species. The XPS results of Ce 3d are showed in Fig. 5b and Table 2. The bands labeled as u1 and v1 represent the 3d104f1 states, ascribing to Ce3+, and the other peaks represent the 3d104f0 states of Ce4+.25 It can be seen from Table 2 that the content of CeO2 of Ce5–Ti–N was higher that of Ce5–Ti–A. This result also confirmed that the Ce species well incorporated into the TiO2 lattice in Ce5–Ti–N catalyst. In addition, the ratio of Ce3+ increased from 36.2% in Ce5–Ti–A to 49.2% in Ce5–Ti–N, which indicated that more Ce3+ ions were retained due to the formation of Ce–O–Ti species at nitrogen calcination atmospheres. Liu et al. also confirmed that the incorporation of Ce species into the TiO2 could increase the Ce3+ ratio because of a strong metal-support interaction (SMSI).16 It is well-known that Ce3+ ions play a critical role in the oxygen storage (Ce3+ + O2 → Ce4+ + O2−).26,27 Indeed, as shown in Fig. 5c and Table 2, the fitted O 1s peaks for lattice oxygen Oβ (529.0–530.0 eV), chemisorbed oxygen Oα (531.3–531.9 eV) had revealed that the Oα/(Oα + Oβ) molar ratio in Ce5–Ti–N was much higher than that of Ce5–Ti–A. Since the Oα was conductive to SCR process. Therefore, it was unsurprising given that Ce–Ti–N catalysts had much higher SCR activity than that of Ce–Ti–A catalysts.| Sample | SCe3+/(SCe3+ + SCe4+) | SOα/(SOα + SOβ) | Ce (wt%) |
|---|---|---|---|
| Ce5–Ti–A | 36.2 | 19.6 | 3.87 |
| Ce5–Ti–N | 49.2 | 30.9 | 3.33 |
3.7 H2-TPR analysis
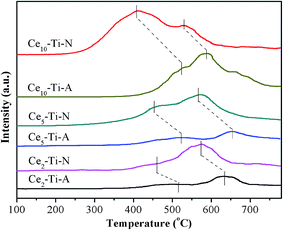
The redox properties of catalysts have been known as a key factor for NH3-SCR of NO, especially at low temperature.28–31 Therefore, the H2-TPR measurement was used to study the redox difference between the Cex–Ti–A and Cex–Ti–N catalysts. The H2-TPR profiles of Cex–Ti–A and Cex–Ti–N are shown in Fig. 6. All catalysts showed two main reduction peaks, and they could be assigned to surface Ce species (at low temperature section) and the bulk Ce species (at high temperature section), respectively.32 The two reduction peaks of Cex–Ti–A were enhanced with the increase of Ce species content, indicating the redox properties of Cex–Ti–A were related to Ce species. For Ce–Ti catalysts, Ce sites were the active redox sites to improve NO oxidation and then enhancing SCR reaction. It was obvious that the reduction peaks area of Cex–Ti–N was higher than that of Cex–Ti–A. Hence, it could be concluded that N2 indeed improved the interaction between Ce and Ti due to more Ce into TiO2, which consistent with Raman and XPS results. More importantly, in comparison to Cex–Ti–A catalysts, the surface Ce species reduction peak of Cex–Ti–N became stronger and shifted to lower temperature section. It proposed that the surface Ce species over Cex–Ti–N samples was more active than Cex–Ti–A. Furthermore, compared to Cex–Ti–A, the reduction peak of bulk Ce species in Cex–Ti–N became stronger and shifted to lower temperature section, indicating that the bulk Ce species on Cex–Ti–N could be easily reduced. These changes revealed that by N2 treatment, the Cex–Ti–N catalysts had better redox properties than Cex–Ti–A. The better redox properties could enhance the NO oxidation that could accelerate the “fast-SCR” reaction. NO oxidation over Cex–Ti–N and Cex–Ti–A would be discussed in next section.3.8 NH3-TPD analysis
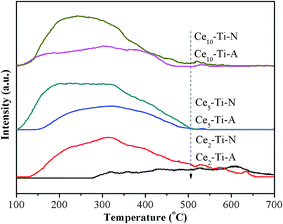
It is well known that the adsorption of NH3 adsorbed on surface acid sites of SCR catalysts also plays a key role in the SCR reaction. Therefore, NH3-TPD measurement was used for studying the total number and strength of the acid sites for Cex–Ti–A and Cex–Ti–N catalysts. The NH3-TPD profiles of Cex–Ti–A and Cex–Ti–N are shown in Fig. 7 and Table 3. All the catalysts displayed broad NH3-desorption patterns between 100 °C and 500 °C. The peak area of NH3-TPD increased with the increase of Ce species content below 5% Ce content for Cex–Ti–A and Cex–Ti–N catalysts, respectively. As Ce content increased to 10%, the total acid sites decreased obviously. It could be found that the catalytic performance of Ce–Ti catalysts decreased with the increase of Ce species content. Thus, the NH3 adsorption was not a critical role in this study. It was worth noting that the changes in the amounts of acid sites were consistent with the change in specific surface area, which proposed that the surface area played an important role in the NH3 adsorption. However, from the Table 1, the surface area of Ce2–Ti–N was less than that of Ce5–Ti–A, but it showed a much higher NH3 desorption peak in comparison with Ce5–Ti–A. Hence, some other factors charge the amounts of NH3 adsorption. Li et al. confirmed that for the Ce–Ti catalyst, the Ti sites in the Ce–O–Ti short range are the acid sites for NH3 adsorption.12 Therefore, the difference of NH3 adsorption between Ce2–Ti–N and Ce5–Ti–A might ascribe to the content of Ce–O–Ti short range. Additionally, this further confirmed that more Ce–O–Ti short range formed by calcining catalyst at the N2 atmosphere.| Sample | Weak acid (100–250 °C) S1/a.u. | Strong acid (>250 °C) S2/a.u. | Total acid S1 + S2/a.u. |
|---|---|---|---|
| Ce2–Ti–A | 0 | 787 | 787 |
| Ce2–Ti–N | 572 | 2124 | 2696 |
| Ce5–Ti–A | 290 | 1054 | 1344 |
| Ce5–Ti–N | 1270 | 1964 | 3234 |
| Ce10–Ti–A | 410 | 817 | 1227 |
| Ce10–Ti–N | 1093 | 1659 | 2752 |
3.9 In situ DRIFT study
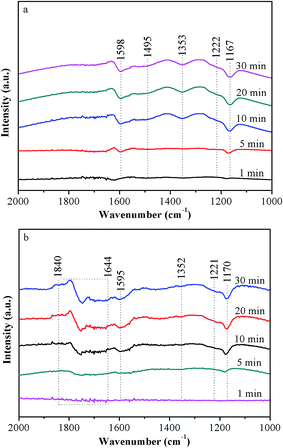
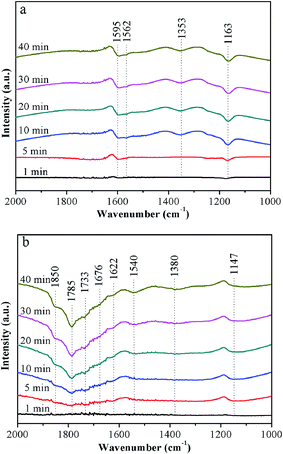
In order to study the differences of NH3 adsorption behaviors between Ce5–Ti–A and Ce5–Ti–N, the in situ DRIFT spectra of NH3 adsorption were recorded at 240 °C. The NH3 adsorption DRIFT spectra results of Ce5–Ti–A and Ce5–Ti–N are shown in Fig. 8a and b, respectively. The triplet peaks located at 3400–3100 cm−1 could be ascribed to the N–H stretching vibration of coordinated NH3, the peaks located at 1850–1640 cm−1 and 1495–1450 cm−1 could be ascribed to ionic NH4+ on Brønsted acid sites, and the peaks located at 1610–1580 cm−1 and 1230–1160 cm−1 could be ascribed to the coordinated NH3 on Lewis acid sites.3,33 Notably, four band at 1598, 1353, 1222 and 1167 cm−1 attributed to Lewis acid sites, and a band at 1495 cm−1 ascribed to Brønsted acid sites could be found in the Ce5–Ti–A spectra. For Ce5–Ti–N, the band at 1495 cm−1 due to Brønsted acid sites was not detected, whereas series band located at 1840–1644 cm−1 because of Brønsted acid sites appearing. Hence, compared to Ce5–Ti–A, the higher NH3 desorption peak could attributed to emergency of new Brønsted acid sites. And these changes might attribute to the formation of a large number of Ce–O–Ti short range structures.In situ DRIFT spectra of NO + O2 adsorption were recorded at 240 °C to investigate the differences of adsorption nitrogen oxide species between Ce5–Ti–A and Ce5–Ti–N, the DRIFT spectra of NO + O2 adsorption were recorded at 240 °C. The DRIFT spectra of NO + O2 on Ce5–Ti are showed in Fig. 9a. According to previous researches,3,33,34 several peaks at 1595, 1562, 1353 and 1163 cm−1 could be assigned to bridging bidentate nitrates (1595 and 1163 cm−1), chelating bidentate nitrates (1562 cm−1) and monodentate nitrates (NO3−) (1353 cm−1), respectively. However, as shown in Fig. 9b, eight peaks located at 1900–1600, 1540, 1380 and 1147 cm−1 could be observed in the DRIFT spectra of NO + O2 on Ce5–Ti–N. The peaks located at 1850 and 1733 cm−1 could be attributed to –NO+ adsorbed on cation sites, the peaks located at 1785 and 1380 cm−1 could be determined as monodentate nitrates (NO3−), the peaks at 1676, 1622 and 1147 cm−1 could be ascribed to bridging bidentate nitrates, and the peaks at 1540 cm−1 could be assigned to chelating bidentate nitrates.34,35 Therefore, compared with Ce5–Ti–A, more nitrates (especially monodentate nitrates) adsorbed on the Ce5–Ti–N sample, which indicated that the NO could be oxidized more easily over Ce5–Ti–N than that of Ce5–Ti–A. Previous studies suggested that redox ability of SCR catalysts resolved to NO oxidation which contributed to the “fast-SCR” route and promoted the DeNOx activity at low temperature. Combined the results of XPS and H2-TPR in this study, the redox ability of Ce5–Ti–N catalysts had been obviously improved due to the strong interaction between Ce and Ti by more Ce species into TiO2. Therefore, NO oxidation was improved over Ce5–Ti–N catalyst, thus, the Ce–Ti–N catalysts had excellent SCR activity at low temperature.
4. Conclusions
In this study, we demonstrated the effect of calcination atmosphere on catalysts for NH3-SCR reaction. The results revealed that the superior catalytic activity of Cex–Ti–N could be attributed to the enhancement of Ce–O–Ti short range species. The nitrogen calcination atmosphere facilitated the incorporation of Ce species into the TiO2 lattice, hence more Ce–O–Ti short range species formed. Simultaneously, more Ce3+ ions retained due to incorporation of Ce species into the TiO2 support, which could yielded enriched oxygen vacancies on catalyst surface incorporation of elements into the support for the catalysts, hence improving their catalytic activity at low temperature.Acknowledgements
This work was financially supported by the Key Project of Chinese National Programs for Research and Development (2016YFC0203800), the National Natural Science Foundation of China (51408309 and 51578288), Science and Technology Support Program of Jiangsu Province (BE2014713), Natural Science Foundation of Jiangsu Province (BK20140777), Industry-Academia Cooperation Innovation Fund Projects of Jiangsu Province (BY2016004-09), Jiangsu Province Scientific and Technological Achievements into a Special Fund Project (BA2015062 and BA2016055), Top-notch Academic Programs Project of Jiangsu Higher Education Institutions, A Project by the Priority Academic Program Development of Jiangsu Higher Education Institutions.References
- H. Bosch and F. Janssen, Catal. Today, 1988, 2, 369–379 CrossRef CAS.
- G. Busca, L. Lietti, G. Ramis and F. Berti, Appl. Catal., B, 1998, 18, 1–36 CrossRef CAS.
- L. A. Chen, J. H. Li and M. F. Ge, Environ. Sci. Technol., 2010, 44, 9590–9596 CrossRef CAS PubMed.
- X. Gao, Y. Jiang, Y. Zhong, Z. Y. Luo and K. F. Cen, J. Hazard. Mater., 2010, 174, 734–739 CrossRef CAS PubMed.
- Z. M. Liu, Y. Yi, J. H. Li, S. I. Woo, B. Y. Wang, X. Z. Cao and Z. X. Li, Chem. Commun., 2013, 49, 7726–7728 RSC.
- Z. M. Liu, S. X. Zhang, J. H. Li and L. L. Ma, Appl. Catal., B, 2014, 144, 90–95 CrossRef CAS.
- W. Shan, F. Liu, H. He, X. Shi and C. Zhang, ChemCatChem, 2011, 3, 1286–1289 CrossRef CAS.
- W. Q. Xu, Y. B. Yu, C. B. Zhang and H. He, Catal. Commun., 2008, 9, 1453–1457 CrossRef CAS.
- S. Watanabe, X. Ma and C. Song, J. Phys. Chem. C, 2009, 113, 14249–14257 CAS.
- Z. Liu, Y. Liu, B. Chen, T. Zhu and L. Ma, Catal. Sci. Technol., 2016, 6, 6688–6696 CAS.
- P. Li, Y. Xin, Q. Li, Z. P. Wang, Z. L. Zhang and L. R. Zheng, Environ. Sci. Technol., 2012, 46, 9600–9605 CrossRef CAS PubMed.
- Q. Li, H. C. Gu, P. Li, Y. H. Zhou, Y. Liu, Z. N. Qi, Y. Xin and Z. L. Zhang, Chin. J. Catal., 2014, 35, 1289–1298 CrossRef CAS.
- J. Ding, Q. Zhong and S. Zhang, Ind. Eng. Chem. Res., 2015, 54, 2012–2022 CrossRef CAS.
- T. Boningari, P. R. Ettireddy, A. Somogyvari, Y. Liu, A. Vorontsov, C. A. McDonald and P. G. Smirniotis, J. Catal., 2015, 325, 145–155 CrossRef CAS.
- J. Fang, X. Bi, D. Si, Z. Jiang and W. Huang, Appl. Surf. Sci., 2007, 253, 8952–8961 CrossRef CAS.
- Y. Liu, W. Y. Yao, X. L. Cao, X. L. Weng, Y. Wang, H. Q. Wang and Z. B. Wu, Appl. Catal., B, 2014, 160, 684–691 CrossRef.
- W. P. Shan, F. D. Liu, H. He, X. Y. Shi and C. B. Zhang, Appl. Catal., B, 2012, 115, 100–106 CrossRef.
- Z. M. Liu, J. Z. Zhu, J. H. Li, L. L. Ma and S. I. Woo, ACS Appl. Mater. Interfaces, 2014, 6, 14500–14508 CAS.
- K. A. Michalow-Mauke, Y. Lu, K. Kowalski, T. Graule, M. Nachtegaal, O. Krocher and D. Ferri, ACS Catal., 2015, 5, 5657–5672 CrossRef CAS.
- L. Zhang, L. L. Li, Y. Cao, X. J. Yao, C. Y. Ge, F. Gao, Y. Deng, C. J. Tang and L. Dong, Appl. Catal., B, 2015, 165, 589–598 CrossRef CAS.
- W. F. Zhang, Y. L. He, M. S. Zhang, Z. Yin and Q. Chen, J. Phys. D: Appl. Phys., 2000, 33, 912 CrossRef CAS.
- G. Vlaic, R. D. Monte, P. Fornasiero, E. Fonda, J. Kašpar and M. Graziani, J. Catal., 1999, 182, 378–389 CrossRef CAS.
- F. M. Gao, D. C. Li and S. Y. Zhang, Acta Metall. Sin., 2001, 37, 445–448 CAS.
- G. Faming and Z. Siyuan, Rare Met., 2002, 21, 299–303 Search PubMed.
- D. Devaiah, D. Jampaiah, P. Saikia and B. M. Reddy, J. Ind. Eng. Chem., 2014, 20, 444–453 CrossRef CAS.
- R. Maache, R. Brahmi, L. Pirault-Roy, S. Ojala and M. Bensitel, Top. Catal., 2013, 56, 658–661 CrossRef CAS.
- N. Kakuta, Y. Kudo, H. Rachi, H. Ohkita and T. Mizushima, Top. Catal., 2007, 42–43, 377–380 CrossRef.
- W. P. Shan and H. Song, Catal. Sci. Technol., 2015, 5, 4280–4288 CAS.
- C. C. Zhou, Y. P. Zhang, X. L. Wang, H. T. Xu, K. Q. Sun and K. Shen, J. Colloid Interface Sci., 2013, 392, 319–324 CrossRef CAS PubMed.
- X. P. Zhang, B. X. Shen, J. H. Chen, J. Cai, C. He and K. Wang, J. Energy Inst., 2013, 86, 119–124 CrossRef CAS.
- E. Tronconi, I. Nova, C. Ciardelli, D. Chatterjee and M. Weibel, J. Catal., 2007, 245, 1–10 CrossRef CAS.
- R. T. Guo, Y. Zhou, W. G. Pan, J. N. Hong, W. L. Zhen, Q. Jin, C. G. Ding and S. Y. Guo, J. Ind. Eng. Chem.d, 2013, 19, 2022–2025 CrossRef CAS.
- L. Zhang, L. L. Li, Y. Cao, Y. Xiong, S. G. Wu, J. F. Sun, C. J. Tang, F. Gao and L. Dong, Catal. Sci. Technol., 2015, 5, 2188–2196 CAS.
- J. B. Yu, Z. Jiang, L. Zhu, Z. P. Hao and Z. P. Xu, J. Phys. Chem. B, 2006, 110, 4291–4300 CrossRef CAS PubMed.
- L. D. Li, F. X. Zhang, N. J. Guan, M. Richter and R. Fricke, Catal. Commun., 2007, 8, 583–588 CrossRef CAS.
Footnote |
| † Electronic supplementary information (ESI) available. See DOI: 10.1039/c7ra03166a |
| This journal is © The Royal Society of Chemistry 2017 |

