 Open Access Article
In situ synthesis and immobilization of a Cu(II)–pyridyl complex on silica microspheres as a novel Fenton-like catalyst for RhB degradation at near-neutral pH†
Wenhua Yuana,
Chaoying Zhanga,
Hong Weib,
Qinqin Wanga and
Kebin Li *a
*a
aCollege of Chemistry & Material Science, Key Laboratory of Synthetic and Natural Function Molecule Chemistry, Ministry of Education, Northwest University, Xi'an 710127, PR China. E-mail: kebin68li@163.com; Tel: +86-132-5988-2543
bState Key Laboratory Base of Eco-Hydraulic Engineering in Arid Areas, Xi'an University of Technology, Xi'an 710048, PR China
First published on 26th April 2017
Abstract
A highly efficient Fenton-like catalyst was successfully developed by covalently immobilizing a Cu(II)–pyridine group complex onto silica microspheres. The catalyst was characterized by SEM, FTIR and XPS measurements. The catalytic activity was evaluated by heterogeneous degradation of Rhodamine B (RhB) with H2O2 in the dark. The effects of pH, catalyst loading, H2O2 concentration, initial dye concentration, and temperature on the degradation kinetics were investigated to optimize operational variables and find the potential mechanisms. It was found that the optimum pH of medium was near neutral, at which over 98% of RhB (5–7.5 mg L−1) was efficiently decolorized in 6 hours with 2 g L−1 catalyst and 200 mg L−1 H2O2. The TOC removal of RhB (10 mg L−1) also reached 72% after the reaction duration. Meanwhile, the acute toxicity of RhB to marine bacteria Vibrio fischeri was almost completely eliminated. The degradation of RhB could be well described with a pseudo-first order kinetic model. The reaction activation energy was approximately 38.60 kJ mol−1. Fluorescence analysis and free radical scavenging experiments were performed, and revealed that the hydroxyl radical was the main active species for RhB degradation. The stability of the catalyst was confirmed by insignificant leaching of copper species and loss of activity after four cycles. Based on these results and the literature, a possible mechanism for RhB degradation was proposed.
1. Introduction
Recently, the presence of refractory organic species in wastewater streams has raised a severe challenge to the conventional biological treatment methods due to their high chemical stability and/or low biodegradability. Therefore, it is highly in demand to develop new technologies which are able to decontaminate biorefractory molecules in wastewater streams.1,2 Many studies up to now have revealed that the advanced oxidation process is a good alternative for treating a wide range and variety of recalcitrant and/or toxic pollutants in the environment.3,4 Advanced oxidation processes are defined as processes that in situ generate hydroxyl radicals (primarily but not exclusively) to oxidize the majority of the complex chemicals present in the effluent water. The ˙OH radical is a powerful oxidizing reagent, which has a very high standard redox potential (1.9–2.8 V), bimolecular reaction rate constants (108–1011 M−1 s−1) and non-selective reactivity, and thus could quickly decompose various organic compounds into smaller molecules and even into less harmful substances such as CO2, H2O and inorganic salts.4 Over the past decades, a variety of AOPs such as photocatalysis, radiation, sonolysis, and Fenton, ozone, and electrochemical oxidation have been established to destroy hazardous pollutants in the environment.4Among various AOPs, Fenton's oxidation has received great attention because of its high efficiency, ease of operation and relatively low operating costs.5–7 The traditional Fenton oxidation process is based on soluble ferrous ion and hydrogen peroxide to generate highly oxidative species, i.e., hydroxyl radicals, according to the Haber–Weiss mechanism following the reaction:6–8
| Fe2+ + H2O2 → Fe3+ + ˙OH + OH− | (1) |
However, homogeneous Fenton process suffers from several drawbacks like difficult regeneration of catalyst, highly acidic environment required for the reaction (pH 2–4), and the necessity of dispose of iron-containing sludge before discharging to receiving waters.5,7 To address these problems, much effort has been devoted to developing the heterogeneous Fenton-like catalysts. A wide range of solid materials, such as iron-containing minerals,3 silica supported iron,9 iron-pillared clays,3,10 iron-exchanged zeolites and resins,11,12 iron oxides,13 FeIII-containing phosphotungstate,14 and iron-based metal–organic framework15 have been tested as Fenton catalysts to accelerate the catalytic decomposition of H2O2.
Although those heterogeneous Fenton agents generally could be applied in a wide-working pH range (pH 3–7), many of them presented weak catalytic activity16 and the better catalytic performance were often need the help of ultrasonic and/or UV light irradiation to accelerate the electron transfer at the interface of catalyst and water.2,3,17 Therefore, searching for the new Fenton-like catalysts with the wider pH range, higher activity, better stability and reusability for decontaminating recalcitrant organic pollutants in water is still hot research topics and challenging tasks.
In addition to the ferrous ion (Fe2+), a number of other metal ions, including Cu+, Ti3+, Cr+, Co2+, were found to have the oxidative features of Fenton's reagent in the presence of hydrogen peroxide.2,18,19 Cu2+/H2O2 systems have been extensively used in organic synthesis.20,21 Cu2+/H2O2 systems were also employed to decompose atrazine, polycyclic aromatic hydrocarbons, and olive mill wastewater.22–24 In addition, Lim and Bali et al. reported that the H2O2/pyridine/Cu(II) systems were very effective in the decolorization of synthetic dyes.25,26 Moreover, copper and copper complexes supported on different supports were employed as potentially catalysts for H2O2 decomposition and the oxidative degradation of organic contaminants and dyes as well.27–30 Compared to the Fe2+/H2O2 system working only in the acidic condition, the Cu2+-based catalysts often work over a broader pH range.2 Furthermore, copper complexes with organic degradation intermediates are easily decomposed by ˙OH, whereas the corresponding Fe3+ complexes are highly stable.2
Inspired by the advantage of Cu-base Fenton-like catalysts, especially the high decolorization efficiency of H2O2/pyridine/Cu2+ system for dye wastewater and the non-enzymatic biological system consisting of Cu2+, pyridine, and inorganic or organic peroxides was able to depolymerise synthetic lignin,31 we expected to construct a new heterogeneous catalyst through anchoring pyridine groups onto silica microspheres followed by post-coordination with copper ions. Compared with the homogenous pyridine and Cu2+ system, the prepared catalyst would be easy recycled and could reduce the secondary pollution caused by copper ions and pyridine. The prepared catalyst was characterized by scanning electron microscopy (SEM), Fourier transform infrared (FTIR), X-ray photoelectron spectroscopy (XPS) analyses. The catalytic activity of the catalyst was evaluated by degradation of dye RhB in the presence of hydrogen peroxide. Rhodamine B (RhB) is chosen as a representative target pollutant based on the considerations as follows: (1) RhB is a widely used in industrial case and laboratory study. Its toxic and carcinogenic effects have been experimentally proven; (2) RhB is very stable under various pH with considerably high resistance to oxidative and photo degradation.9,32 The influences of catalyst loading, hydrogen peroxide and dye concentrations, solution pH, and reaction temperature on RhB degradation efficiency and kinetics were investigated in detail. The mineralization and detoxification of RhB solution by the prepared catalyst/H2O2 system were also investigated. The stability of the catalyst was evaluated by repeating the catalytic degradation of RhB over the prepared catalyst/H2O2 system and determined the leached copper ions. The active species involved in the reaction were confirmed by the photoluminescence technique and the radical scavenging experiments. Moreover, a possible mechanism for RhB degradation over the prepared catalyst and H2O2 was discussed as well. To the best of our knowledge, no study so far has succeeded in designing a heterogeneous Fenton-like catalyst composed of copper and pyridine group for Fenton process.
2. Experimental
2.1 Materials and reagents
All chemicals were used as received without further purification. 2-Aminopyridine (2-APY, >99.0%), and coumarin (>98.0%) were obtained from J&K Scientific Co. (China). Tetraethoxysilane (TEOS, >97.0%), glutaraldehyde (AR, 50% in H2O), dye Rhodamine B (AR grade), hydrogen peroxide (30 wt% aqueous solution), cupric sulfate pentahydrate (>99.0%), 3-aminopropyltriethoxysilane (APTS, >98%), and other chemicals were procured from Sinopharm Chemical Reagent Co., Ltd. (China). Deionized water obtained from the Millipore Mill-Q system was used throughout the study. Before use, the concentration of hydrogen peroxide was standardized by iodimetric titration using sodium thiosulfate standard solution.2.2 Catalyst preparation
2.3 Characterization
Scanning electron microscopy (SEM) was taken on a Hitachi S-570 microscope (Hitachi, Japan). Fourier transform infrared spectra (FTIR) of samples were recorded on a Bruker TENSIR 27 spectrometer (Bruker, Germany) using the pressed KBr disks. The X-ray photoelectron spectroscopy (XPS) was measured on a Thermo Scientific K-Alpha X-ray photoelectron Spectrometer (Thermo Fisher Scientific Ltd, UK) using a monochromatic Al Kα irradiation and low-energy electron flooding for charge compensation. The binding energies were referenced to the C 1s peak at 284.8 eV.2.4 Heterogeneous Fenton-like degradation of RhB
All experiments were carried out in a glass cylindrical reactor (100 mL) which was equipped with a double jacket for circulation of external thermostatic water to keep temperature of the solution at the desired values. The reactor was covered with Al foil to prevent exposure to light. Mixing was achieved by vigorous magnetic stirring at about 500 rpm to avoid concentration gradients. To start each experiment, an appropriate volume of stock solution of RhB and a certain amount of the catalyst were placed into the reactor together, then diluted with deionized water to 50 mL. The pH values of the reaction solutions were adjusted to the desired levels using 1.0 mol L−1 NaOH or HClO4 solution. After the suspension was thoroughly mixed and reached temperature equilibrium, a required amount of H2O2 was added to initiate the reaction. At given time intervals, the samples were taken out from the reactor and centrifuged for separation of the suspended solids, and the supernatant solutions were used to measure the residual RhB concentrations after filtering through a 0.45 μm PVDF membrane. Each experiment was carried out at least thrice to ensure reproducibility of the results, and the average value was reported.During examination of the effects of various operating variables on RhB degradation, the concentration of dye was ranged from 2.5 to 12.5 mg L−1, which is based on the consideration that 5 mg L−1 of RhB was used in several studies on its degradation using AOPs.10,17 It is well-known that the optimum pH for the traditional Fenton oxidation process is around 2.8. However, dye waste effluent is discharged at different pH. Consequently, the effect of pH value was explored in the range of 3 to 9. As for the effect of catalyst loading on RhB degradation, the catalysts concentration of 0.5–4 g L−1 was chosen based on many studies on Fenton-like processes.5 The concentrations of hydrogen peroxide vary in a large range in the different Fenton or Fenton-like processes.5,36 Thus, we changed it from 50 to 300 mg L−1 in this study. As the high reaction temperature means large energy consumption, thus only 20–40 °C reaction temperatures were tested.
The stability of catalyst was evaluated by a sequential cycle experiment. After completion of the reaction, the catalysts were filtered, washed with water, and dried at 70 °C. The recovered catalysts were used in the next reaction under the identical experimental conditions.
2.5 Sample analysis
The concentration of RhB was detected using an ultraviolet-visible spectrophotometer (754 PC, Shanghai Spectrum) at wavelength of 553 nm. Total organic carbon (TOC) was measured with a Shimadzu TOC-L CPN CN200 analyzer. The leached copper ions in the reaction solution after the catalytic degradation of RhB were measured by atomic absorption spectroscopy (Shimadzu AARM-6 spectrophotometer). Hydroxyl radial (˙OH) was detected by the coumarin luminescence probing technique that is based on the reaction of a poor fluorescent molecule coumarin with ˙OH to generate a highly fluorescent 7-hydroxycoumarin.37 The experimental procedure was similar to that used in evaluating catalytic activity of the catalyst except that a certain amount of coumarin (1 × 10⁻³ mol L−1) instead of RhB was added into reaction solution. 7-Hydroxycoumarin was monitored using a HITACHI F-4500 fluorescence spectrophotometer at the excitation wavelength of 335 nm. H2O2 concentration was measured by DPD method.382.6 Toxicity test
The toxicity analysis was carried out on DeltaTox toxicity analyzer (Strategic Diagnostics Inc., US) using luminescent marine bacterium Vibrio fischeri as the test species, and the 81.9% test protocol was followed. Prior to toxicity analysis, the sample was pre-prepared according to the standard operating procedure as described in the Microtox manual. The residual hydrogen peroxide was removed from the solution using catalase. After 5 min incubation of the samples and luminescent bacteria at 15 °C, the photobacteria light emission was determined. At the same time, the control samples were carried out in parallel. The toxicity is quantified as the relative decrease of the photobacteria light emission with respect to the sample control that only contained MicroTox diluent.3. Results and discussion
3.1 Characterization of the catalyst
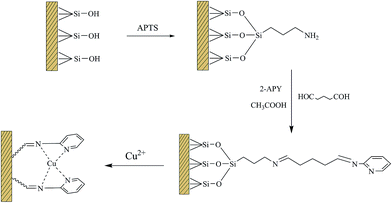
The prepared silica particles were nearly spherical in shape with a mean diameter of 0.82 μm (Fig. S1 and S2 in the ESI†). After silica particles reacted with APTS, amine groups were anchored on their surface through a silylation reaction between the surface hydroxyl groups and APTS. This is confirmed by appearance of N–H deformation peak at 1556 cm−1 and C–H (–CH2CH2CH2NH2 groups) stretching peak at 2941 cm−1 in aminosilane treatment silica particles (Fig. 1b).34,39,40 It is well-known that amino groups can easily react with aldehyde to form Schiff-base, as shown in Scheme 1. FT-IR spectrum of 2-APY modified silica particles in Fig. 1c displays a C![[double bond, length as m-dash]](https://www.rsc.org/images/entities/char_e001.gif) N (Schiff base) absorption peak at 1654 cm−1, and C
N (Schiff base) absorption peak at 1654 cm−1, and C![[double bond, length as m-dash]](https://www.rsc.org/images/entities/char_e001.gif) N and C
N and C![[double bond, length as m-dash]](https://www.rsc.org/images/entities/char_e001.gif) C stretching vibration peaks at 1477 cm−1.41–43 The C
C stretching vibration peaks at 1477 cm−1.41–43 The C![[double bond, length as m-dash]](https://www.rsc.org/images/entities/char_e001.gif) N stretching vibration in pyridine ring was reported locating in the range 1569–1571 cm−1.35,41 Comparing absorption bands of 2-APY modified silica particles with its precursor in this region, the stronger absorption can be seen for 2-APY modified silica particles. This finding may suggest that C
N stretching vibration in pyridine ring was reported locating in the range 1569–1571 cm−1.35,41 Comparing absorption bands of 2-APY modified silica particles with its precursor in this region, the stronger absorption can be seen for 2-APY modified silica particles. This finding may suggest that C![[double bond, length as m-dash]](https://www.rsc.org/images/entities/char_e001.gif) N vibration of pyridine exists. Moreover, the disappearance of the N–H deformation peak at 1556 cm−1 in 2-APY modified silica particles also implies that the pyridine ring has successfully grafted on silica particles through condensation reaction between amine groups and aldehyde groups of glutaraldehyde. After 2-APY modified silica particles were contacted with CuSO4 aqueous solution, the silica particles turned from colorless to pale blue. The FT-IR spectra of 2-APY modified silica particles before and after loading copper ions are shown in Fig. 1c and d. It can be seen that the 2-APY modified silica particles lost the peaks at 1654 cm−1 and at same time appeared a new peak at 1578 cm−1 after loading of copper ions (Fig. 1d). In addition, an absorption peak in 2-APY modified silica particles shifts from 1477 cm−1 to 1483 cm−1 after reaction with copper ions. These results may indicate that N atoms in pyridine ring and in Schiff base took part in coordination with copper ions.
N vibration of pyridine exists. Moreover, the disappearance of the N–H deformation peak at 1556 cm−1 in 2-APY modified silica particles also implies that the pyridine ring has successfully grafted on silica particles through condensation reaction between amine groups and aldehyde groups of glutaraldehyde. After 2-APY modified silica particles were contacted with CuSO4 aqueous solution, the silica particles turned from colorless to pale blue. The FT-IR spectra of 2-APY modified silica particles before and after loading copper ions are shown in Fig. 1c and d. It can be seen that the 2-APY modified silica particles lost the peaks at 1654 cm−1 and at same time appeared a new peak at 1578 cm−1 after loading of copper ions (Fig. 1d). In addition, an absorption peak in 2-APY modified silica particles shifts from 1477 cm−1 to 1483 cm−1 after reaction with copper ions. These results may indicate that N atoms in pyridine ring and in Schiff base took part in coordination with copper ions.
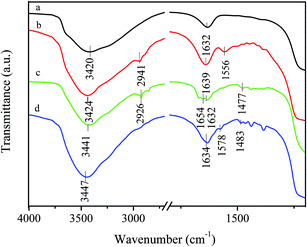 | ||
| Fig. 1 FT-IR spectra of (a) SiO2, (b) APS modified SiO2, (c) 2-APY modified SiO2, and (d) 2-APY modified SiO2 after loading Cu(II). | ||
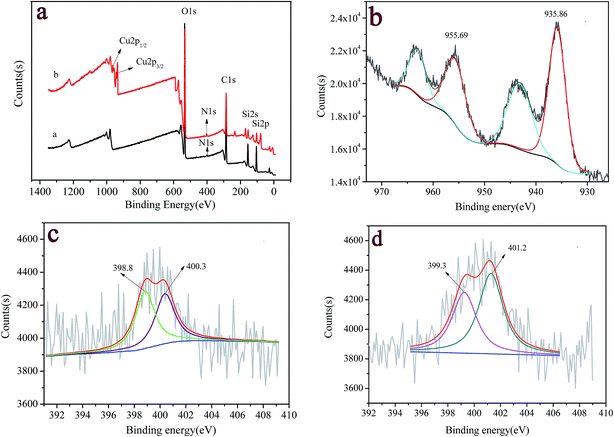
Fig. 2 shows the typical results of XPS spectra for 2-APY modified silica before and after loading copper ions. The peaks at bond energy (BE) of 103 eV, 285 eV, 400 eV, and 534 eV correspond to the Si 2p, C 1s, N 1s, and O 1s spectra, respectively, which exist in all samples (Fig. 2a). It is observed that after loading Cu(II), a new peak with a binding energy of 934.5 eV appeared, which could be assigned to the Cu 2p3/2 orbital. The high resolution XPS spectra of N 1s and Cu 2d regions were used to further clarify the surface functional groups and chemical state of copper element. Fig. 2b shows that the strong Cu 2p1/2 and Cu 2p3/2 peaks occurred at 955.7 and 935.9 eV. The BE of 935.9 eV for Cu 2p3/2 is in agreement with its oxidation states +2, which is further confirmed by two additional satellite bands in the 941–946 eV and 961–965 eV regions.44,45 N 1s core-level spectra are lager bands. The fitting of these peaks shows the presence of various contributions with BEs of 398.8 eV and 400.3 eV in 2-APY modified silica particles (Fig. 2c). The peak with BE of 398.8 eV can be assigned to nitrogen in pyridine groups while the peak with BE of 400.3 eV can be ascribed to nitrogen in primary amines or imines.45–47 After loading copper ions, BEs of N 1s in 2-APY modified silica particles shifted to 399.3 eV and 401.2 eV, respectively (Fig. 2d). The increase in BEs of N 1s indicates that the lone pair electrons in the nitrogen atoms were donated to form a shared bond between Cu(II) ions.45
3.2 Evaluation of the catalytic activity of the prepared catalyst
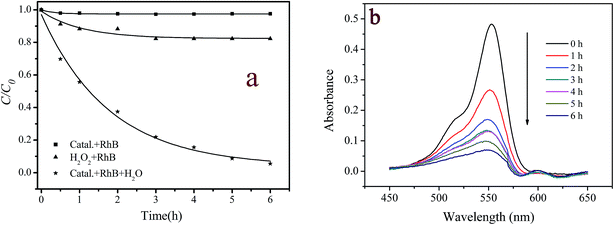
The catalytic activity of the prepared catalyst was evaluated by the oxidative degradation of RhB with hydrogen peroxide. The control experiments, which consisted of RhB/catalyst or RhB/H2O2, were also carried out under the otherwise identical conditions. Fig. 3a displays the experimental results. It is seen that RhB was hardly decomposed in catalyst/RhB and RhB/H2O2 reaction systems. These results suggest that neither the adsorption of RhB on the catalyst nor the direct oxidation by H2O2 was important. However, RhB was significantly degraded in the RhB/H2O2/catalyst system. After 6 hours reaction, 94.6% RhB was decolorized. Meanwhile, 0.38 mg L−1 of copper ions were detected in the reaction solution, accounting for 0.08% of copper loaded on the catalyst. The lower leaching degree of copper ions, on the other hand, indicates that the prepared catalyst was stable. To exclude the catalytic activity was not due to the leached copper ions, 0.4 mg L−1 of copper ions were used to catalyze H2O2 for RhB degradation under otherwise identical conditions. But no significant degradation of RhB was observed during 6 h reaction (the data not shown). Accordingly, the degradation of RhB with H2O2 was mainly dominated by the heterogeneous reaction catalyzed by the prepared catalyst. It should be pointed out that the leached copper ions in the reaction solution were also lower than the discharge standard (∼1 mg L−1) suggested by the Environmental Protection Agency.29 This means the treated contaminants could be directly discharged into the sewage system.Fig. 3b displays the temporal change of UV-vis spectra of RhB in the heterogeneous catalyst/H2O2/RhB system. It is seen that the characteristic band of RhB centered at 553 nm decreased continuously with the reaction time prolonged but did not shift to shorter wavelengths. This finding indicates that the chromophore group in RhB molecule structure was destroyed during the reaction.48,49 As the decolorization of dyes did not mean their complete degradation, the mineralization degree and the toxicity evolution of RhB during the treatment were also monitored by measurement of the changes in TOC and Vibrio fischeri light inhibition for 10 mg L−1 RhB solution. The TOC values of the reaction solution were observed gradual decrease from 7.52 to 2.14 mg L−1 during an 11 hour reaction, i.e., TOC removal achieved 72% (see Fig. S3, ESI†). The original 10 mg L−1 RhB solution was found to be extremely ecotoxic to Vibrio fischeri since bioluminescence was fully inhibited. However, after 8 h of oxidation, the toxicity was almost completely eliminated, as indicated by 8.6% light inhibition (Fig. S3, ESI†). These results demonstrate that the prepared catalyst/H2O2 system not only could fade RhB solution but also could decompose the reaction products completely for the greater part to reduce their toxicity.
3.3 Affecting factors and kinetics
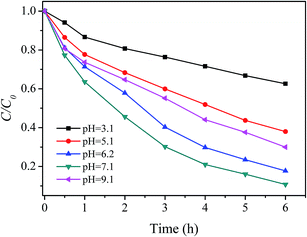 | ||
| Fig. 4 Effect of pH on RhB degradation ([RhB] = 5 mg L−1; [catalyst] = 2 g L−1; [H2O2] = 150 mg L−1; T = 20 °C). | ||
The higher or lower pH resulted in reducing degradation efficiency of RhB in this study could be explained as following: the decrease in rate with increasing proton concentration may be ascribed to the lower deprotonation constant of H2O2 in acid medium as well as to protonation of the dye amino groups. The former effect will lead to a decrease in the possibility of formation of the peroxo-complex by eqn (4) (see below), whereas the latter effect will decrease the possibility of dye molecules accessing catalyst due to the electrostatic repulsion. As a result, the degradation rate of RhB decreased with increasing proton concentration. As for the lower removal rate and efficiency at pH 9.1, several reasons may be contributed to this result together, such as auto-decomposition of H2O2 at alkaline condition, the decrease in the oxidation potential of hydroxyl radical with increasing pH as well as the electrostatic repulsion between the negatively charged the catalyst and dye anionic at alkaline condition.51
 | (2) |
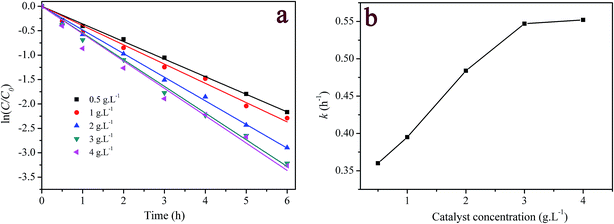
The fitted results are listed in Table S1 (ESI†). Fig. 5b displays the pseudo-first order rate constant (k) as function of catalyst concentration. As seen from Fig. 5b, k increased near linearly with the increase in the catalyst loading up to 3 g L−1. Above this loading, k almost was independent on the concentration of catalyst reaching a maximum. The initial concentration of H2O2 and the available catalyst surface may be responsible for the finding experimental results. Generally, the number of active site increases with increasing catalyst amount. Therefore, the faster degradation of RhB was obtained at the higher concentration of the catalyst. Nevertheless, when catalyst concentration was larger than a certain value, the catalytic performance might be restrained either by the limited H2O2 concentration in the reaction system or by loss of surface active sites available for H2O2 due to agglomeration of catalyst, which could be further corroborated by the decomposition of H2O2 with varying amount of the catalyst in Fig. S4.† Consequently, the addition of higher concentration of catalyst did not obviously improve the degradation rate of RhB. The similar phenomena have been extensively reported in the heterogeneous catalytic processes.9,12,52
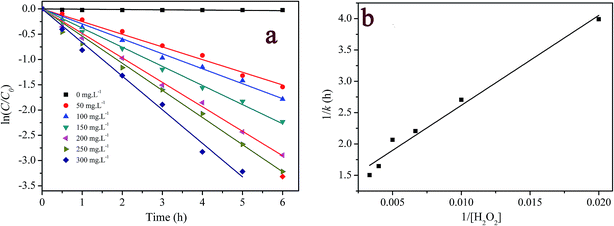 | ||
| Fig. 6 Effect of H2O2 concentration on RhB degradation: (a) first-order plot for dye degradation; (b) a plot of 1/k versus 1/[H2O2]0. ([RhB] = 5 mg L−1; [catalyst] = 2 g L−1; pH = 7.1; T = 20 °C). | ||
When 1/k was plotted against 1/[H2O2]0, a linear relationship was found between both of them (see Fig. 6b), that is, k = 6.97 × 10⁻³ [H2O2]0/(1 + 8.23 × 10⁻³ [H2O2]0). This result indicates that the degradation rate of RhB increased with increasing initial concentration of H2O2 but reached saturation at a high concentration of H2O2. According to this saturation kinetics, we speculated that similar to the enzyme catalytic reaction, H2O2 bound to the catalyst before oxidizing dye. The effect of H2O2 concentration on RhB degradation could be explained as following: the more H2O2 was used, the larger amount of ˙OH would be produced. Therefore, the degradation efficiency and rate increased with the increase in H2O2 concentration. However, when the excessive H2O2 was used, the catalytic active sites on the catalyst might be saturated by H2O2 or ˙OH radicals might be scavenged by excess H2O2 according to eqn (10) forming a less reactive hydroperoxyl radicals. Consequently, the dye removal was less influenced by varying H2O2 concentration at high levels.
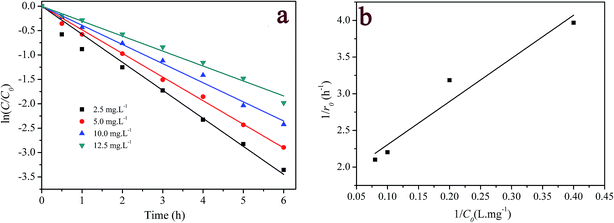
Although decolorization efficiencies decreased with increasing the initial concentration of RhB, the amounts of the degraded RhB increased with the increase in the concentration of RhB. Thus a further analysis was carried out on the initial degradation rate (r0) and the initial dye concentration (C0), where the initial rate was determined from the linear fit of the first three experimental points. Plotting 1/r0 versus 1/C0 gives a straight-line in Fig. 7b, that could expressed as
 | (3) |
Eqn (3) is analogous to the Langmuir–Hinshelwood kinetic model. That is, the initial dye concentration has a first-order dependence on RhB concentration at lower concentration. However, with increases of RhB concentration the order of reaction decreases and almost attains a limiting rate at higher concentrations. As shown in Section 3.2, the adsorption of RhB on the catalyst was negligible. This result could be alternatively explained by the competition among dye and other reactants for a certain amount of the reactive species such as hydroxyl radicals.
3.4 Stability of the catalyst
The stability of the prepared catalyst was evaluated by four consecutive experiments at the same reaction conditions, and the results are shown in Fig. S5.† It is seen that after 4-time recycles the degradation rate of RhB was slightly slowed down. The first-order rate constants changed from 0.484 h−1 (1st cycle), 0.468 h−1 (2nd cycle), 0.387 h−1 (3rd cycle), to 0.378 h−1 (4th cycle). Meanwhile, the degradation efficiency of RhB in the 4th cycle was still larger than 90%. These findings, on the other hand, are consistent with the result obtained in Section 3.2, where the leaching of copper ions was found to be insignificant (about 0.38 mg L−1). Accordingly, it can be concluded that Cu(II)–pyridyl complex immobilized on silica particle is a stable and effective catalyst for destroying organic contaminants with H2O2 at neutral pH conditions. Moreover, the developed catalyst could be easily recycled from the reaction solution by a simple filtration and could reduce the potential pollution caused by copper ions and pyridine in the homogonous Cu(II)/pyridine/H2O2 process.3.5 Reaction mechanisms
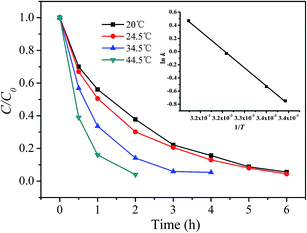
![[thin space (1/6-em)]](https://www.rsc.org/images/entities/char_2009.gif) k versus 1/T, from which the activation energy (Ea) of the reaction was calculated according to the Arrhenius law. Other activation parameters, such as enthalpy (ΔH#) and entropy (ΔS#) of activation were also determined from Eyring's equation and presented in Table S2.† The activation energy of 38.60 kJ mol−1 is smaller than 82.53 kJ mol−1 reported by Gan and Li for the degradation of RhB using rice hull-based silica supported iron as Fenton-like catalyst,9 but larger than 21.8 kJ mol−1 for degradation of Orange II by the photo-assisted Fenton process using Cu/MCM-41 catalyst.29 The negative entropy of activation suggests that an ordered transition state was achieved.
k versus 1/T, from which the activation energy (Ea) of the reaction was calculated according to the Arrhenius law. Other activation parameters, such as enthalpy (ΔH#) and entropy (ΔS#) of activation were also determined from Eyring's equation and presented in Table S2.† The activation energy of 38.60 kJ mol−1 is smaller than 82.53 kJ mol−1 reported by Gan and Li for the degradation of RhB using rice hull-based silica supported iron as Fenton-like catalyst,9 but larger than 21.8 kJ mol−1 for degradation of Orange II by the photo-assisted Fenton process using Cu/MCM-41 catalyst.29 The negative entropy of activation suggests that an ordered transition state was achieved.
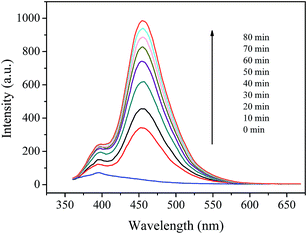 | ||
| Fig. 9 Fluorescence spectral changes of the coumarin solution (1 × 10⁻³ mol L−1) in the presence of 2 g L−1 catalyst and 200 mg L−1 H2O2 at pH 7.1. | ||
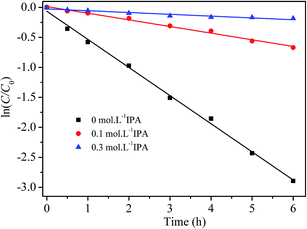
To further verify the oxidative species involved in RhB degradation with H2O2 catalyzed by the prepared catalyst, isopropyl alcohol (IPA), a hydroxyl radical scavenger,17 was added into the reaction solutions, which contained 5 mg L−1 of RhB, 2 g L−1 of catalyst and 200 mg L−1 of H2O2. Fig. 10 displays the experimental results. The degradation of RhB was obviously depressed by the addition of IPA. When 0.1 mol L−1 and 0.3 mol L−1 of IPA were added in RhB/H2O2/catalyst solutions, the pseudo-first order rate constants of RhB degradation were reduced by 77.1% to 0.111 h−1, and by 93.8% to 0.030 h−1, respectively. So it is inferred that ˙OH radicals are main active species for the oxidative degradation of RhB in the prepared catalyst/H2O2 process.
 | (4) |
 | (5) |
 | (6) |
 | (7) |
 | (8) |
 | (9) |
 | (10) |
From eqn (4) the concentration of the peroxo complex is given by
| [S–[CuIILn(HO2−)]+] = K1[S–[CuIILn]2+][H2O2]/[H+], | (11) |
Applying the steady-state approximation for the rate of free radicals and cuprous complex,
 | (12) |
 | (13) |
 | (14) |
Substituting eqn (11) into (13) and meanwhile assuming that k2[H2O2] ≫ k4[˙OH], we get
 | (15) |
In addition, substituting eqn (11) into (14), and assuming that K1[S–[CuIILn]2+]/[H+] ≫ k6[˙OH], we can get
 | (16) |
From eqn (11), (12) and, (16) the concentration of hydroxyl radical is expressed as
 | (17) |
The rate-determining step, eqn (9), expresses the rate equation and is given by
 | (18) |
Thus, by replacement of hydroxyl radical concentration in eqn (18) with (17), the degradation rate of dye can be given as
 | (19) |
Reaction (4) produces the proton while the reaction (6) generates the hydroxyl. Thus, the pH value of reaction solution was little affected by the reaction, which was in accord with less than 0.2 pH unit change observed in each experimental run. Hence, the concentration of the proton in a given experimental condition is approximately constant. From eqn (19), it is expected that when H2O2 concentration is far larger than that of dye the degradation of dye will follow pseudo-first-order kinetics. The apparent first-order rate constant increases with increase of the initial concentration of H2O2 or catalyst and reaches saturation at the larger concentration. However, the increase in dye concentration will reduce the pseudo-first-order constant. In addition, an expression similar to Langmuir–Hinshelwood model could be found between the initial rate and the initial dye concentration. All these predicated results are consistent with the experimental findings. Therefore, the proposed mechanism in some extent is reasonable for explaining degradation of RhB by H2O2 in the presence of the prepared catalyst.
4. Conclusion
In summary, a Cu(II)–pyridyl complex was successfully immobilized on silica particle through chemical bonding. The prepared catalyst was stable and efficient for degradation of RhB with H2O2 at near-neutral pH. The degradation of RhB in the prepared catalyst/H2O2 heterogeneous system depended on solution pH, H2O2 concentration, catalyst loading, initial dye concentration and the reaction temperature. The optimum condition for RhB degradation was found to be: 200 mg L−1 H2O2, 2 g L−1 catalyst, and pH 7.1. Under this condition, the degradation efficiencies of RhB (5–7.5 mg L−1) were more than 98% within 6 hours reaction. The mineralization of RhB also achieved to a large extent. The degradation of RhB could be well described with pseudo-first order kinetic model. The reaction activation energy was about 38.60 kJ mol−1. Hydroxyl radical was the primary active species for RhB degradation. This study further indicates that immobilizing Cu(II)–pyridyl complexes on silica particles would be a good strategy to fabricate the new Fenton-like catalyst for eliminating the refractory organic pollutants in aqueous solution under near-natural condition.Acknowledgements
The authors gratefully acknowledge the financial supports from Open Funding Project of State Key Laboratory Base of Eco-Hydraulic Engineering in Arid Area, Xi'an University of Technology (No. 2016KFKT-3) and Natural Science Basic Research Plan in Shaanxi Province of China (No. 2017JM2035).References
- V. Augugliaro, M. Litter, L. Palmisano and J. Soria, J. Photochem. Photobiol., C, 2006, 7, 127–144 CrossRef CAS.
- A. D. Bokare and W. Choi, J. Hazard. Mater., 2014, 275, 121–135 CrossRef CAS PubMed.
- E. G. Garrido-Ramírez, B. K. G. Theng and M. L. Mora, Appl. Clay Sci., 2010, 47, 182–192 CrossRef.
- J. L. Wang and L. J. Xu, Crit. Rev. Environ. Sci. Technol., 2012, 42, 251–325 CrossRef CAS.
- M. Munoz, Z. M. de Pedro, J. A. Casas and J. J. Rodriguez, Appl. Catal., B, 2015, 176–177, 249–265 CrossRef CAS.
- H. B. Ammar, M. B. Brahim, R. Abdelhédi and Y. Samet, J. Mol. Catal. A: Chem., 2016, 420, 222–227 CrossRef CAS.
- P. V. Nidheesh, RSC Adv., 2015, 5, 40552–40577 RSC.
- W. Shi, D. Du, B. Shen, C. Cui, L. Lu, L. Wang and J. Zhang, ACS Appl. Mater. Interfaces, 2016, 8, 20831–20838 CAS.
- P. P. Gan and S. F. Y. Li, Chem. Eng. J., 2013, 229, 351–363 CrossRef CAS.
- Y. Gao, H. Gan, G. Zhang and Y. Guo, Chem. Eng. J., 2013, 217, 221–230 CrossRef CAS.
- A. Cihanoğlu, G. Gündüz and M. Dükkancı, Appl. Catal., B, 2015, 165, 687–699 CrossRef.
- J. Feng, X. Hu and P. Yue, Chem. Eng. J., 2004, 100, 159–165 CrossRef CAS.
- T. Jiang, A. S. Poyraz, A. Iyer, Y. Zhang, Z. Luo, W. Zhong, R. Miao, A. M. El-Sawy, C. J. Guild, Y. Sun, D. A. Kriz and S. L. Suib, J. Phys. Chem. C, 2015, 119, 10454–10468 CAS.
- H. Chen, L. Zhang, H. Zeng, D. Yin, Q. Zhai, X. Zhao and J. Li, J. Mol. Catal. A: Chem., 2015, 406, 72–77 CrossRef CAS.
- Y. Li, H. Liu, W. J. Li, F. Y. Zhao and W. J. Ruan, RSC Adv., 2016, 6, 6756–6760 RSC.
- Y. Wang, H. Zhao, M. Li, J. Fan and G. Zhao, Appl. Catal., B, 2014, 147, 534–545 CrossRef CAS.
- L. Zhang, Y. Nie, C. Hu and J. Qu, Appl. Catal., B, 2012, 125, 418–424 CrossRef CAS.
- S. Goldstein, D. Meyerstein and G. Czapski, Free Radical Biol. Med., 1993, 15, 435–445 CrossRef CAS PubMed.
- P. Mahamallika and A. Pal, RSC Adv., 2016, 6, 100876–100890 RSC.
- X. G. Meng, J. Zhu, J. Yan, J. Q. Xie, X. M. Kou, X. F. Kuang, L. F. Yu and X. C. Zeng, J. Chem. Technol. Biotechnol., 2006, 81, 2–7 CrossRef CAS.
- D. H. R. Barton, N. C. Delanghe and I. IenriPatin, Tetrahedron, 1997, 53, 16017–16028 CrossRef CAS.
- J. Gabriel, V. Shah, K. Nesmi Rak, P. Baldrian and F. Nerud, Folia Microbiol., 2000, 45, 573–575 CrossRef CAS.
- H. Iboukhoulef, A. Amrane and H. Kadi, Environ. Technol., 2013, 34, 853–860 CrossRef CAS PubMed.
- A. Anglada, A. Urtiaga, I. Ortiz, D. Mantzavinos and E. Diamadopoulos, Waste Manage., 2011, 31, 1833–1840 CrossRef CAS PubMed.
- C. L. Lim, N. Morad, T. T. Teng and N. Ismail, J. Hazard. Mater., 2009, 168, 383–389 CrossRef CAS PubMed.
- U. Bali and B. Karagözoğlu, Dyes Pigm., 2007, 73, 133–140 CrossRef CAS.
- A. H. Gemeay, I. A. Mansour, R. G. El-Sharkawy and A. B. Zaki, J. Mol. Catal. A: Chem., 2003, 193, 109–120 CrossRef CAS.
- L. Lyu, L. Zhang, Q. Wang, Y. Nie and C. Hu, Environ. Sci. Technol., 2015, 49, 8639–8647 CrossRef PubMed.
- F. L. Y. Lam, A. C. K. Yip and X. Hu, Ind. Eng. Chem. Res., 2007, 46, 3328–3333 CrossRef CAS.
- A. C. Pradhan, B. Nanda, K. M. Parida and M. Das, Dalton Trans., 2013, 42, 558–566 RSC.
- T. Watanabe, K. Koller and K. Messner, J. Biotechnol., 1998, 62, 221–230 CrossRef CAS PubMed.
- M. Das and K. G. Bhattacharyya, J. Mol. Catal. A: Chem., 2014, 391, 121–129 CrossRef CAS.
- K. S. Rao, K. El-Hami, T. Kodaki, K. Matsushige and K. Makino, J. Colloid Interface Sci., 2005, 289, 125–131 CrossRef CAS PubMed.
- V. Hernández-Morales, R. Nava, Y. J. Acosta-Silva, S. A. Macías-Sánchez, J. J. Pérez-Bueno and B. Pawelec, Microporous Mesoporous Mater., 2012, 160, 133–142 CrossRef.
- M. Arshadi, M. Ghiaci and A. Gil, Ind. Eng. Chem. Res., 2011, 50, 13628–13635 CrossRef CAS.
- J. Wang, C. Liu, L. Tong, J. Li, R. Luo, J. Qi, Y. Lia and L. Wang, RSC Adv., 2015, 5, 69593–69605 RSC.
- J. Bandara, C. C. Hadapangoda and W. G. Jayasekera, Appl. Catal., B, 2004, 50, 83–88 CrossRef CAS.
- H. Bader, V. Sturzenegger and J. Hoigné, Water Res., 1998, 22, 1109–1115 CrossRef.
- N. M. Mahmoodi and F. Najafi, Microporous Mesoporous Mater., 2012, 156, 153–160 CrossRef CAS.
- X. Huang, X. Chang, Q. He, Y. Cui, Y. Zhai and N. Jiang, J. Hazard. Mater., 2008, 157, 154–160 CrossRef CAS PubMed.
- R. Chen and S. F. Mapolie, J. Mol. Catal. A: Chem., 2003, 193, 33–40 CrossRef CAS.
- M. Lagasi and P. Moggi, J. Mol. Catal. A: Chem., 2002, 182–183, 61–72 CrossRef CAS.
- A. Golcu, M. Tumer, H. Demirelli and R. A. Wheatley, Inorg. Chim. Acta, 2005, 358, 1785–1797 CrossRef CAS.
- L. Meda, G. Ranghino, G. Moretti and G. F. Cerofolini, Surf. Interface Anal., 2002, 33, 516–521 CrossRef CAS.
- R. S. Vieira, M. L. M. Oliveira, E. Guibal, E. Rodríguez-Castellón and M. M. Beppu, Colloids Surf., A, 2011, 374, 108–114 CrossRef CAS.
- A. R. Silva, M. Martins, M. M. A. Freitas, J. L. Figueiredo, C. Freire and B. de Castro, Eur. J. Inorg. Chem., 2004, 2004, 2027–2035 CrossRef.
- M. K. Bayazit, L. S. Clarke, K. S. Coleman and N. Clarke, J. Am. Chem. Soc., 2010, 132, 15814–15819 CrossRef CAS PubMed.
- J. Zhuang, W. Dai, Q. Tian, Z. Li, L. Xie, J. Wang, P. Liu, X. Shi and D. Wang, Langmuir, 2010, 26, 9686–9694 CrossRef CAS PubMed.
- W. Zhou, H. Q. Zhao, J. H. Gao, X. X. Meng, S. H. Wua and Y. K. Qina, RSC Adv., 2016, 6, 108791–108800 RSC.
- J. Feng, X. Hu, P. L. Yue, H. Y. Zhu and G. Q. Lu, Ind. Eng. Chem. Res., 2003, 42, 2058–2066 CrossRef CAS.
- J. H. Ramirez, C. A. Costa, L. M. Madeira, G. Mata, M. A. Vicente, M. L. Rojas-Cervantes, A. J. López-Peinado and R. M. Martín-Aranda, Appl. Catal., B, 2007, 71, 44–56 CrossRef CAS.
- N. N. Fathima, R. Aravindhan, J. R. Rao and B. U. Nair, Chemosphere, 2008, 70, 1146–1151 CrossRef CAS PubMed.
- S. Sakthivel, B. Neppolian, M. V. Shankar, B. Arabindoo, M. Palanichamy and V. Murugesan, Sol. Energy Mater. Sol. Cells, 2003, 77, 65–82 CrossRef CAS.
- K.-i. Ishibashi, A. Fujishima, T. Watanabe and K. Hashimoto, Electrochem. Commun., 2000, 2, 207–210 CrossRef CAS.
- P. Baldrian, T. Cajthaml, V. Merhautová, J. Gabriel, F. Nerud, P. Stopka, M. Hrubý and M. J. Beneš, Appl. Catal., B, 2005, 59, 267–274 CrossRef CAS.
- I. A. Salem, Chemosphere, 2001, 44, 1109–1119 CrossRef CAS PubMed.
- L. Pecci, G. Montefoschi and D. Cavallini, Biochem. Biophys. Res. Commun., 1997, 235, 264–267 CrossRef CAS PubMed.
Footnote |
| † Electronic supplementary information (ESI) available. See DOI: 10.1039/c7ra02916k |
| This journal is © The Royal Society of Chemistry 2017 |

