DOI:
10.1039/C7RA00670E
(Paper)
RSC Adv., 2017,
7, 22836-22844
The properties and catalytic performance of PtSn/Mg(x-Ga)AlO catalysts for ethane dehydrogenation†
Received
16th January 2017
, Accepted 28th March 2017
First published on 25th April 2017
Abstract
Mg(Ga)AlO hydrotalcite materials with different Ga contents are synthesized via the coprecipitation method and then used as supports for PtSn/Mg(x-Ga)AlO catalysts, in which Pt and Sn nanoparticles are deposited via the anion exchange method. The results indicate that a suitable content of Ga evidently enhances the performances and stability of ethane dehydrogenation for the PtSn/Mg(x-Ga)AlO catalysts. The SBET of the catalyst increases with the addition of Ga (2–4.5 wt%). The total acidity and strong acid sites decrease significantly when a small quantity of Ga is added. It is favorable for the catalysts to possess a smaller size and better distribution of Pt particles. Moreover, a suitable content of Ga enhances the interaction between Sn and the support and inhibits the reduction of oxidized Sn species, which is helpful to enhance the interaction between the Pt and Sn atoms. The PtSn/Mg(2-Ga)AlO catalyst exhibits the best performance of all the catalysts during the ethane dehydrogenation reaction, with an average ethane conversion of 25.4% for a period of 2 h. No evident activity decrease is observed after 4 cycles of 2 h testing.
1. Introduction
Recently, the demand for light olefins has gradually increased due to their wide use as building blocks in the chemical industry. Steam cracking and fluid catalytic cracking of crude-oil-derived naphtha and other oil byproducts are the traditional methods to obtain light olefins.1–4 Compared with the traditional methods, the catalytic dehydrogenation of light alkanes exhibits numerous advantages and is more economic and environmentally friendly.5 However, catalytic dehydrogenation is an endothermic process, and in order to obtain a high yield of olefin, the reaction must be carried out at a relatively high temperature, resulting in the sintering of Pt particles and undesirable side reactions, which are the main reasons for the deactivation of the catalyst.6,7 Therefore, the development of catalysts with high activity, stability and selectivity is very important.
The performance of catalysts is greatly impacted by their support.8,9 Al2O3 is suggested as a potential support because of its unique physical properties, such as large surface area and tunable pore size over a wide range. However, since alumina is a type of acidic oxide, deactivation and low selectivity are unavoidable due to its intrinsic strong acid sites. A great amount of research has shown that non-acidic supports, including K–L zeolite, spinels, alkali doped alumina, and calcined hydrotalcite, can greatly enhance the desorption of alkenes and minimize coke formation.10–12 Among them, calcined hydrotalcite or hydrotalcite-like compounds are seen as ideal supports because they have moderately basic character, high thermal stability and high metal dispersion.13,14 MgAlO hydrotalcite is a type of layered double hydroxide (LDH), where in the hydrotalcite structure, some Mg2+ ions are replaced by Al3+ ions, forming positively charged layers. The positive charge is balanced by interlayer anions such as CO32−, which are situated between the brucite-like layers. Some divalent and trivalent metal cations can form the same structure as that of hydrotalcite, and is called a hydrotalcite-like compound.15 It is generally accepted that the ordered crystal structure of LDHs is formed by the supramolecular interactions between the host metal layers and the guest interlayer anions, and this determines the exchangeability of the interlayer anions.16,17 LDHs with different interlayer inorganic or organic anions can be obtained via the ion exchange method, which is useful for the precise synthesis of catalysts.18
Platinum is known as the most effective metal for the dehydrogenation of light alkanes.19 However, without modifiers monometallic Pt supported catalysts exhibit low olefin selectivity and deactivate quickly due to the sintering of Pt particles and rapid coke formation.20,21 To improve the catalyst performance, some bimetallic catalysts were synthesized using doping promoting elements such as Sn, In, Ga, Mn, Zn and Ca.22,23 Among them, Pt–Sn supported catalysts have been widely researched. The influence of Sn on Pt has been attributed to both geometric and electronic effects.6 It is well known that the addition of Sn is beneficial for Pt supported catalysts to form smaller Pt particles and a more uniform distribution, reducing the surface Lewis acid sites of the catalysts. Moreover, Sn can also change the interaction between Pt and the support and enhance catalytic stability.24,25
Although much attention has been given to Sn as a promoting element, studies have also found that Ga is an effective promoter for propane dehydrogenation.26,27 Jablonski et al.28 synthesized a PtGa/Al2O3 catalyst that exhibited higher activity and stability than the Pt/Al2O3 catalyst, and they also found that the catalyst deactivation and carbon deposition were restrained by the addition of Ga. Sun et al.29,30 synthesized a Pt/Mg(Ga)AlO catalyst using a hydrotalcite material (Mg(Ga)AlO) as the support, and they found that the performance of the catalyst was strongly influenced by the Ga content. Redekop et al.31 proved that Ga migrates from the surface of the support to the supported Pt nanoparticles to form Pt–Ga alloys, which can make the catalyst more selective and less prone to coking. Homs et al.32 studied a silica supported PtSn alloy doped with Ga, and observed the electronic modification of the platinum by the Pt–Ga interaction. Wang et al.33 researched the effect of Ga doping on Pt/CeO2–Al2O3 catalysts for propane dehydrogenation, and they found that Ga improves propylene desorption and greatly suppresses deep dehydrogenation and coke formation. Shao et al.34 studied the properties and catalytic performance of Ga2O3-based catalysts for the propane dehydrogenation reaction, where the initial propane conversion of the 5Ga2O3/ZSM-5 catalyst reached up to 78.1% at 620 °C and atmospheric pressure.
Since Sn and Ga both have distinct positive effects on the catalyst performance in the dehydrogenation of light alkanes and the synergistic effect between Pt, Sn and Ga is not well studied, herein, a series of hydrotalcite-like materials (Mg(Ga)AlO) is synthesized via the coprecipitation method with different contents of Ga. Pt and Sn nanoparticles are dispersed via the anion exchange method and then applied to the ethane dehydrogenation reaction after reduction. The synthesized catalysts are characterized via several analytical techniques. In addition, the influence of Ga loading on the catalytic performance of the PtSn/Mg(x-Ga)AlO catalysts for the ethane dehydrogenation reaction is investigated.
2. Experimental
2.1. Preparation of Mg(x-Ga)AlO supports
The hydrotalcite-like support was synthesized via the coprecipitation method.35 Briefly, an appropriate amount (Mg2+/Al3+ = 2; the loading of Ga was 0, 0.75, 2, 3 and 4.5 wt%) of Mg(NO)2·6H2O, Al(NO)3·9H2O and Ga(NO)3·9H2O were dissolved in 100 mL deionized water to form a mixed metal nitrate solution. Equal volumes of 1.0 M Na2CO3 and 2.0 M NaOH were mixed to form a mixed base solution. Then, these two solutions were mixed by dropwise addition to a reaction vessel containing 200 mL deionized water that was adjusted to pH 10.0 using the mixed base solution in advance. The reaction pH was maintained at 10.0, and the reaction was stirred heavily for the entire process. The entire procedure was carried out at room temperature. Once all of the mixed metal nitrate solution was consumed, an additional amount of 2.0 M NaOH was added to keep the reaction pH at 10.0 for the rest of the precipitation reaction. The mixture was then aged for 12 h at 100 °C with strong stirring. The resulting suspension was filtered, washed with deionized water to neutrality, and dried overnight in air at 100 °C. The dried material was described as hydrotalcite-like Mg(x-Ga)AlO support, where x represents the mass percentage of Ga in the catalysts.
2.2. Preparation of PtSn/Mg(x-Ga)AlO catalysts
PtSn/Mg(x-Ga)AlO catalysts were prepared via the anion exchange method.36,37 In this method, appropriate amounts (depending on the Pt/Sn molar ratio and Pt wt%) of K2PtCl6 and Na2SnO3 were dissolved in 50 mL deionized water, and the mixed solution was heated at 70 °C. Next, 1 g dried hydrotalcite Mg(x-Ga)AlO was added to the mixed solution and stirred vigorously for 24 h at 70 °C to allow PtCl62− and SnO32− to sufficiently exchange with CO32−. After that, the suspension was filtered, washed and dried overnight in air at 100 °C. Then, the samples were reduced by hydrogen at 600 °C to obtain the PtSn/Mg(x-Ga)AlO catalysts. The contents of Pt and Sn were 0.5 wt% and 0.25 wt%.
2.3. Catalyst characterization
2.3.1. XRD. The crystallographic phases of all the supports and catalysts were confirmed by XRD measurements on an X'Pert Pro MPD diffractometer (PW 3040/60) with Cu Kα radiation (0.15 nm), operating at 40 kV and 100 mA. The scanning mode was set at a step of 0.02° and a step counting time of 10 s in the 2θ range from 5° to 80°. The XRD patterns of known compounds are referenced by their corresponding number in the Powder Diffraction File (PDF) database.
2.3.2. BET. N2 adsorption–desorption at liquid nitrogen temperature was used to measure the textural properties of the PtSn/Mg(x-Ga)(Al)O catalysts on an automatic analyzer (ASAP 2010, Micrometritics, USA). Before adsorption, the samples were degassed for 10 h at 300 °C. The BET (Brunauer–Emmett–Teller) surface areas of the samples were calculated using the BET multi-points method. The porous volumes were calculated using the BJH (Barrett–Joyner–Halenda) method with Halsey equation for multilayer thickness.
2.3.3. NH3-TPD. Temperature programmed desorption of ammonia (NH3-TPD) measurements were implemented to analyze the acidity of the catalysts. About 0.1 g sample was placed in a quartz reactor between two quartz wool plugs. Before NH3 adsorption, the sample was reduced by hydrogen (H2/Ar = 1/19, 30 mL min−1) at 600 °C for 1 h. Then, the sample was saturated with NH3 at 120 °C. Subsequently, a thermal conductivity detector (TCD) was used to detect the NH3-TPD profile from 120 to 600 °C at the rate of 5 °C min−1.
2.3.4. XPS. XPS (X-ray photoelectron spectroscopy) measurements were conducted on an ESCALAB 250Xi spectrometer (Thermo Electron Corp. Altrincham, UK) with an Al Kα source (1486.6 eV), and all the binding energies of Sn were revised according to the C 1s peak at 284.8 eV.
2.3.5. SEM. The morphologies of the catalysts were examined via field emission scanning electron microscopy (SEM, SU-70) operated at 5.0 kV.
2.3.6. TEM. Transmission electron microscopy (TEM) images of the catalysts were taken with a JEM-20100F microscope operated at 200 kV. The samples after reductive treatment were dispersed and sonicated in ethanol. Then, a small drop of the dispersion was placed on a carbon film coated copper grid, and dried in air before testing. More than one hundred individual metal particles were collected for the determination of average particle size of each sample.
2.4. Direct dehydrogenation of ethane
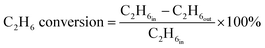
The ethane direct dehydrogenation reactions of the different catalysts were carried out in a fixed-bed quartz reactor with an inner diameter of 8 mm under atmospheric pressure. The catalyst (100 mg) was placed in the center of reactor and reduced in an atmosphere of 10% H2/N2 at 600 °C for 3 h. Then, a feed containing C2H6 and N2 (molar ratio of C2H6/N2 = 0.25, WHSV = 12.9 h−1) was used to determine the activity, selectivity and stability of all the PtSn/Mg(x-Ga)AlO catalysts. The ethane dehydrogenation reactions were carried out at 550 °C. The reaction products were analyzed online using a gas chromatography-mass spectrometer (GC-MS, Agilent 7890B). A flame ionization detector (FID) was used to quantify the concentrations of all organic compounds eluting from the capillary column. A thermal conductivity detector (TCD) was used to quantify H2, CO and N2. The ethane conversion and ethylene selectivity are defined as follows:| |
 | (1) |
| |
 | (2) |
where C2H6in and C2H6out are the ethane content in the feed and exit gases, respectively, and C2H4out is the ethylene content in the exit gas.
3. Results and discussion
3.1. Characterization of the samples
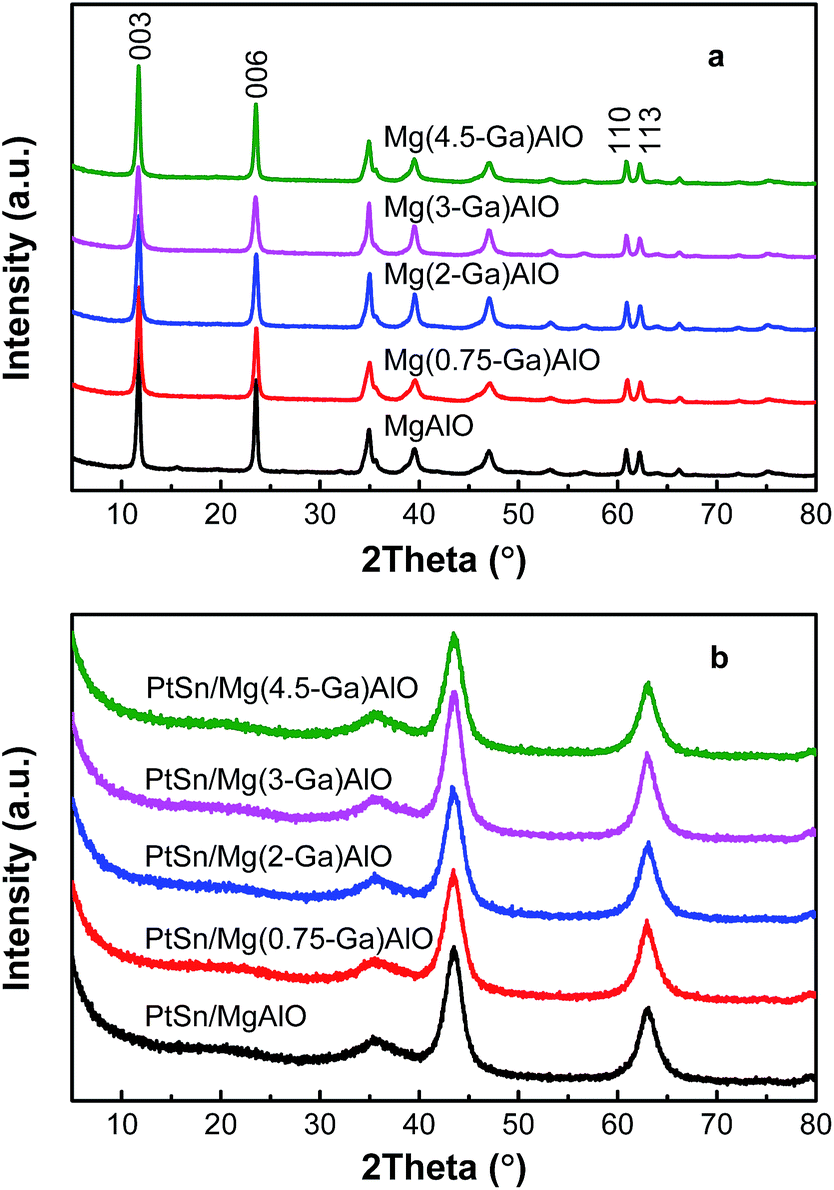
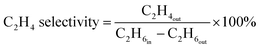
3.1.1. XRD patterns of the samples. Fig. 1a shows the XRD patterns of the different hydrotalcite-like Mg(x-Ga)AlO. Notably, the diffraction peaks of (003), (006), (110) and (113) are detected over the hydrotalcite-like Mg(x-Ga)AlO, which can be ascribed to the characteristic peaks of hydrotalcite materials.38 All the diffraction peaks are very narrow and sharp, which reflect high crystallinity and good hydrotalcite structure. The basal spacing of (003) is about 0.75–0.76 nm, which indicates that CO32− is the interlayer anion. There is no difference in the distance of the (110) plane for all the samples which is a reflection of the average charge of the metal cations.
 |
| | Fig. 1 X-ray diffraction patterns for (a) hydrotalcite-like Mg(x-Ga)AlO and (b) PtSn/Mg(x-Ga)AlO catalysts. | |
The XRD patterns of the catalysts are illustrated in Fig. 1b. As can be seen, all the characteristic diffraction peaks of the hydrotalcite material disappear and only characteristic diffraction peaks corresponding to MgO are observed. The reason for this is that the structure changes from a two-dimensional layered structure to a three-dimensional structure. The diffraction peaks of Al, Ga, Al2O3 or Ga2O3 species were not detected for all the catalysts because Al and Ga are highly dispersed in the LDHs during the synthetic process and located in the interstitial sites in the MgO framework after calcination;39 thus the crystal structure of MgO was not destroyed by the addition of Al and Ga. Moreover, the diffraction peaks of Pt and Sn species are also not detected since their small particle size and/or low concentration is lower than the XRD detection limitation.40
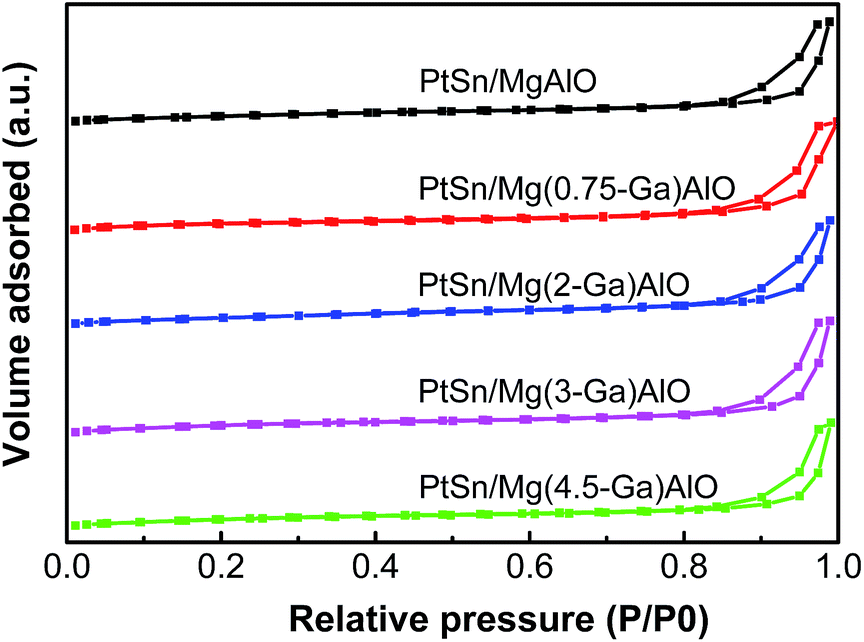
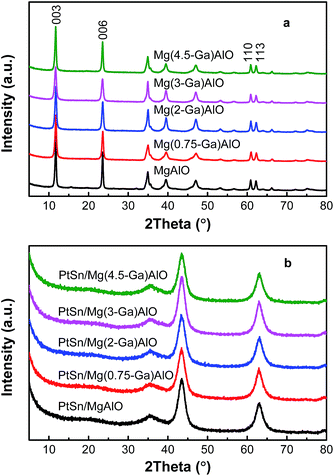
3.1.2. Textural properties of the samples. Low temperature nitrogen adsorption–desorption experiments were carried out to determine the textural properties of the PtSn/Mg(x-Ga)AlO catalysts. As can be seen from Fig. 2, all the catalysts exhibit the same typical type IV adsorption isotherms, which indicate typical mesoporous materials.41 The textural properties are shown in Table 1. It can be noted that, when the Ga content increases from 0.75% to 2%, there is a great increase in SBET and Vp, which indicates that the structure of the catalysts was changed to some extent, thus making it easier for hydrotalcite to form thin sheet particles, resulting in an increase in SBET and Vp.
 |
| | Fig. 2 Low temperature N2 adsorption–desorption isotherms of the PtSn/Mg(x-Ga)AlO catalysts. | |
Table 1 Compositions and textural properties of the PtSn/Mg(x-Ga)AlO catalysts
| Catalyst |
Loadings (wt%) |
SBET (m2 g−1) |
Vp (cm3 g−1) |
| Pt |
Sn |
| PtSn/MgAlO |
0.34 |
0.19 |
212.7 |
0.80 |
| PtSn/Mg(0.75-Ga)AlO |
0.49 |
0.21 |
215.8 |
0.75 |
| PtSn/Mg(2-Ga)AlO |
0.47 |
0.21 |
276.4 |
0.96 |
| PtSn/Mg(3-Ga)AlO |
0.49 |
0.22 |
273.3 |
0.94 |
| PtSn/Mg(4.5-Ga)AlO |
0.46 |
0.20 |
278.2 |
0.96 |
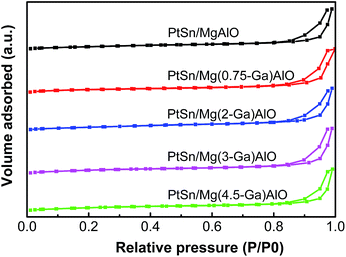
3.1.3. Surface acidity analysis. It was reported that the catalyst performance for ethane dehydrogenation is closely related to the number and strength of acid sites on the catalyst surface, particularly strong acid sites which are the main reason for side reactions (cracking, isomerization and polymerization).23,42 The acidic properties of the catalysts were investigated via temperature programmed desorption of NH3 (NH3-TPD). The NH3-TPD curves of the PtSn/Mg(x-Ga)AlO catalysts are illustrated in Fig. 3. The semi-quantitative analysis of the acidity strength distribution was acquired using the Gaussian curve fitting method.43 The total acidity and acidity strength distribution of the catalysts is listed in Table 2. As can be seen from Fig. 3, all the catalysts exhibit a similar broad desorption shape consisting of three peaks at around 220 °C, 320 °C and 450 °C. According to a previous study, the three fitted peaks are regarded as weak, medium, and strong acid sites, respectively, which should be attributed to the Lewis acidity of the MgO–Al2O3 mixed oxide.44 From Table 2, it can be noticed that when a small quantity of Ga was added, the total acidity and the fraction of strong acid sites distinctly decreased. The PtSn/Mg(0.75-Ga)AlO catalyst exhibits the lowest total acidity and the PtSn/Mg(2-Ga)AlO catalyst possesses the lowest fraction of strong acid sites. It must be noted that the values increase with an increase in Ga content; therefore the PtSn/Mg(4.5-Ga)AlO catalyst has the highest total acidity and the highest fraction of strong acid sites. This can be explained by the fact that Ga is a type of alkali and can reduce the acidity of the catalysts.45 In turn, the excess Ga replaces Mg, and this leads to an increase in acidity. These results suggest that the content of Ga can markedly influence the acidity of the catalysts. The PtSn/Mg(2-Ga)AlO catalyst possesses the lowest fraction of strong acid sites and relatively low total acidity.
 |
| | Fig. 3 NH3-TPD profiles of the PtSn/Mg(x-Ga)AlO catalysts: (a) PtSn/MgAlO, (b) PtSn/Mg(0.75-Ga)AlO, (c) PtSn/Mg(2-Ga)AlO, (d) PtSn/Mg(3-Ga)AlO and (e) PtSn/Mg(4.5-Ga)AlO. | |
Table 2 Summary of the NH3-TPD measurements
| Catalyst |
Peak temperature (°C) |
Peak area fraction (%) |
Total area (a.u.) |
| Peak I |
Peak II |
Peak III |
Peak I |
Peak II |
Peak III |
| PtSn/MgAlO |
220 |
320 |
430 |
55 |
30 |
15 |
785.46 |
| PtSn/Mg(0.75-Ga)AlO |
213 |
307 |
443 |
55 |
34 |
11 |
561.11 |
| PtSn/Mg(2-Ga)AlO |
213 |
320 |
450 |
45 |
45 |
10 |
650.7 |
| PtSn/Mg(3-Ga)AlO |
232 |
330 |
457 |
44 |
44 |
12 |
673.7 |
| PtSn/Mg(4.5-Ga)AlO |
220 |
326 |
436 |
55 |
30 |
15 |
1002.5 |
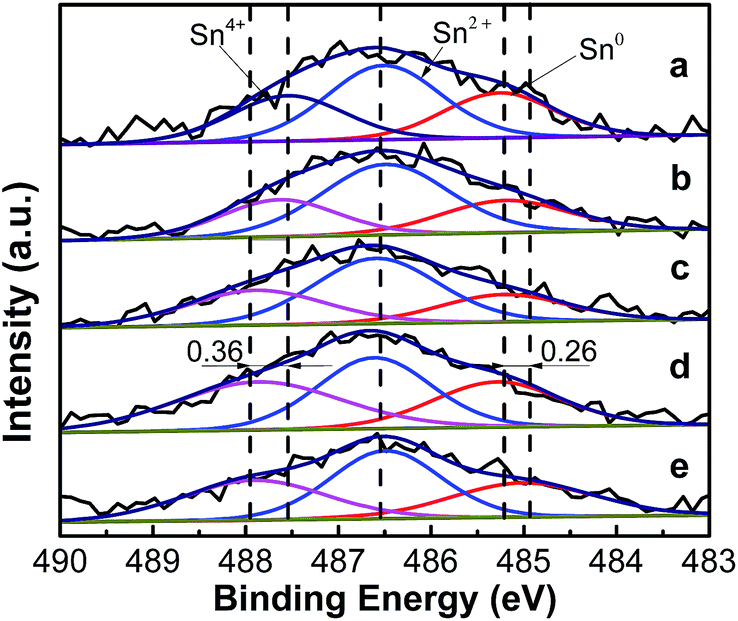
3.1.4. XPS analysis of the catalysts. The XPS Sn 3d5/2 spectra of the PtSn/Mg(x-Ga)AlO catalysts are shown in Fig. 4. The deconvolution results of the corresponding spectra are summarized in Table 3. It can be seen that the Sn 3d5/2 XPS spectra of all the reduced PtSn/Mg(x-Ga)AlO catalysts can be deconvoluted into three peaks at ∼485.27 eV, ∼486.50 eV and ∼487.55 eV, which represent different types of tin species. The peak at ∼485.27 eV corresponds to the reduced tin species (Sn0); whereas the peaks at ∼486.50 eV and ∼487.55 eV are assigned to the oxidized tin species (Sn2+ and Sn4+).46 From Fig. 4 it can be seen that the binding energy of Sn0 and Sn4+ is evidently skewed by about 0.26 eV and 0.36 eV, respectively, when comparing the PtSn/MgAlO catalyst with the PtSn/Mg(4.5-Ga)AlO catalyst, and the binding energy of Sn4+ increases gradually with the increase in Ga loading. From Table 3, it is found that the percentage of Sn0 for PtSn/MgAlO is 26.8%. When a small amount of Ga was added to the PtSn/Mg(x-Ga)AlO catalyst, the percentage of Sn0 decreased with the increase in Ga content; the percentage of Sn0 in the PtSn/Mg(0.75-Ga)AlO and PtSn/Mg(2-Ga)AlO catalysts is about 23.82% and 21.28%, respectively. However, with a further increase in Ga, Sn0 also increases; the percentage of Sn0 in the PtSn/Mg(3-Ga)AlO and PtSn/Mg(4.5-Ga)AlO catalysts is about 26.53% and 27.17%, respectively. All these results verify that Ga can electronic modify the tin valency, thus proper amount of Ga can inhibit the reduction and stabilize the oxidation states of tin species, which is beneficial to strengthen the Pt–Sn and Sn–support interactions.47 The XPS spectra of Ga 2p for the reduced PtSn/Mg(2-Ga)AlO catalyst are shown in Fig. S1,† in which only the peaks for Ga2O3 are observed. Thus, we consider that Ga was not reduced and was still present in the oxidic state.
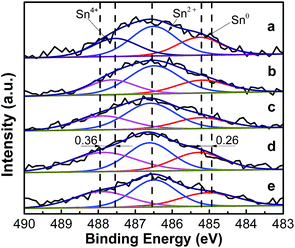 |
| | Fig. 4 Sn 3d5/2 XPS profiles of PtSn/Mg(x-Ga)AlO catalysts: (a) PtSn/MgAlO, (b) PtSn/Mg(0.75-Ga)AlO, (c) PtSn/Mg(2-Ga)AlO, (d) PtSn/Mg(3-Ga)AlO, and (e) PtSn/Mg(4.5-Ga)AlO. | |
Table 3 Summary of the XPS results of the PtSn/Mg(x-Ga)AlO catalysts
| |
BEa (eV) |
| PtSn/MgAlO |
PtSn/Mg(0.75-Ga)AlO |
PtSn/Mg(2-Ga)AlO |
PtSn/Mg(3-Ga)AlO |
PtSn/Mg(4.5-Ga)AlO |
| BE: binding energy. |
| Sn0 |
485.27 (26.8%) |
485.20 (23.82%) |
485.22 (21.28%) |
485.29 (26.53%) |
485.01 (27.17%) |
| Sn2+ |
486.51 (45.45%) |
486.49 (51.44%) |
486.59 (49.34%) |
486.61 (36.73%) |
486.49 (41.25%) |
| Sn4+ |
487.55 (27.74%) |
487.63 (24.74%) |
487.88 (29.37%) |
487.86 (36.74%) |
487.91 (31.59%) |
3.2. Catalytic performances in ethane dehydrogenation
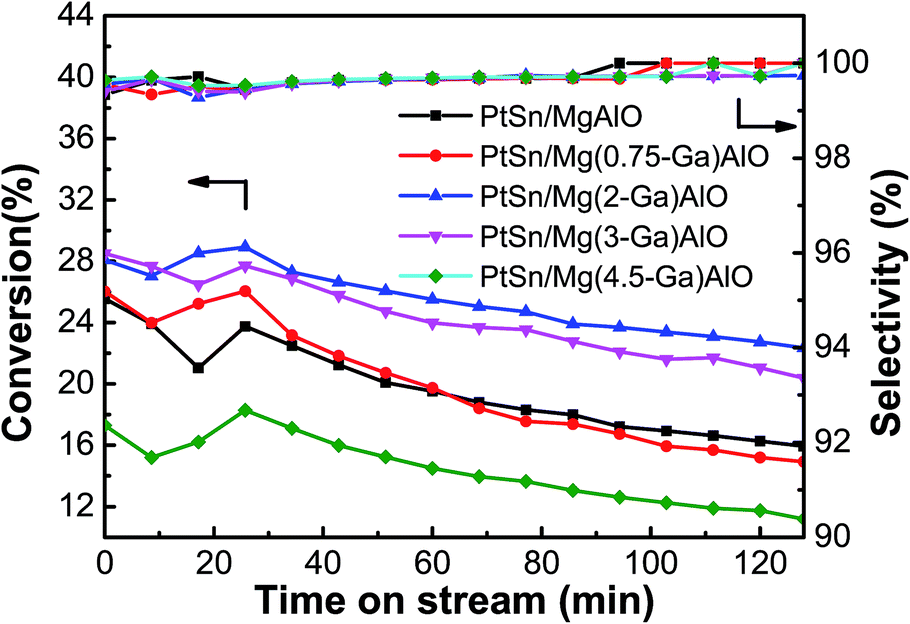
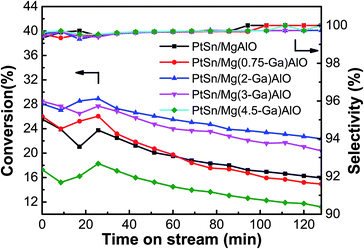
3.2.1. Effect of Ga content. The ethane conversion and ethylene selectivity over the PtSn/Mg(x-Ga)AlO catalysts are shown in Fig. 5. It was observed that all the catalysts initially exhibited a gradually stable process. The ethane conversion peaked at about 0.5 h and then began to descend slowly. The average ethane conversion of the PtSn/MgAlO catalyst was 19.7%, and with an increase in Ga loading, the conversion of ethane increased markedly. The average ethane conversion increased to 25.4% for the PtSn/Mg(2-Ga)AlO catalyst, which is an improvement of about 28.9% compared with the PtSn/MgAlO catalyst. However the ethane conversion decreased evidently as the Ga loading further increased to above 3 wt%. The average ethane conversion decreased to 14.4% for the PtSn/Mg(4.5-Ga)AlO catalyst, which is lower than that of the PtSn/MgAlO catalyst, indicating that an excess content of Ga in the PtSn/Mg(x-Ga)AlO catalysts is disadvantageous for ethane conversion, which is consistent with the structure and surface properties in the previous sections. All the catalysts exhibited relatively high selectivity (>99%) during the entire dehydrogenation process, which verifies that the addition of Ga has no evident influence on the catalyst selectivity.
 |
| | Fig. 5 Effect of the Ga loading of the PtSn/Mg(x-Ga)AlO catalysts on their catalytic performance in ethane dehydrogenation (reaction conditions: T = 550 °C; C2H6/N2 = 0.25; WHSV = 12.9 h−1; and mcat = 100 mg). | |
The results indicate that the presence of Ga has an evident impact on the ethane dehydrogenation performances of the PtSn/Mg(x-Ga)AlO catalysts. This can be explained as follows: first, according to the low temperature nitrogen adsorption–desorption experimental results in Table 2, we know that the addition of Ga can change the structure of the catalysts to some extent, leading to an increase in the SBET value of the PtSn/Mg(x-Ga)AlO catalysts, resulting in a better distribution of Pt particles, more Pt active reaction sites and better performances of ethane dehydrogenation.48
According to the NH3-TPD results, Ga can reduce the acidity of the catalysts, particularly the strong acid sites which is the main reason for side reactions. Therefore, it can effectively suppress the undesired side reactions for ethane dehydrogenation and improve the ethane conversion and ethylene selectivity. According to previous research, the PtSn/Mg(x-Ga)Al catalyst is bifunctional, and its two active centers (the metal particle and the acid site) work collaboratively. An optimum ratio exists between the number of metal active sites and the number of acid sites.49 The ratio between the support acid sites and the number of metal sites of the PtSn/Mg(x-Ga)Al catalyst may change by the addition of Ga so that a better catalytic performance can be obtained. Perhaps the PtSn/Mg(2-Ga)Al catalyst possesses an optimum ratio between the two types of sites.
According to previous research, the state of Sn has a significant influence on the performance of the catalytic properties of Pt. Metallic Sn has an evident inhibiting effect on the catalyst performance. However, when it exists in the oxidized state, it acts as a promoter.47 The XPS results indicate that the PtSn/Mg(2-Ga)Al catalyst has the lowest percent of tin metal and the highest percent of oxidation states of Sn species.
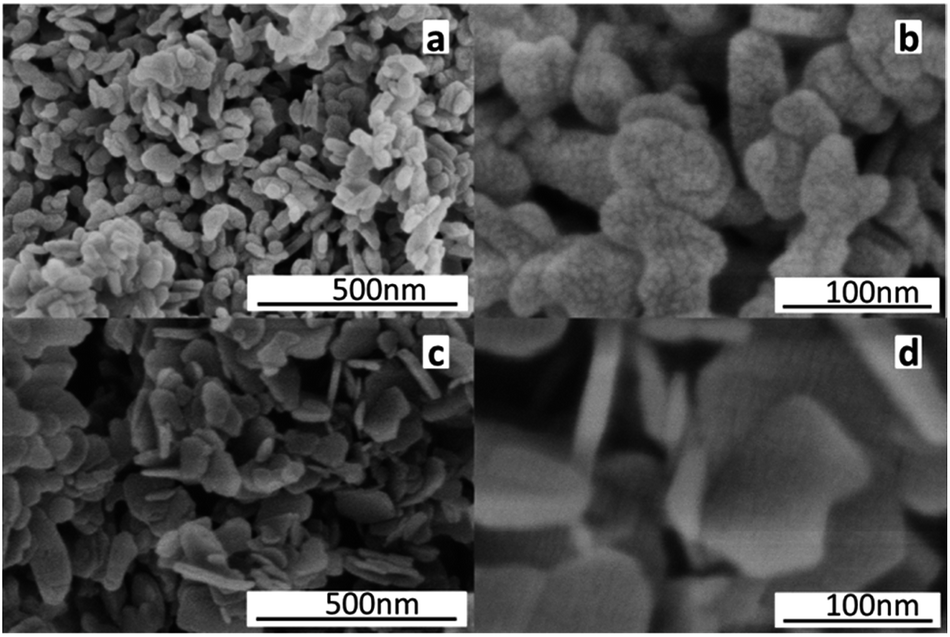
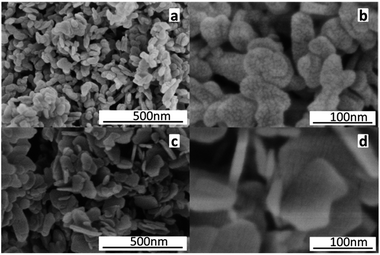
The micrographs of the hydrotalcite-like crystals obtained by SEM analysis are shown in Fig. 6, where great differences can be observed between MgAlO and Mg(2-Ga)AlO. It can be seen that the former exhibits mainly small tabular particles with a flake-like structure mixed in it, whereas the latter is formed mainly by a flake-like structure with a thickness of 10 nm; thus the addition of Ga causes hydrotalcite to form a more regular layer structure. The SEM image of the reduced PtSn/Mg(2-Ga)AlO catalyst is shown in Fig. S2,† in which some hydrotalcite layers are still observed. Therefore, it can be concluded that the structure of the catalysts was changed by the addition of Ga, which is in accordance with the BET results.
 |
| | Fig. 6 SEM images of the hydrotalcite-like support: (a and b) MgAlO, and (c and d) Mg(2-Ga)AlO. | |
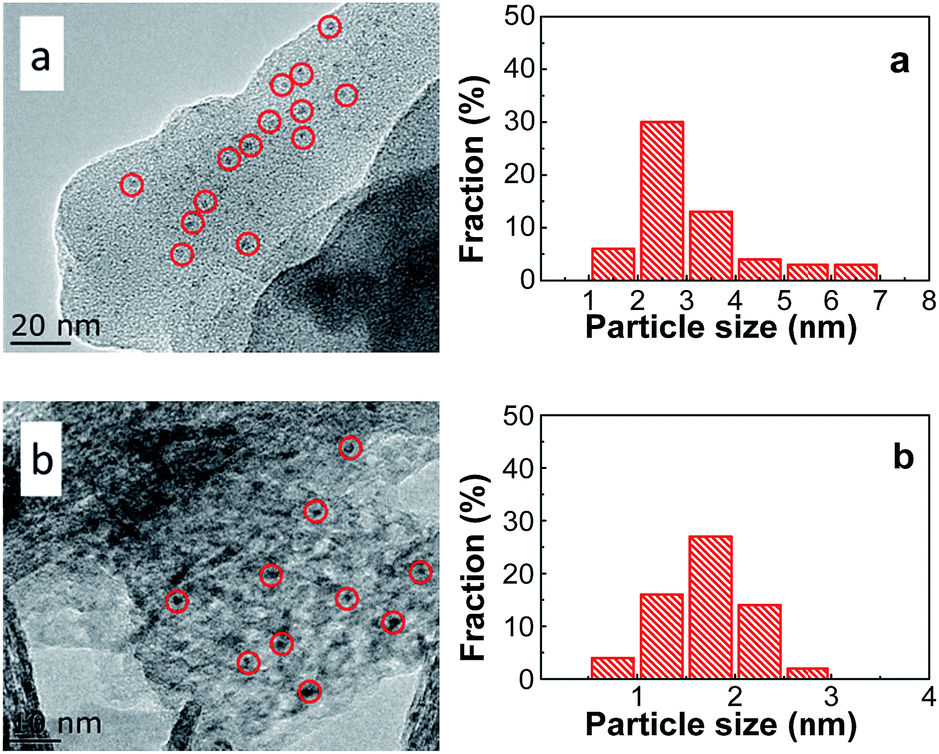
The morphology and metal particle size of PtSn/Mg(x-Ga)AlO were characterized by TEM in Fig. 7. It can be seen that the PtSn/Mg(2-Ga)AlO catalyst has a smaller average metal particle size (1.69 nm) than the 0.5PtSn/MgAlO catalyst (3.12 nm), and it exhibits a better distribution of Pt particles, which indicates that the addition of a certain amount of Ga is beneficial for the formation of small Pt particles and their uniform distribution. This can be explained as follows: on one hand, the presence of Ga has a dilution effect on platinum, which is conducive to decrease the size of the Pt particles.10 On the other hand, the addition of Ga can promote hydrotalcite to form more regular thin sheet particles, and thus a more thorough iron exchange can occur, which is beneficial for the uniform distribution of the Pt component on the support. According to previous research, smaller Pt particles and their better distribution can supply more Pt active reaction sites and inhibit the hydrogen and carbon deposition reaction at the same time. This is because hydrogen and carbon deposition are structure sensitive reactions that require big Pt particles.
 |
| | Fig. 7 TEM images and the corresponding particle size distributions of (a) PtSn/MgAlO and (b) PtSn/MgGa2AlO. | |
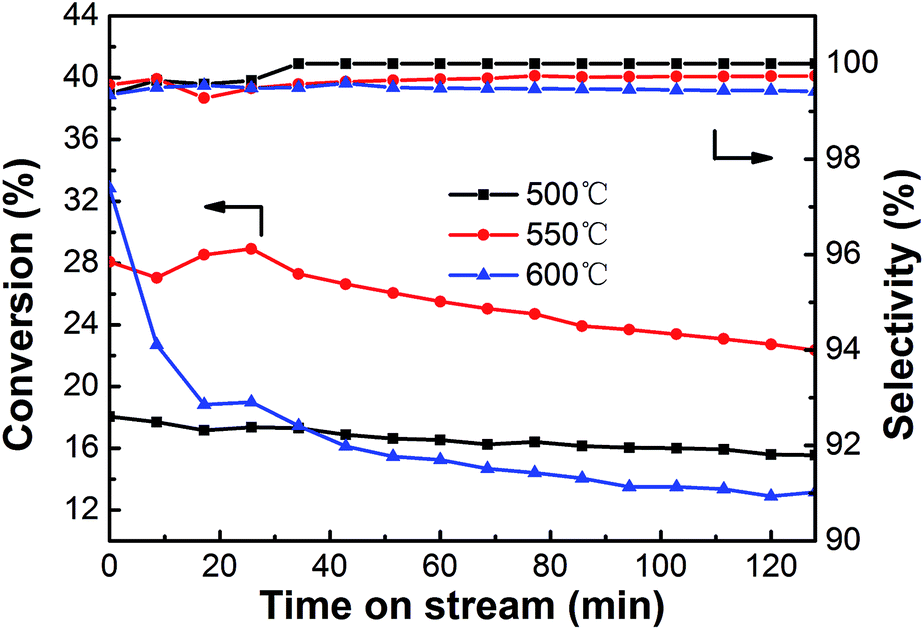
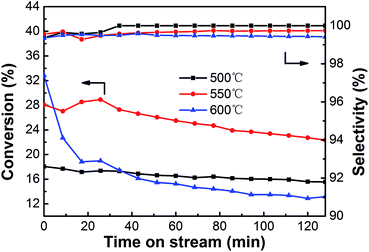
3.2.2. Effect of temperature. The effect of reaction temperature on the performance of the PtSn/Mg(2-Ga)AlO catalyst in ethane dehydrogenation was investigated, and the results are shown in Fig. 8. All the catalysts exhibit relatively high selectivity (>99%) during the entire dehydrogenation process. The initial ethane conversions are 18.1%, 28.1% and 32.8% at the reaction temperatures of 500, 550 and 600 °C, which decrease to 15.6%, 22.3% and 13.2% after 128 min reaction, respectively. The highest initial ethane conversion was obtained at the reaction temperature of 600 °C. However, the activity and stability declined very quickly because thermal cracking was enhanced at high temperature, which led to carbon deposition on the catalyst surface. When the reaction is performed at a lower temperature, such as 500 °C, the catalyst exhibits the best stability and the ethane conversion only decreases by 13.8%; however, the average ethane conversion is too low. An average conversion of 25.4% was acquired at 550 °C, which is certainly higher than that at 500 and 600 °C. To balance the conversion and stability of ethane dehydrogenation, the reaction temperature of 550 °C is the desired selection.
 |
| | Fig. 8 The effect of temperature on the catalytic performance of PtSn/Mg(2-Ga)AlO catalyst (reaction conditions: C2H6/N2 = 0.25; WHSV = 12.9 h−1; mcat = 100 mg). | |
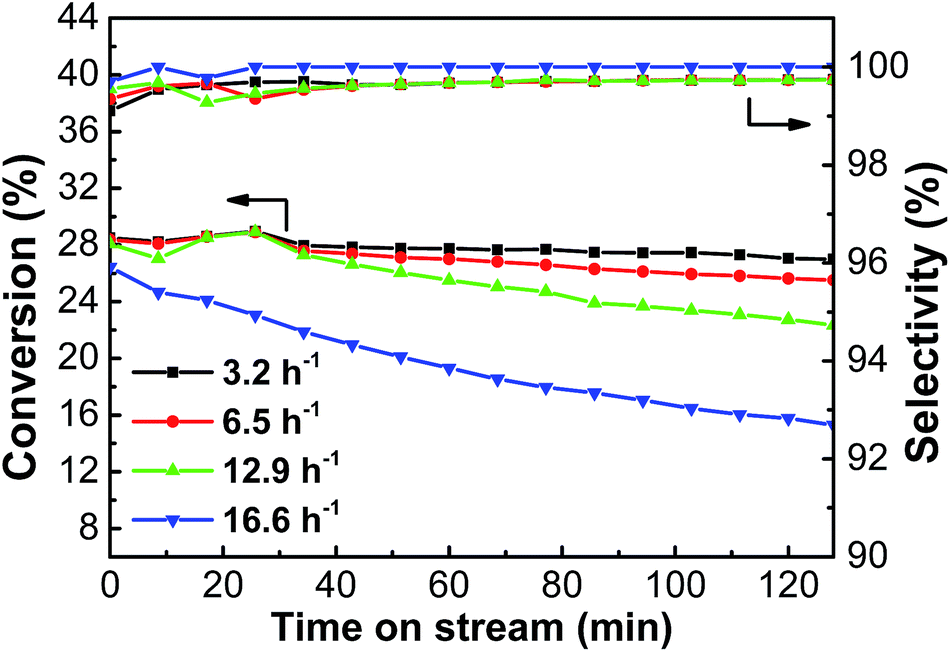
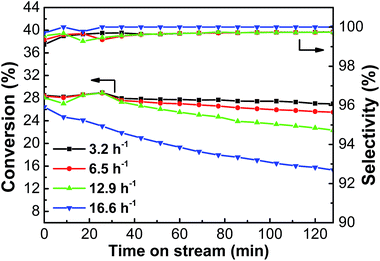
3.2.3. Effect of WHSV. Fig. 9 shows the conversion and selectivity of the PtSn/Mg(2-Ga)AlO catalyst for ethane the dehydrogenation reaction with different WHSV. As can be seen, the highest average ethane conversion of 27.1% was obtained at 3.2 h−1. The average ethane conversion decreased with an increase in GHSV; nevertheless, the decrease was very small. However, when the GHSV increased to 16.6 h−1, the ethane conversion decreased evidently due to the fact that the contact time between ethane and the catalyst was shortened, and the reaction did not proceed adequately.
 |
| | Fig. 9 The effect of WHSV on the catalytic performance of PtSn/Mg(2-Ga)AlO catalyst (reaction conditions: T = 550 °C; C2H6/N2 = 0.25; mcat = 100 mg). | |
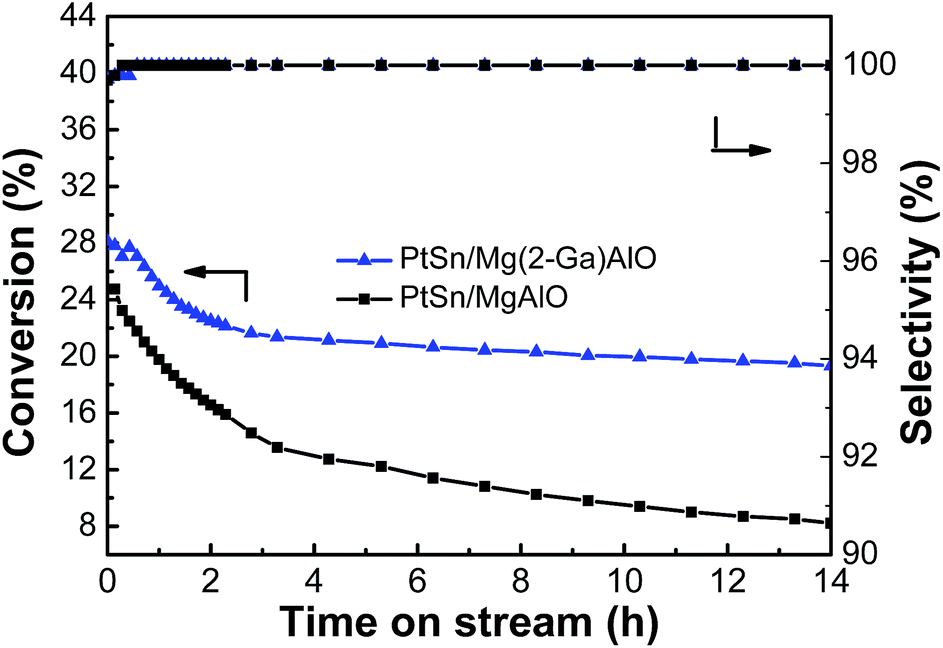
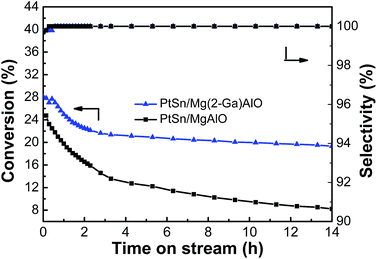
3.2.4. Stability test. Stability tests for the PtSn/Mg(2-Ga)AlO and 0.5PtSn/MgAlO catalysts were carried out, and the ethane conversion and ethylene selectivity for ethane dehydrogenation are shown in Fig. 10. The ethane conversion of the PtSn/Mg(2-Ga)AlO and PtSn/MgAlO catalysts decreased to 31.3% and 66.8% after 14 h reaction, and their final catalytic activities were 19.3% and 8.2%, respectively. The catalyst stability was greatly enhanced by the addition of Ga because Ga can reduce the deactivation and the coke accumulation.30 The selectivity of both catalysts was above 99% during the entire reaction process.
 |
| | Fig. 10 Stability tests of the PtSn/Mg(2-Ga)AlO and PtSn/MgAlO catalysts in ethane dehydrogenation (reaction conditions: T = 550 °C; C2H6/N2 = 0.25; WHSV = 12.9 h−1; and mcat = 100 mg). | |
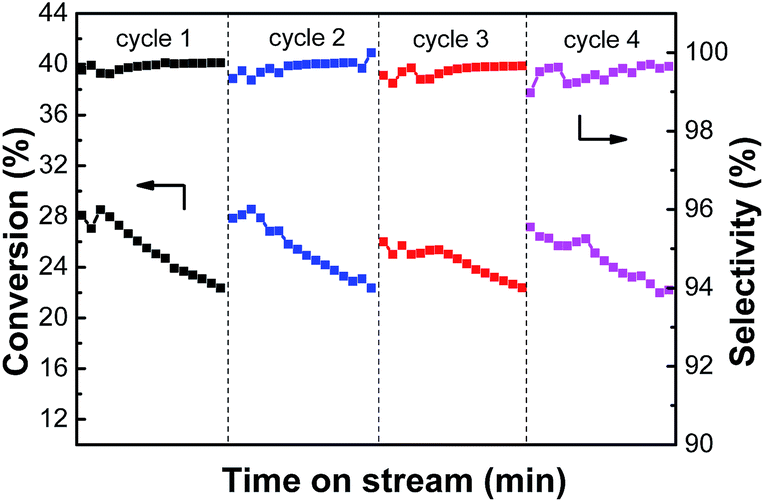
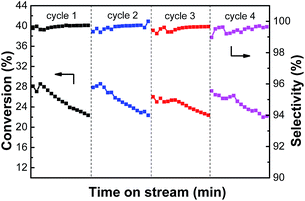
3.2.5. The reaction-regeneration of PtSn/Mg(2-Ga)AlO catalyst. A reaction–regeneration test for the PtSn/Mg(2-Ga)AlO catalyst was carried out to investigate the effects of reduction–reaction–oxidation cycles on catalyst activity during ethane dehydrogenation. It can be seen from Fig. 11 that in each cycle, the catalyst has a stable stage and then the ethane conversion gradually decreases. During the 4 cycles, the average ethane conversions are 25.4%, 25.4%, 24.4 and 24.6%. No significant activity decrease was observed after 4 cycles, and the ethylene selectivity varied a little at about 99% in each cycle period. Thus, we propose that the main reason for the loss in catalyst activity was not the sintering of the metal particles but carbon deposition on the catalyst surface. The coke can be fully removed by oxidation and the catalyst activity can be restored by subsequent reduction.
 |
| | Fig. 11 The catalytic performances of PtSn/Mg(2-Ga)AlO catalysts within 4 reaction-regeneration cycles (reaction conditions: T = 550 °C; C2H6/N2 = 0.25; WHSV = 12.9 h−1; mcat = 100 mg). | |
4. Conclusions
Hydrotalcite Mg(x-Ga)AlO materials were synthesized via the coprecipitation method with a constant pH, and PtSn/Mg(x-Ga)AlO catalysts were prepared via the anion exchange method. The XRD, BET and SEM measurements show that the structure of the catalysts changed to some extent on the addition of Ga, but the crystal structure was not destroyed. The NH3-TPD results suggest that a moderate amount of Ga can markedly neutralize the acid sites of the catalysts and effectively suppress the undesired side reactions for ethane dehydrogenation. The TEM measurements show that the addition of Ga in the catalyst is beneficial for the formation of small Pt particles and their uniform distribution. The average particle size of the PtSn/Mg(2-Ga)AlO catalyst is 1.69 nm. The XPS results verify that the suitable Ga content can strengthen the Sn–support and Pt–Sn interactions, which can enhance the properties of the catalysts. The PtSn/Mg(2-Ga)AlO catalyst exhibits the best ethane dehydrogenation performance. The ethane conversion of the PtSn/Mg(2-Ga)AlO catalyst varies from 25.6% to 17.0% in a 14 h ethane dehydrogenation reaction. The catalyst performance has no evident decline after 4 reaction–regeneration cycles with selectivity above 99% for each cycle.
Acknowledgements
This study was supported by the NSFC (Natural Science Foundation of China) project (51476175, 51536009), the National Key basic Research Program of China (973 program, 2013BC228105) and the Chinese Academy of Sciences “one hundred talented plan”.
Notes and references
- N. A. Pakhomov, V. N. Kashkin, E. I. Nemykina, V. V. Molchanov, V. I. Nadtochiy and A. S. Noskov, Chem. Eng. J., 2009, 154, 185–188 CrossRef CAS.
- F. Cavani, N. Ballarini and A. Cericola, Catal. Today, 2007, 127, 113–131 CrossRef CAS.
- R. S. Vincent, R. P. Lindstedt, N. A. Malik, I. A. B. Reid and B. E. Messenger, J. Catal., 2008, 260, 37–64 CrossRef CAS.
- J. J. Sattler, J. Ruiz-Martinez, E. Santillan-Jimenez and B. M. Weckhuysen, Chem. Rev., 2014, 114, 10613 CrossRef CAS PubMed.
- L. Shi, G. M. Deng, W. C. Li, S. Miao, Q. N. Wang, W. P. Zhang and A. H. Lu, Angew. Chem., 2015, 54, 13994–13998 CrossRef CAS PubMed.
- K. Kumbilieva, N. A. Gaidai, N. V. Nekrasov, L. Petrov and A. L. Lapidus, Chem. Eng. J., 2006, 120, 25–32 CrossRef CAS.
- B. K. Vu, M. B. Song, I. Y. Ahn, Y.-W. Suh, D. J. Suh, W.-I. Kim, H.-L. Koh, Y. G. Choi and E. W. Shin, Appl. Catal., A, 2011, 400, 25–33 CrossRef CAS.
- J. Silvestre-Albero, J. C. Serrano-Ruiz, A. Sepúlveda-Escribano and F. Rodríguez-Reinoso, Appl. Catal., A, 2008, 351, 16–23 CrossRef CAS.
- Y. Zhang, Y. Zhou, J. Shi, S. Zhou, X. Sheng, Z. Zhang and S. Xiang, J. Mol. Catal. A: Chem., 2014, 381, 138–147 CrossRef CAS.
- S. A. Bocanegra, A. A. Castro, O. A. Scelza and S. R. de Miguel, Appl. Catal., A, 2007, 333, 49–56 CrossRef CAS.
- M. P. Lobera, C. Téllez, J. Herguido and M. Menéndez, Appl. Catal., A, 2008, 349, 156–164 CrossRef CAS.
- A. Virnovskaia, S. Morandi, E. Rytter, A. Giovanna Ghiotti and U. Olsbye, J. Phys. Chem. C, 2007, 111, 14732–14742 CAS.
- J. I. D. Cosimo, V. K. DíEz, M. Xu, E. Iglesia and C. R. ApesteguíA, J. Catal., 1998, 178, 499–510 CrossRef.
- J. H. Kwak, J. Hu, D. Mei, C.-W. Yi, D. H. Kim, C. H. F. Peden, L. F. Allard and J. Szanyi, Science, 2009, 325, 1670–1673 CrossRef CAS PubMed.
- R. L. Frost, S. J. Palmer and L.-M. Grand, J. Raman Spectrosc., 2010, 41, 1797–1802 CrossRef.
- J. T. Kloprogge, D. Wharton, L. Hickey and R. L. Frost, Am. Mineral., 2002, 87, 623–629 CrossRef CAS.
- S. Miyata, Clays Clay Miner., 1983, 31, 305–311 CAS.
- J. H. Lee, S. W. Rhee and D. Y. Jung, Chem. Mater., 2004, 16, 3774–3779 CrossRef CAS.
- B. Y. Jibril, A. Atta, K. Melghit, Z. El-Hadi and H. Ala'a, Chem. Eng. J., 2012, 193, 391–395 CrossRef.
- Y. Zhang, Y. Zhou, J. Shi, X. Sheng, Y. Duan, S. Zhou and Z. Zhang, Fuel Process. Technol., 2012, 96, 220–227 CrossRef CAS.
- P. Sun, G. Siddiqi, W. C. Vining, M. Chi and A. T. Bell, J. Catal., 2011, 282, 165–174 CrossRef CAS.
- J. Wu, Z. Peng and A. T. Bell, J. Catal., 2014, 311, 161–168 CrossRef CAS.
- C. Yu, H. Xu, Q. Ge and W. Li, J. Mol. Catal. A: Chem., 2007, 266, 80–87 CrossRef CAS.
- V. Galvita, G. Siddiqi, P. Sun and A. T. Bell, J. Catal., 2010, 271, 209–219 CrossRef CAS.
- K. Xia, W.-Z. Lang, P.-P. Li, L.-L. Long, X. Yan and Y.-J. Guo, Chem. Eng. J., 2016, 284, 1068–1079 CrossRef CAS.
- K. Searles, G. Siddiqi, O. V. Safonova and C. Copéret, Chem. Sci., 2017, 8, 2661–2666 RSC.
- R. Koirala, R. Buechel, F. Krumeich, S. E. Pratsinis and A. Baiker, ACS Catal., 2015, 5, 690–702 CrossRef CAS.
- E. Jablonski, A. Castro, O. Scelza and S. De Miguel, Appl. Catal., A, 1999, 183, 189–198 CrossRef CAS.
- P. Sun, G. Siddiqi, M. Chi and A. T. Bell, J. Catal., 2010, 274, 192–199 CrossRef CAS.
- G. Siddiqi, P. Sun, V. Galvita and A. T. Bell, J. Catal., 2010, 274, 200–206 CrossRef CAS.
- E. A. Redekop, V. V. Galvita, H. Poelman, V. Bliznuk, C. Detavernier and G. B. Marin, ACS Catal., 2014, 4, 1812–1824 CrossRef CAS.
- N. S. Homs, J. Llorca, M. Riera, J. Jolis, J.-L. G. Fierro, J. Sales and P. R. R. de la Piscina, J. Mol. Catal. A: Chem., 2003, 200, 251–259 CrossRef CAS.
- T. Wang, F. Jiang, G. Liu, L. Zeng, Z. J. Zhao and J. Gong, AIChE J., 2016, 62, 4365–4376 CrossRef CAS.
- C. T. Shao, W. Z. Lang, X. Yan and Y. J. Guo, Rsc. Adv., 2017, 7, 4710–4723 RSC.
- S. K. Yun and T. J. Pinnavaia, Chem. Mater., 1995, 7, 348–354 CrossRef CAS.
- O. Altuntasoglu, U. Unal, S. Ida, M. Goto and Y. Matsumoto, J. Solid State Chem., 2008, 181, 3257–3263 CrossRef CAS.
- L. P. Chen, Z. P. Tian, W. Lv, Z. Si, Q. Y. Liu, M. Y. Ding, L. G. Chen, L. L. Ma, Q. Zhang, T. J. Wang and C. G. Wang, J. Fuel Chem. Technol., 2016, 44, 597–606 CAS.
- Y. Lin, J. Wang, D. G. Evans and D. Li, J. Phys. Chem. Solids, 2006, 67, 998–1001 CrossRef CAS.
- J. A. van Bokhoven, J. Roelofs, K. P. de Jong and D. C. Koningsberger, Chem.–Eur. J., 2001, 7, 1258–1265 CrossRef CAS.
- Y. W. Zhang, Y. M. Zhou, X. L. Sheng, L. H. Wan, Y. J. Li, Y. M. Xiao, B. Yu and Z. Zeng, Fuel Process. Technol., 2012, 104, 23–30 CrossRef CAS.
- B. Xu, J. Long, H. Tian, Y. Zhu and X. Sun, Catal. Today, 2009, 147, S46–S50 CrossRef CAS.
- X. Liu, W.-Z. Lang, L.-L. Long, C.-L. Hu, L.-F. Chu and Y.-J. Guo, Chem. Eng. J., 2014, 247, 183–192 CrossRef CAS.
- C. Yu, Q. Ge, H. Xu and W. Li, Appl. Catal., A, 2006, 315, 58–67 CrossRef CAS.
- R. J. Balasamy, B. B. Tope, A. Khurshid, A. A. S. Al-Ali, L. A. Atanda, K. Sagata, M. Asamoto, H. Yahiro, K. Nomura, T. Sano, K. Takehira and S. S. Al-Khattaf, Appl. Catal., A, 2011, 398, 113–122 CrossRef CAS.
- F. B. Passos, D. A. Aranda and M. Schmal, J. Catal., 1998, 178, 478–488 CrossRef CAS.
- A. D. Ballarini, C. G. Ricci, S. R. de Miguel and O. A. Scelza, Catal. Today, 2008, 133, 28–34 CrossRef.
- J. Shi, Y. Zhou, Y. Zhang, S. Zhou, Z. Zhang, J. Kong and M. Guo, J. Mater. Sci., 2014, 49, 5772–5781 CrossRef CAS.
- K. Xia, W.-Z. Lang, P.-P. Li, X. Yan and Y.-J. Guo, Rsc. Adv., 2015, 5, 64689–64695 RSC.
- M. Larsson, M. Hulten, E. A. Blekkan and B. Andersson, J. Catal., 1996, 164, 44–53 CrossRef CAS.
Footnote |
| † Electronic supplementary information (ESI) available. See DOI: 10.1039/c7ra00670e |
|
| This journal is © The Royal Society of Chemistry 2017 |
Click here to see how this site uses Cookies. View our privacy policy here. 
 Open Access Article
 This Open Access Article is licensed under a Creative Commons Attribution-Non Commercial 3.0 Unported Licence
 a,
Chenguang Wang*b,
Longlong Mab,
Qi Zhangb,
Qiying Liub,
Lungang Chenb,
Lingpeng Chenbc,
Qiao Zhangb and
Zhipeng Tianbc
a,
Chenguang Wang*b,
Longlong Mab,
Qi Zhangb,
Qiying Liub,
Lungang Chenb,
Lingpeng Chenbc,
Qiao Zhangb and
Zhipeng Tianbc