 Open Access Article
Aggregation suppressed thin film nanocomposite (TFN) membranes prepared with an in situ generation of TiO2 nanoadditives†
Shujie Wanga,
Zhuan Yi a,
Xueting Zhaoa,
Yong Zhou*a and
Congjie Gaoab
aDepartment of Ocean, Zhejiang University of Technology, Hangzhou 310014, China. E-mail: zhouy@zjut.edu.cn
bWater Treatment Technology Development Center, Hangzhou 310012, China
First published on 16th May 2017
Abstract
We report a promising strategy for the preparation of nano-aggregation suppressed thin film nanocomposite (TFN) membranes via an in situ method. Tetra-butyl ortho-titanate (TBOT) was added to the organic phase to prepare the new TFN membranes (in situ TFN). The in situ addition of TBOT produced TiO2 nanoparticles in the polyamide layer during interfacial polymerization. In comparison with TFN membranes fabricated by the conventional method (ex situ TFN preparation), the nanoparticles in the in situ synthesized TFN membranes exhibited better dispersion, and more TiO2 nanoparticles were observed on the membrane surface. Surprisingly, at a rather low concentration of TBOT (250 mg L−1), the water flux of the in situ TFN membranes was increased by more than 50% in comparison with that of a pure polyamide membrane with negligible rejection loss, which was close to the performance of the sate-of-the art TFN membranes. The surface properties of the membranes were investigated by scanning electron microscopy (SEM), X-ray diffraction (XRD) analysis, X-ray photoelectron spectroscopy (XPS), and contact angle analysis. Our results demonstrate that in situ generation of nano-additives can effectively suppress nano-agglomeration and improve the performance and surface features of TFN membranes.
1. Introduction
Nanofiltration is a highly efficient technology that is widely used in water softening, desalination, biomedicine, dyestuff production, and wastewater treatment.1–5 In comparison with reverse osmosis (a pressure-driven membrane process operating at approximately 1–7 MPa), nanofiltration has lower operating pressure, higher flux, and greater energy efficiency.6,7 Thin film composite (TFC) membranes, the membranes most commonly used for nanofiltration and reverse osmosis, are usually fabricated via interfacial polymerization (IP) of monomer reactants on a porous support membrane.8,9 The performance of TFC membranes is primarily determined by the physicochemical properties of the top polyamide layer.10–13 Many studies focusing on developing new monomers, optimizing the processes of membrane preparation, and additive doping have shown that water flux and/or separation ability may be enhanced by changing the free volume and cross-linking degree of the polyamide layer.14–17Although efforts toward improving conventional TFC membranes are ongoing, significant advances in membrane performance are rare;18–21 however, recent studies indicate that the synthesis and incorporation of superhydrophilic nanoparticles into the PA layer to fabricate thin film nanocomposite (TFN) membranes may represent a significant breakthrough in membrane performance.22–26 Recently, hydrophilic nanoparticles such as TiO2, zeolite, SiO2, grapheme oxide (GO), and carbon nanotubes have been widely applied to endow TFN membranes with enhanced separation performance by altering membrane surface morphology.27–31 TiO2 nanoparticles (NPs) have attracted considerable interest because of their photocatalytic properties and hydrophilicity, which induce decomposition of organic chemicals and endow TFN membranes with anti-fouling properties.32,33 For example, Lee and colleagues produced a high-TiO2-loaded TFN membrane by dispersing nanoparticles in an organic monomer solution during the interfacial polymerization process, and the resulting membrane exhibited a distinct surface structure and greater permeability;34 however, nanoparticle agglomeration impaired the rejection performance of the membrane. Poor dispersion of hydrophilic nanoparticles in non-polar organic solvents seems to lead inevitably to agglomeration of nanoparticles in membranes.35–38 Alternatively, dispersing nanoparticles into the aqueous phase is also not feasible, because it is difficult to phase-transfer large hydrophilic nanoparticles from water to the polyamide layer formed beside the organic phase.39–43 To overcome the obstacle of nanoparticle aggregation, some researchers have improved nanoparticle dispersion in aqueous and organic solutions by modifying the particle surface. However, this method is complex and will sacrifice the surface property of nanoparticles.30,44
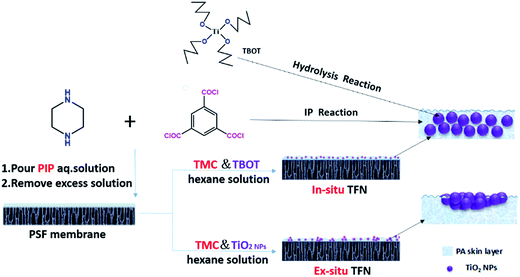
In this contribution, we report a promising strategy for the fabrication of aggregation-suppressed TFN membranes with in situ generation of TiO2 additives in the active PA layer. Tetra-butyl ortho-titanate (TBOT), instead of TiO2 nanoparticles, was added to the organic phase containing 1,3,5-benzenetricarbonyl trichloride (TMC) monomers as the titanium source. TBOT hydrolysis can be utilized to produce TiO2 nanoparticles during or after interfacial polymerization, thus overcoming the limitation of TiO2 nanoparticle aggregation in non-polar organic solvents. In comparison with other methods of reducing nanoparticle aggregation, this new approach is much simpler and more effective. Moreover, TFN membranes prepared by directly adding different amounts of TiO2 NPs were compared with regard to performance and structure. A schematic illustration comparing our strategy of TFN membrane preparation utilizing TBOT loading (defined herein as the in situ method) with membrane preparation via direct addition of TiO2 nanoparticles (defined herein as the ex situ method) is presented in Fig. 1.
2. Experimental section
2.1 Materials and chemicals
1,3,5-Benzenetricarbonyl trichloride (TMC, Sigma-Aldrich, St. Louis, MO, USA), tetra-butyl ortho-titanate (TBOT, Aladdin), titanium oxide (anatase 5–10 nm, Aladdin), piperazine (PIP, Sigma-Aldrich), n-hexane, and trisodium phosphate anhydrous (Na3PO4, Sigma-Aldrich) were purchased from commercial sources and used without further purification. A polysulfone (PSF) ultrafiltration membrane with a molecular weight cut-off of 50![[thin space (1/6-em)]](https://www.rsc.org/images/entities/char_2009.gif) 000 dalton was used as the support.
000 dalton was used as the support.
2.2 Membrane fabrication
TFC and TFN (in situ and ex situ) membranes were fabricated following a typical interfacial polymerization procedure.34,45,46 The aqueous solution was prepared by dissolving 0.2% PIP/Na3PO4 (as a buffer solution) and 0.1% sodium dodecyl sulfonate (as a surfactant) in de-ionized water. The PSF support was coated with the aqueous phase for 5 min. After draining off the excess solution, the membrane was dried for 5 min at room temperature and immersed in 0.1% TMC organic solution for 1 min to allow interfacial polymerization. Finally, the as-prepared TFC membranes were cured in a convection oven at 80 °C for 10 min.TFN membranes were also fabricated with different amounts of TBOT (or TiO2 NPs) mixed into the TMC hexane solution before the interfacial polymerization process, but otherwise following the procedure described above. The experimental conditions were based on the assumption that hydrolysis of one molecule of TBOT produced one molecule of titanium dioxide. The preparation conditions for the in situ and ex situ TFN membranes are summarized in Table 1.
| Membranes | In situ synthesized | Ex situ synthesized |
|---|---|---|
| TBOT (mg L−1) | TiO2 (mg L−1) | |
| TFN1 | 100 | 24 |
| TFN2 | 250 | 60 |
| TFN3 | 500 | 120 |
| TFN4 | 1000 | 240 |
| TFN5 | 2500 | 600 |
2.3 Characterization
 | (1) |
 | (2) |
3. Results and discussion
3.1 Properties of TiO2 nanoparticles
XPS and XRD were used to analyse the properties of TiO2 nanoparticles (data shown in ESI†). XPS and XRD indicated that amorphous TiO2 particles were produced from TBOT during membrane fabrication. The surface elemental composition and O/Ti ratio of commercially sourced TiO2 and TiO2 generated from TBOT are listed in Table 2. The O/Ti ratios of TiO2 purchased from Aladdin and TiO2 synthesized from TBOT were 2.5 and 3.1, respectively, which are both higher than the theoretical O/Ti ratio of TiO2. The relatively high oxygen content of TiO2 from both sources can be attributed to Ti–OH bonds on the outer surface of TiO2 and adsorbed chemicals such as H2O and O2. In comparison with calcinated TiO2 purchased from Aladdin, amorphous TiO2 synthesized from TBOT had a greater O/Ti ratio, which was expected to enhance surface hydrophilicity and thus increase the water flux of TFN membranes. To the best of our knowledge, only a few studies have reported that the type of TiO2 used in the membrane synthesis process influenced membrane performance. However, the effects of amorphous TiO2 on membrane performance and other membrane properties have not been studied systematically.| TiO2 source | Atomic content (%) | O/Ti ratio | Crystal type | |
|---|---|---|---|---|
| O | Ti | |||
| Commercial | 71.26 | 28.74 | 2.5 | Anatase |
| TBOT | 75.56 | 24.44 | 3.1 | Amorphous |
3.2 Flux and rejection performance of TFN and TFC membranes
Fig. 2 shows the water flux and salt rejection performance of TFN and TFC membranes using pure water and salt solutions of Na2SO4 and NaCl. Both types of TFN membrane displayed similar salt rejection performance. The water flux of TFN membranes prepared by directly adding TiO2 NPs (ex situ method) exhibited a relatively small increase from 49.4 to 90.9 L m−2 h−1 as the amount of TiO2 was increased, while that of the in situ TFN membranes increased significantly from 52.0 to 187.1 L m−2 h−1. This difference in the effect of TiO2 loading on the performance of in situ and ex situ membranes might be due to differences in nanoparticle dispersion. For ex situ prepared membranes, poor dispersion of nanoparticles in hexane reduces the amount of loaded TiO2.38 As a result, the in situ-synthesized TFN membranes showed much better performance, including water flux and rejection of Na2SO4 and NaCl, in comparison with that of the ex situ TFN membranes at any TiO2 loading content. Interestingly, the Na2SO4 rejection performance and water flux of the in situ TFN membranes were enhanced in comparison with those of the TFC membranes when the concentration of loaded TBOT was less than 500 mg L−1. The Na2SO4 rejection performance of the in situ TFN membranes reached a maximum value of 95.3% when the amount of TBOT was 250 mg L−1. The water flux through the in situ TFN membranes prepared with 250 mg L−1 TBOT was higher than that of most reported TFN membranes with adequate rejection performance.47–55 However, rejection performance was impaired rapidly when the concentration of TBOT was increased beyond 500 mg L−1. These results indicate that the in situ process provides better dispersion of nanoparticles in both hexane and membranes in comparison with that provided by the ex situ process. Furthermore, TiO2 synthesized from TBOT had a greater O/Ti ratio, which remarkably improved membrane hydrophilicity and thus increased water flux.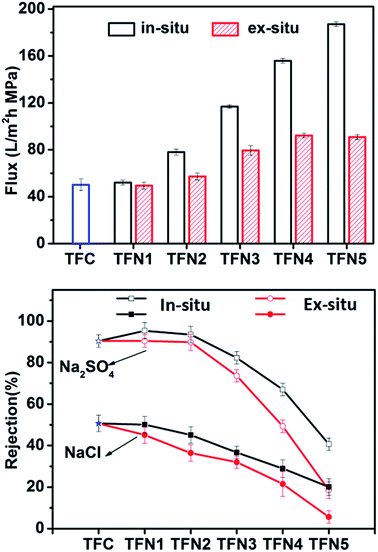 | ||
| Fig. 2 Water flux and rejection performance of TFC and TFN membranes as functions of the amounts of TBOT and TiO2 loaded into the membranes. | ||
3.3 Effects of preparation conditions on membranes performance
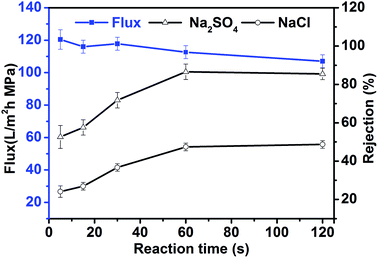
In contrast with the classical ex situ method of preparing TFN membranes, the in situ preparation method utilizes two reactions: an initial interfacial polymerization reaction and a subsequent titanate hydrolysis reaction. The effects of preparation conditions (reaction time and monomer concentration) on membrane performance were investigated to identify the main factors affecting membrane performance and allow optimization of the preparation conditions for in situ TFN membranes (500 mg L−1 TBOT was added to the organic phase during the preparation of each membrane).Fig. 3 shows the relationship between reaction time and the performance of in situ-synthesized TFN membranes. As the reaction time was increased, the rejection performance of TFN membranes increased gradually and plateaued (53% to 87% for Na2SO4 and 24.1% to 48.7% for NaCl), whereas water flux decreased gradually from 115.6 L m−2 h−1 to 101.6 L m−2 h−1. These changes occurred because an interfacial reaction occurred between the aqueous phase of PIP and the organic phase of TMC, and the thickness of the polyamide functional layer was continuously increased. The small variation in flux also shows that the dispersion characteristics and other properties of TiO2 synthesized by TBOT changed slightly as the reaction time was increased because hydrolysis of titanate completed in a very short time. This characteristic of titanate hydrolysis also ensures the stability and viability of TFN membranes produced using the in situ process. Rejection performance and water flux remained unchanged when the reaction time was longer than 60 s, which suggests that interfacial polymerization and hydrolysis might have both reached equilibrium after 60 s. Therefore, 60 s seems to be the appropriate reaction time for the preparation of in situ TFN membranes.
The monomer concentration may also affect membrane performance. Fig. 4a shows the performance of in situ TFN membranes produced using different piperazine (PIP) concentrations ranging from 0.5 g L−1 to 5 g L−1 under the following fabrication conditions: 500 mg L−1 TBOT and 1 g L−1 1,3,5-benzenetricarbonyl trichloride (TMC) in hexane. The rejection performance of the membrane against Na2SO4 and NaCl increased, while water flux decreased gradually, when the PIP concentration was increased from 0.5 to 2.0 g L−1. The membrane performance changed only slightly when the PIP concentration exceeded 2.0 g L−1. This pattern was mainly due to the rate of the interfacial polymerization reaction, which produced a denser and thicker polymer layer as the amount of PIP in the aqueous phase was increased. However, as the thickness of the polymer layer increases, it becomes more difficult for PIP to react with TMC.56
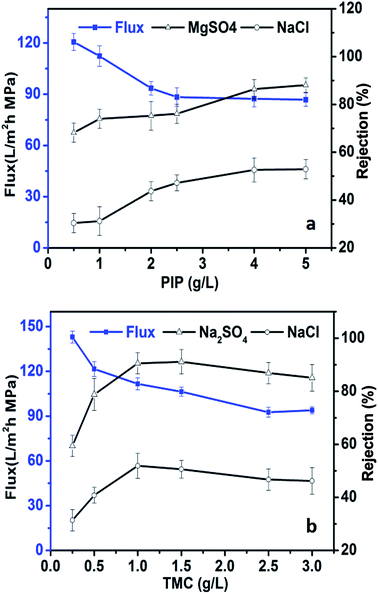 | ||
| Fig. 4 Water flux and rejection performance of in situ-synthesized TFN membranes as functions of PIP and TMC concentrations. | ||
The water flux and rejection performance of in situ TFN membranes fabricated with different TMC concentrations and 2 g L−1 PIP are shown in Fig. 4b. The rejection performance of in situ TFN membranes against Na2SO4 and NaCl increased first, followed by a slight decline, as the TMC concentration was increased, while the water flux decreased as the TMC concentration was increased. The membranes showed optimal salt rejection performance when the TMC concentration was 1.0 to 1.5 g L−1. The concentration of TMC in the reaction mixture has a marked effect on the cross-linking degree of the PA layer. The density of the polymer layer increases as the concentration of TMC is increased, which enhances salt rejection performance and reduces water flux. However, excessive TMC content can lead to a rapid interfacial polymerization reaction that impairs rejection performance.57
Generally, in comparison with the concentration of TBOT, the monomer concentration had only a small influence on the rejection performance and water flux of the TFN membranes. Water flux was decreased from 120.6 L m−2 h−1 to 86.8 L m−2 h−1 when the PIP concentration was increased from 0.5 g L−1 to 5 g L−1, whereas it was decreased from 141.6 L m−2 h−1 to 93.9 L m−2 h−1 when the TMC concentration was increased from 0.25 g L−1 to 3 g L−1; these effects on membrane performance were far smaller in magnitude than that of changing the TBOT concentration. The influence of preparation conditions (reaction time and concentration of TMC and PIP) on membrane permeability suggests that altering the TBOT concentration might influence membrane structure and change the size of membrane pores, which might have a greater impact on TFN performance in comparison with the effects of changing the monomer concentrations.
3.4 Surface morphologies of prepared membranes
SEM images were collected to characterize the surface morphology of membranes prepared in different manners (TFC, in situ synthesized, and ex situ synthesized). SEM images of a PSF support and TFC membrane are shown in Fig. 5. The PSF support had a porous surface. After the interfacial polymerization reaction, the surface of the TFC membrane had a “rubber particle-like” structure.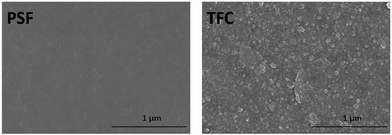 | ||
| Fig. 5 SEM images of an ultrafiltration polysulfone support and a TFC membrane prepared without adding TBOT or TiO2 additives. | ||
The influence of the TBOT and TiO2 concentrations on the selective layer was also examined (Fig. 6). In comparison with TFC membranes, the morphology of TBOT- and TiO2-loaded membranes was modified clearly by the additives. Although the loading concentration of particles was rather low, obvious agglomeration was observed on the surface of the ex situ prepared TFN. However, agglomeration occurred only at the very high TBOT concentration of 2500 mg L−1 in the in situ synthesized TFN5 membrane. It is hypothesized that TiO2 nanoparticles produced by hydrolysis of TBOT were covered immediately by the polymer during the interfacial polymerization process, which enabled uniform dispersion of nanoparticles in the polyamide layer and minimized interaction between nanoparticles, thus suppressing agglomeration.58 However, small TiO2 NPs were observed on the surface of the ex situ synthesized TFN membranes (especially apparent in Fig. 6d and e). Therefore, the beneficial properties of TiO2 NPs can be conferred only upon the membrane surface, rather than upon the polyamide layer, which limits the degree to which water flux can be enhanced. Interestingly, the surface of the in situ synthesized TFN membranes had a unique cross-linked structure. As the amount of loaded TBOT was increased, the circular cross-linked network structure of the polyamide layer became more obvious, which may have increased the surface area of the in situ synthesized membrane. This finding also explains why in situ TFN membranes fabricated with the addition of a relatively low concentration of TBOT showed amazing enhancement of water flux in comparison with TFC and ex situ TFN membranes. As shown in Fig. 6e, severe nanoparticle agglomeration, which occurred when the TBOT concentration was high, destroyed the structure of the top layer and thus markedly impaired rejection performance. These observations demonstrate that, in comparison with ex situ TFN membranes, in situ-synthesized TFN membranes fabricated with TBOT showed better dispersion of NPs and a more compact structure between the TiO2 NPs and active polyamide layer.
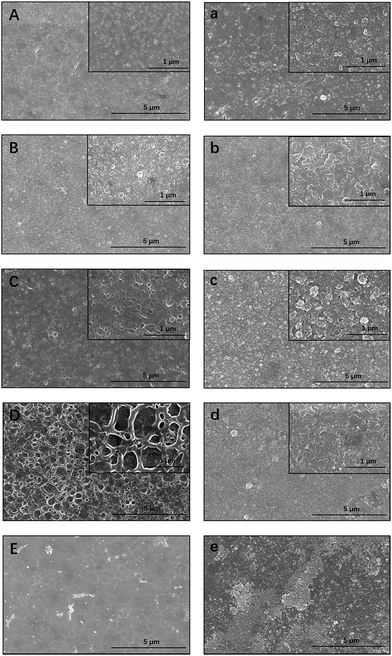 | ||
| Fig. 6 SEM images of in situ synthesized membranes ((A) TFN1; (B) TFN2; (C) TFN3; (D) TFN4; (E) TFN5) and ex situ synthesized membranes ((a) TFN1; (b) TFN2; (c) TFN3; (d) TFN4; (e) TFN5). | ||
3.5 XPS analysis
Two types of reactions between aqueous PIP solutions and organic TMC solutions were expected. The first expected reaction was the network cross-linking reaction of the amine in PIP with the third remaining chloride group in TMC via amide linkage. The second expected reaction was the hydrolysis reaction of the third chloride group in TMC to carboxylic acid. Because each of these reactions can occur during TFN membrane production, the polypiperazine amide may have two different chemical structures: linear or cross-linked. Although the permeability performance data and SEM images provide useful information about the TFN membranes, they cannot provide a thorough understanding of the surface composition of TFN membranes loaded with TBOT. XPS analysis is a suitable method for investigating the outer membrane layer and providing direct evidence of the elemental composition and chemical structure of the membrane surface.59,60The results of the XPS analysis of the surface compositions of TFC and TFN membranes are listed in Table 3. Ti was more abundant on the surface of the in situ-synthesized TFN membranes in comparison with that of the ex situ membranes, which is entirely consistent with the hypothesis that the poor dispersion of TiO2 NPs in hexane resulted in fewer nanoparticles entering the polyamide layer. Moreover, this finding also explains why in situ TFN membranes prepared with TBOT exhibited greater water flux.
| Membranes | In situ synthesized | Ex situ synthesized | ||||||||
|---|---|---|---|---|---|---|---|---|---|---|
| Atomic contents (%) | O/N | Atomic contents (%) | O/N | |||||||
| C | N | O | Ti | C | N | O | Ti | |||
| TFN1 | 69.3 | 13.73 | 16.57 | 0.4 | 1.1 | 71.33 | 11.59 | 16.67 | 0.4 | 1.3 |
| TFN2 | 65.91 | 11.84 | 20.33 | 1.92 | 1.2 | 70.66 | 11.85 | 16.9 | 0.59 | 1.3 |
| TFN3 | 54.19 | 10.53 | 30.05 | 5.23 | 1.3 | 65.02 | 12.00 | 20.93 | 2.05 | 1.3 |
| TFN4 | 53.18 | 7.05 | 32.48 | 7.29 | 1.4 | 57.68 | 9.80 | 27.38 | 5.14 | 1.5 |
| TFN5 | 46.61 | 4.89 | 38.71 | 9.79 | 1.7 | 52.76 | 7.55 | 32.54 | 7.15 | 1.9 |
The atomic contents of the membrane surface can be also used to evaluate the degree of cross-linking of the polypiperazine amide layer. In order to avoid interference from carbon (carbon contamination of the sample surface is unavoidable), the O/N ratio was used to investigate the degree of cross-linking of the TFN membranes. The O/Ti ratio of the in situ TFN membranes was 3.1, whereas the O/Ti ratio of the ex situ membranes was 2.5 (Table 1). The O/NPA ratio can be obtained from the other information in Table 1. Theoretically, the O/NPA ratio varies from 1.0 for a fully cross-linked structure (C16H14N3O3) with good rejection performance to 2.0 for a fully linear structure (C13H12N2O4). As shown in Table 2, the O/NPA ratios of the in situ and ex situ TFN membranes increased with the addition of TBOT and TiO2, and the former had a relatively greater degree of cross-linking. Surprisingly, the O/NPA ratios of the in situ TFN1 and TFN2 membranes, in which a low concentration of TBOT was used, were equivalent to that of the TFC membrane (O/N ratio = 1.1). This finding confirms that a low concentration of TBOT does not impair the degree of cross-linking in the film, which is generally consistent with the results of the SEM imaging and permeability tests.
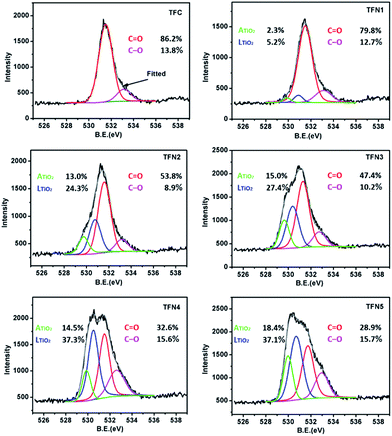
The deconvoluted, high-resolution O 1s peaks provide information about the chemical bonds of polypiperazine amide and TiO2 in the in situ-synthesized TFN membranes generated with TBOT (Fig. 7). The O 1s spectra of TFC showed two peaks: a major peak from C![[double bond, length as m-dash]](https://www.rsc.org/images/entities/char_e001.gif) O at 531.6 eV and a smaller peak from the C–O of a carboxylic group at 533.0 eV.61 According to the peak area ratio listed on the chart, the area of the C
O at 531.6 eV and a smaller peak from the C–O of a carboxylic group at 533.0 eV.61 According to the peak area ratio listed on the chart, the area of the C![[double bond, length as m-dash]](https://www.rsc.org/images/entities/char_e001.gif) O peak decreased with the addition of TBOT, while the area of the C–O peak increased. The C
O peak decreased with the addition of TBOT, while the area of the C–O peak increased. The C![[double bond, length as m-dash]](https://www.rsc.org/images/entities/char_e001.gif) O/C–O ratios for the TFC membrane and membranes TFN1–5 were 6.25, 6.28, 6.04, 4.65, 2.09, and 1.84, respectively. It can be concluded that the in situ-synthesized TFN membranes prepared with relatively low concentrations of TBOT had a relatively greater degree of cross-linking. This finding confirms that the low concentration of TBOT used in in situ-synthesized membranes TFN1 and TFN2 had no effect on cross-linking and therefore significantly increased water flux with a negligible loss of rejection performance.23 Two other peaks obtained from the high resolution O (1s) spectra of the in situ TFN membranes produced with the addition of TBOT illustrate the presence of two types of titanium dioxide: lattice oxygen (LTiO2) at 530.9 eV and adsorption oxygen (ATiO2) at 529.9 eV. Interestingly, the LTiO2/ATiO2 ratio of all in situ TFN membranes was approximately 2, which is in agreement with the results listed in Table 1. It is worth noting that adsorbed oxygen comes mainly from water in the air and is present on the titanium dioxide surface in the form of OH groups. Therefore, in comparison with the TiO2 NPs of the ex situ TFN membranes, the in situ-synthesized TiO2 of the in situ TFN membranes was more hydrophilic and thus significantly increased water flux.
O/C–O ratios for the TFC membrane and membranes TFN1–5 were 6.25, 6.28, 6.04, 4.65, 2.09, and 1.84, respectively. It can be concluded that the in situ-synthesized TFN membranes prepared with relatively low concentrations of TBOT had a relatively greater degree of cross-linking. This finding confirms that the low concentration of TBOT used in in situ-synthesized membranes TFN1 and TFN2 had no effect on cross-linking and therefore significantly increased water flux with a negligible loss of rejection performance.23 Two other peaks obtained from the high resolution O (1s) spectra of the in situ TFN membranes produced with the addition of TBOT illustrate the presence of two types of titanium dioxide: lattice oxygen (LTiO2) at 530.9 eV and adsorption oxygen (ATiO2) at 529.9 eV. Interestingly, the LTiO2/ATiO2 ratio of all in situ TFN membranes was approximately 2, which is in agreement with the results listed in Table 1. It is worth noting that adsorbed oxygen comes mainly from water in the air and is present on the titanium dioxide surface in the form of OH groups. Therefore, in comparison with the TiO2 NPs of the ex situ TFN membranes, the in situ-synthesized TiO2 of the in situ TFN membranes was more hydrophilic and thus significantly increased water flux.
3.6 Hydrophilicity and charge properties
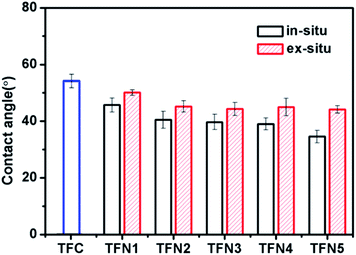
Fig. 8 shows the contact angles of the TFC membrane, in situ-synthesized TFN membranes, and ex situ-synthesized TFN membranes loaded with TBOT or TiO2 NPs. Both types of TFN membrane had a contact angle lower than that of the TFC membrane (54.8 ± 1.3°), which was attributed to improvement of water flux by the presence of superhydrophilic titanium dioxide. The contact angle of the in situ TFN membranes was decreased markedly by the addition of TBOT (from 45.7 ± 2.5° to 34.6 ± 2.2°), while enhancement of hydrophilicity was not obvious for the ex situ TFN membranes (the contact angle only decreased from 50.1 ± 1° to 44.1 ± 1.3°) prepared by directly adding TiO2 NPs. These findings may explain why the in situ TFN membranes had greater TiO2 content and showed better dispersion of TiO2 in the polyamide layer in comparison with the ex situ TFN membranes.The zeta potential of the TFC and TFN membranes was carefully investigated (Fig. 9). The zeta potential of the TFC membranes ranged from 19.5 mV to −42.8 mV at pH values ranging from 3 to 8.5. However, the zeta potential of the in situ and ex situ membranes was increased after the addition of TBOT or TiO2 NPs. In comparison with the zeta potential of the ex situ membranes, that of the in situ TFN membrane surface was closer to neutral. Furthermore, the isoelectric point of the in situ TFN membranes was changed markedly from 4.0 to 3.6 after the addition of TBOT or TiO2 NPs, but that of the ex situ TFN membranes only increased by 0.1 (from 4.0 to 4.1), perhaps because of the different charge properties of in situ- and ex situ-synthesized TiO2. Additionally, these results show that the zeta potential of the in situ TFN membranes is clearly higher than that of the other membranes at pH values ranging from 5 to 8. Generally, membrane surfaces with zeta potential close to zero exhibit good anti-fouling properties with regard to charged organic foulants because interaction between the charged surface and organic foulants is impaired.62 Therefore, it can be concluded that the in situ-synthesized TFN membranes may have anti-fouling properties stronger than those of the TFC membrane and ex situ-synthesized TFN membranes.
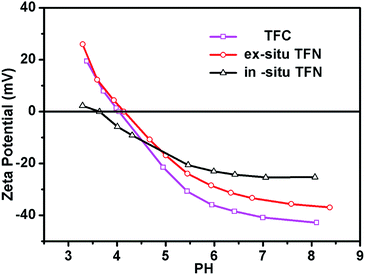 | ||
| Fig. 9 pH dependence of the zeta-potential of the TFC membrane, in situ-synthesized TFN membranes, and ex situ-synthesized TFN membranes. | ||
4. Conclusions
We developed a promising strategy for the preparation of thin film nanocomposite membranes with in situ generation of TiO2 NPs in the active layer. TBOT was added to the organic phase, where it served as a Ti source that was eventually hydrolysed, followed by aggregation of TiO2 NPs in the selective layer, which improved NP dispersion and increased TiO2 loading. In comparison with the TFN membranes prepared by directly adding TiO2 NPs to the reaction mixture (i.e. ex situ), the in situ-generated TFN membranes showed enhanced permeability, even at a TBOT concentration as low as 250 mg L−1. The permeation tests implied that the concentration of TBOT was an important factor that determined the performance of the nanocomposite membrane, and larger water flux was observed at greater TBOT concentrations. The SEM images demonstrated that the surface morphology of the nanocomposite membranes was altered by TBOT loading, and a unique network structure was found on the particle surface. The surface composition of the TFN membranes was determined via XPS and XRD analysis to confirm that TBOT was transformed into TiO2 nanoparticles that were present at the membrane surface.Acknowledgements
This work was supported by the National Basic Research Program of China (Grant No. 2015CB655303) and the National Major Research and Development Program of China (Grant No. 2016YFC0401508). Assistance from the Open Research Fund Program of Collaborative Innovation Center of Membrane Separation and Water Treatment of Zhejiang Province (2016ZD02, 2016YB08) is also sincerely acknowledged.References
- M. T. Ravanchi, T. Kaghazchi and A. Kargari, Desalination, 2009, 235, 199–244 CrossRef.
- I. M. Atadashi, M. K. Aroua, A. R. A. Aziz and N. M. N. Sulaiman, Renewable Sustainable Energy Rev., 2011, 15, 5051–5062 CrossRef CAS.
- E. Mirtalebi, M. M. A. Shirazi, A. Kargari, M. Tabatabaei and S. Ramakrishna, Desalin. Water Treat., 2013, 52, 6611–6619 CrossRef.
- S. Ramakrishna, Desalin. Water Treat., 2013, 51, 5974–5986 CrossRef.
- M. M. A. Shirazi, D. Bastani, A. Kargari and M. Tabatabaei, Desalin. Water Treat., 2013, 51, 6003–6008 CrossRef CAS.
- Y. Song, F. Liu and B. Sun, J. Appl. Polym. Sci., 2005, 95, 1251–1261 CrossRef CAS.
- C. K. Diawara, Sep. Purif. Technol., 2008, 37, 302–324 CrossRef CAS.
- J. E. Cadott, R. J. Petersen, R. E. Larson and E. E. Erickson, Desalination, 1980, 32, 25–31 CrossRef.
- D. Violleau, H. Essis-Tome, H. Habarou, J. P. Croué and M. Pontié, Desalination, 2005, 173, 223–238 CrossRef CAS.
- A. K. Ghosh and E. M. V. Hoek, J. Membr. Sci., 2009, 336, 140–148 CrossRef CAS.
- T. Shintani, H. Matsuyama and N. Kurata, Desalination, 2009, 247, 370–377 CrossRef CAS.
- R. X. Zhang, J. Vanneste, L. Poelmans, A. Sotto, X. L. Wang and B. V. D. Bruggen, J. Appl. Polym. Sci., 2012, 125, 3755–3769 CrossRef CAS.
- Z. Zhang, Z. Wang, J. Wang and S. Wang, Desalination, 2013, 309, 187–196 CrossRef CAS.
- L. Krasemann and B. Tieke, Mater. Sci. Eng., C, 1999, 8, 513–518 CrossRef.
- S. H. Kim, S. Y. Kwak and T. Suzuki, Environmental Science & Technology, 2005, 39, 1764–1770 CAS.
- G. Chen, S. Li, X. Zhang and S. Zhang, J. Membr. Sci., 2008, 310, 102–109 CrossRef CAS.
- J. Xiang, Z. Xie, M. Hoang, D. Ng and K. Zhang, J. Membr. Sci., 2014, 465, 34–40 CrossRef CAS.
- C. J. Kurth, J. A. Koehler, M. Zhou, B. A. Holmberg and R. L. Burk, EP Pat., 2448657 A2, 2012.
- S. Rosenberg, S. D. Jons, J. D. Koob, M. Paul, X. Qiu, A. Roy, C. Zhang and A. A. Desai, EP Pat., 2776146 A1, 2014.
- T. Zhang, C. Zhu, H. Ma, R. Li, B. Dong, Y. Liu and S. Li, J. Membr. Sci., 2014, 457, 88–94 CrossRef CAS.
- Q. Chen, P. Yu, W. Huang, S. Yu, M. Liu and C. Gao, J. Membr. Sci., 2015, 492, 312–321 CrossRef CAS.
- P. L. Llewellyn, U. Ciesla, H. Decher, R. Stadler, F. Schüth and K. K. Unger, Stud. Surf. Sci. Catal., 1994, 84, 2013–2020 CrossRef CAS.
- B. H. Jeong, E. M. V. Hoek, Y. Yan, A. Subramani, X. Huang, G. Hurwitz, A. K. Ghosh and A. Jawor, J. Membr. Sci., 2007, 294, 1–7 CrossRef CAS.
- J. Kim and D. B. B. Van, Environ. Pollut., 2010, 158, 2335–2349 CrossRef CAS PubMed.
- G. D. Kang and Y. M. Cao, Water Res., 2012, 46, 584 CrossRef CAS PubMed.
- W. J. Lau, S. Gray, T. Matsuura, D. Emadzadeh, J. P. Chen and A. F. Ismail, Water Res., 2015, 80, 306–324 CrossRef CAS PubMed.
- M. Fathizadeh, A. Aroujalian and A. Raisi, J. Membr. Sci., 2011, 375, 88–95 CrossRef CAS.
- M. Amini, M. Jahanshahi and A. Rahimpour, J. Membr. Sci., 2013, 435, 233–241 CrossRef CAS.
- R. Vinodh and D. Sangeetha, J. Appl. Polym. Sci., 2013, 128, 1930–1938 CAS.
- N. Rakhshan and M. Pakizeh, Sep. Purif. Technol., 2015, 147, 245–256 CrossRef CAS.
- J. Yin, G. Zhu and B. Deng, Desalination, 2016, 379, 93–101 CrossRef CAS.
- K. Porkodi and S. Arokiamary, Mater. Charact., 2007, 58, 495–503 CrossRef CAS.
- S. Yang, J. S. Gu, H. Y. Yu, J. Zhou, S. F. Li, X. M. Wu and L. Wang, Sep. Purif. Technol., 2011, 83, 157–165 CrossRef.
- H. S. Lee, S. J. Im, J. H. Kim, H. J. Kim, J. P. Kim and B. R. Min, Desalination, 2008, 219, 48–56 CrossRef CAS.
- J. F. Gaynor and J. Huang, US Pat., 6533855 B1, 2003.
- A. Gomathi and C. N. R. Rao, J. Cluster Sci., 2008, 19, 247–257 CrossRef CAS.
- V. Vatanpour, E. Salehi, S. S. Madaeni, A. R. Khataee, S. Zinadini and H. A. Monfared, Desalination, 2012, 292, 19–29 CrossRef CAS.
- D. Emadzadeh, W. J. Lau, T. Matsuura, A. F. Ismail and M. Rahbari-Sisakht, J. Membr. Sci., 2014, 449, 74–85 CrossRef CAS.
- S. H. Kim, S. Y. Kwak, B. H. Sohn and H. P. Tai, J. Membr. Sci., 2003, 211, 157–165 CrossRef CAS.
- G. L. Jadav and P. S. Singh, J. Membr. Sci., 2009, 328, 257–267 CrossRef CAS.
- X. Bai, Y. Zhang, H. Wang, H. Zhang and J. Liu, Desalination, 2013, 313, 57–65 CrossRef CAS.
- L. X. Dong, X. C. Huang, Z. Wang, Z. Yang, X. M. Wang and C. Y. Tang, Sep. Purif. Technol., 2016, 166, 230–239 CrossRef CAS.
- S. J. Kim, P. S. Lee, S. Bano, Y. I. Park, S. E. Nam and K. H. Lee, J. Appl. Polym. Sci., 2016, 133, 18 Search PubMed.
- R. Bhandavat, M. Cologna, R. Raj and G. Singh, Desalination, 2013, 313, 176–188 CrossRef.
- J. E. Cadotte, US Pat., 4277344 A, 1981.
- R. J. Petersen, J. Membr. Sci., 1993, 83, 81–150 CrossRef CAS.
- A. S. Al-Hobaib, J. E. Ghoul, I. Ghiloufi and L. E. Mir, Mater. Sci. Semicond. Process., 2016, 42, 111–114 CrossRef CAS.
- G. N. Baroña, M. Choi and B. Jung, J. Colloid Interface Sci., 2012, 386, 189–197 CrossRef PubMed.
- L. M. Jin, S. L. Yu, W. X. Shi, X. S. Yi, N. Sun, Y. L. Ge and C. Ma, Polymer, 2012, 53, 5295–5303 CrossRef CAS.
- Q. Li, Z. Li, H. Yu, X. Pan, X. Wang, Y. Wang and J. Song, Desalination, 2013, 327, 24–31 CrossRef CAS.
- Q. Li, Y. Wang, J. Song, Y. Guan, H. Yu, X. Pan, F. Wu and M. Zhang, Appl. Surf. Sci., 2015, 324, 757–764 CrossRef CAS.
- B. Rajaeian, A. Rahimpour, M. O. Tade and S. Liu, Desalination, 2013, 313, 176–188 CrossRef CAS.
- M. Safarpour, V. Vatanpour, A. Khataee and M. Esmaeili, Sep. Purif. Technol., 2015, 154, 96–107 CrossRef CAS.
- J. N. Shen, C. C. Yu, M. R. Hui, C. J. Gao and B. V. D. Bruggen, J. Membr. Sci., 2013, 442, 18–26 CrossRef CAS.
- H. Wu, B. Tang and P. Wu, J. Membr. Sci., 2013, 428, 425–433 CrossRef CAS.
- M. Liu, S. Yu, J. Tao and C. Gao, J. Membr. Sci., 2008, 325, 947–956 CrossRef CAS.
- D. Hu, Z.-L. Xu and C. Chen, Desalination, 2012, 301, 75–81 CrossRef CAS.
- A. Mollahosseini and A. Rahimpour, J. Ind. Eng. Chem., 2014, 20, 1261–1268 CrossRef CAS.
- O. Akin and F. Temelli, Desalination, 2011, 278, 387–396 CrossRef CAS.
- B. Khorshidi, T. Thundat, B. Fleck and M. Sadrzadeh, RSC Adv., 2015, 5, 54985–54997 RSC.
- B. Khorshidi, T. Thundat, B. A. Fleck and M. Sadrzadeh, Sci. Rep., 2016, 6, 22069 CrossRef PubMed.
- Q. Li, Z. Li, H. Yu, X. Pan, X. Wang, Y. Wang and J. Song, Desalination, 2013, 327, 24–31 CrossRef CAS.
Footnote |
| † Electronic supplementary information (ESI) available. See DOI: 10.1039/c7ra02374j |
| This journal is © The Royal Society of Chemistry 2017 |

