 Open Access Article
Superhydrophobic surfaces on brass substrates fabricated via micro-etching and a growth process
Junyang Tan,
Junjie Hao,
Zhenqiang An and
Changsheng Liu *
*
Key Laboratory for Anisotropy and Texture of Materials, Ministry of Education, Northeastern University, Shenyang 110819, China. E-mail: neujohnson@163.com; csliu@mail.neu.edu.cn
First published on 16th May 2017
Abstract
Constructing artificial superhydrophobic surfaces is an effective strategy for improving the properties of traditional materials. In this paper, we report an easy method for preparing superhydrophobic surfaces on brass to expand its field of application. The micro–nanostructure on the brass surface was constructed via micro-etching technology, and the resulting surface energy was reduced via stearic acid modification. The surface was analyzed using scanning electron microscopy and X-ray photoelectron spectroscopy. The brass surface was converted from hydrophilic to superhydrophilic to superhydrophobic. Bending and abrasion tests were used to characterize the mechanical durability of the surface. Additionally, the obtained surface exhibited a superior self-cleaning performance. We propose that this method has a promising future for superhydrophobic surface fabrication and can expand the applications of brass.
1. Introduction
The surfaces of many plants and insects, such as rose petals, rice leaves, and butterfly wings, have attracted much interest because of their excellent water-repellent traits.1–4 Such surfaces have contact angles (CA) >150° and sliding angles (SA) <10° and are called superhydrophobic surfaces.5,6 The lotus leaf is the most well-known superhydrophobic surface and has been studied intensively. Neinhuis and Barthlott used scanning electron microscopy to investigate the lotus leaf and found that it possesses a dual hierarchical structure and the surface is covered with low surface energy waxy organics;7 they proposed that both the special surface morphology and the chemical composition are essential for superhydrophobicity. Many methods for fabricating artificial superhydrophobic surfaces have been reported, including self-assembly,8–10 a sol–gel technique,11–13 electrochemical reaction and deposition,14–16 and laser fabrication.17–19 Because of their unique wetting behaviors, superhydrophobic surfaces have enormous potential for applications in a wide variety of fields. For example, using constructed superhydrophobic surfaces, Chen et al. separated oil/water mixtures efficiently,20 and Xue et al. removed microbubbles from aqueous media.21Brass is a common copper alloy (Cu–Zn) and is widely used in daily life and industrial production because of its particular physical and mechanical properties, including its high thermal conductivity, low friction, good anti-corrosion ability, and good casting properties.22 As industry and technology develop, brass is expected to have even more applications. It is thus necessary to improve the properties of brass, such as its resistance to corrosion in seawater and its self-cleaning ability in dusty conditions so that it can be used in various harsh environments. Constructing superhydrophobic coatings on brass is an effective method for improving its properties and expanding its applications. However, few methods for preparing a superhydrophobic brass surface have been reported. Jie et al. used a combined approach for preparing a superhydrophobic surface via etching with an aqueous solution of FeCl3 for 45 min, heating at 350 °C for 25 min, and then modifying the surface with stearic acid.23 Ta et al. obtained a nanosecond laser textured superhydrophobic metallic surface using a fiber laser with a nominal beam spot of about 21 μm at a scanning speed of 75 mm s−1.24 However, the low efficiency of these reported methods has restricted the widespread application of superhydrophobic brass surfaces. It is a practical and valuable task to improve the preparation efficiency.
In this study, a superhydrophobic surface was fabricated on brass using a simple micro-etching technique. Numerous rough structures on the micro/nanometer scale were achieved, and the free energy of the surface was reduced using stearic acid modification. The as-prepared surface had great mechanical durability and a self-cleaning ability. There was only slight damage on the substrate compared to other traditional etching methods used for fabricating superhydrophobic surfaces. Additionally, compared to other techniques for fabricating superhydrophobic brass surface, this preparation method is highly effective and easily controlled. We believe that the present method may expand the prospective applications of brass.
2. Materials and methods
2.1 Materials
Brass plates with a thickness of 0.5 mm were cut into 100 mm × 60 mm samples. Hydrochloric acid (HCl), sulfuric acid (H2SO4), sodium chloride (NaCl), and sodium sulphate (Na2SO4) were supplied by Tianjin Kemiou Chemical Reagent Co., Ltd. Stearic acid (STA) was purchased from Tianjin Fuyu Fine Chemical Co., Ltd. All other chemicals were analytical grade and were used as received.2.2 Sample preparation
To remove organic contaminants from the surface, the brass plate was first polished with sandpaper (from 400 to 1200 grit) and ultrasonically washed with acetone, ethanol, and deionized water for 6 min each. The sample was then immersed in a solution of 10 wt% H2SO4 for 30 s to remove oxide films, cleaned with deionized water and ethanol, and then air-dried. A reaction immersion solution containing 1 M HCl was then prepared for brass micro-etching, and NaCl and Na2SO4 were added in a mass ratio of 6![[thin space (1/6-em)]](https://www.rsc.org/images/entities/char_2009.gif) :
:![[thin space (1/6-em)]](https://www.rsc.org/images/entities/char_2009.gif) 1. The cleaned brass sample was dipped in the immersion solution at room temperature for 10 s. Without drying, the dipped sample was removed from solution and heated in a thermostatic drying oven at a temperature of 110 °C for the micro-etching process to occur. The reaction time was varied from 1 to 10 min to obtain an optimum surface texture required for superhydrophobicity. After the reaction, the sample was removed from the oven, cooled at room temperature for 30 s, and then dipped in a 0.1 M STA ethanol solution for 2 minutes to modify the surface. Ultimately, a superhydrophobic brass surface was obtained and dried with cold air.
1. The cleaned brass sample was dipped in the immersion solution at room temperature for 10 s. Without drying, the dipped sample was removed from solution and heated in a thermostatic drying oven at a temperature of 110 °C for the micro-etching process to occur. The reaction time was varied from 1 to 10 min to obtain an optimum surface texture required for superhydrophobicity. After the reaction, the sample was removed from the oven, cooled at room temperature for 30 s, and then dipped in a 0.1 M STA ethanol solution for 2 minutes to modify the surface. Ultimately, a superhydrophobic brass surface was obtained and dried with cold air.
2.3 Characterization
The CAs for water were measured using the sessile drop method with a 3 μL droplet admeasuring apparatus (JCY-2, Fangrui) under ambient conditions. All measurements of each sample were repeated at a minimum of five different positions and then averaged. The morphological micro–nanostructure of the as-prepared surface was observed using scanning electron microscopy (SEM, FEI NanoSEM 430). The sample surface roughness was characterized using a laser confocal scanning microscope (LSCM, Olympus OLS3100). The chemical composition of the surface was analyzed using X-ray photoelectron spectroscopy (XPS, K-Alpha) and X-ray diffraction (XRD, Bruke D8 Advance).3. Results and discussion
3.1 Surface morphology and chemical composition
The formation process of the superhydrophobic brass surface is given in Fig. 1. First, the immersion solution reacted with the brass substrate, and numerous tiny cavities formed on the surface. During reaction, zinc was the only element etched while copper remained as an elementary substance; thus, the process is called micro-etching. At high temperature, NaCl crystallized on the substrate and became embedded in the cavities. Each of these two processes contributed to the rough structure. Finally, the STA modification endowed the as-etched surface with excellent superhydrophobicity because the existence of –CH3 and –CH2– groups significantly decreased the free energy of the surface.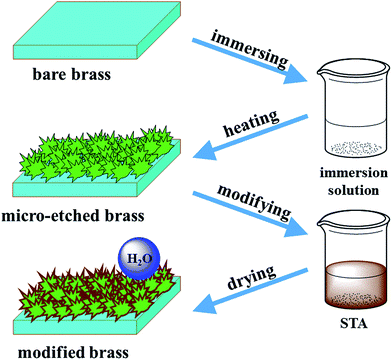 | ||
| Fig. 1 Schematic illustration of the process for fabricating a superhydrophobic surface on the brass substrate. | ||
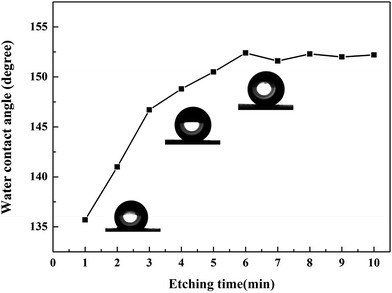
The wettability and morphology of the superhydrophobic surface were affected by several factors, including temperature, pH, immersion solution concentration, and etching time.25–29 Herein, the effect of the micro-etching time was the primary consideration. The effect of the micro-etching time on the wettability of the brass substrate was studied using CA measurements. Fig. 2 illustrates the CA variation of the modified surface for different lengths of micro-etching time. The surface that was micro-etched for 1 min was hydrophobic with a CA of 135.7°. The CA increased with an increase in micro-etching time. When the sample was micro-etched for 6 min, the CA improved to a maximum of 152.4°, and the SA was 5.3°, indicating that the modified sample had excellent superhydrophobicity. Following the process of micro-etching, the CAs remained over 150°, and the range of change was relatively small. Therefore, it was concluded that the optimal etching time was 6 min in terms of efficiency and cost.
It is known that surface morphology affects the wettability of the surface. Fig. 3 shows the SEM images of the STA-modified surface with different lengths of micro-etching time at different magnifications. When the etching time was as short as 1 min, a rough morphology was observed on the substrate (Fig. 3a and b). Since the brass composition was not homogeneous, there were unequal etching rates at different positions of the plate.30 Thus the micrometer-scale structures were unevenly distributed on the surface and revealed good roughness. When the reaction time was increased to 4 min, the sample had a large and uniformly distributed amount of grass-like micro sheets (Fig. 3c and d), resulting in a roughness hierarchy. With this reaction process, such micro sheets grew upwards gradually and became interconnected, forming clusters. As shown in Fig. 3e, after 6 min of reaction time, the agglomeration process continued, and numerous hemispherical rough structures were constructed on the sample. With higher magnification (Fig. 3f), dandelion-like clusters with sharp edges were seen. These clusters had an average size of 10 μm, and air was trapped easily in the spaces between the clusters.
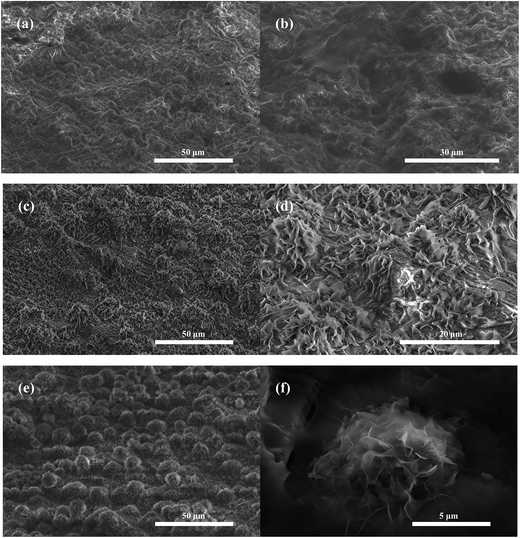 | ||
| Fig. 3 SEM images of the as-prepared surfaces at different micro-etching times of (a and b) 1 min, (c and d) 3 min, and (e and f) 6 min. | ||
The surface roughness (Ra) further revealed changes in the morphology. Fig. 4 shows the LSCM images, the Ra profile curves, and the water drop photographs of the surface of each the bare, micro-etched, and superhydrophobic brass. The bare brass sample had an apparently smooth topography with a Ra value of 0.397 μm, and on the surface of the bare brass, the water droplet had a CA of 61.3°. After micro-etching, many coarse structures formed on the samples and dramatically increased the Ra to 2.635 μm. The water droplets spread on the as-etched surface with a CA of less than 5°. After modification with STA, the surface was converted from superhydrophilic to superhydrophobic. The water droplets formed spherical shapes and had a CA of 152.4°. Moreover, because of the formation of the richer topographic characteristics caused by STA, the Ra further increased to 3.307 μm, and this indicates that air was trapped easily in the interspacings of the rough surface.
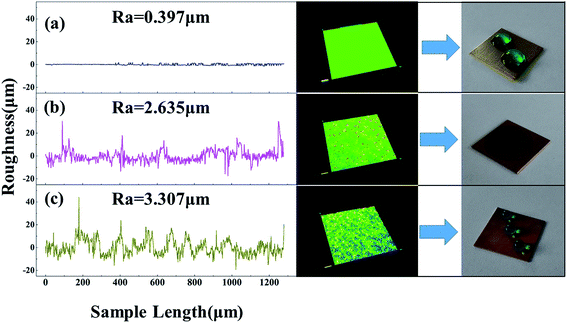 | ||
| Fig. 4 LSCM topographical images, surface roughness profile curves, and optical photographs of the water drops on the surface of each the bare (a), micro-etched (b), and superhydrophobic (c) brass. | ||
To further understand the superhydrophobicity, the wetting behaviors of the superhydrophobic brass surface were described using the Cassie–Baxter model,31 where large amounts of air were trapped in the micro–nanostructure. The CA is mathematically denoted as:
cos![[thin space (1/6-em)]](https://www.rsc.org/images/entities/char_2009.gif) θr = f θr = f![[thin space (1/6-em)]](https://www.rsc.org/images/entities/char_2009.gif) cos cos![[thin space (1/6-em)]](https://www.rsc.org/images/entities/char_2009.gif) θ + f − 1 θ + f − 1 |
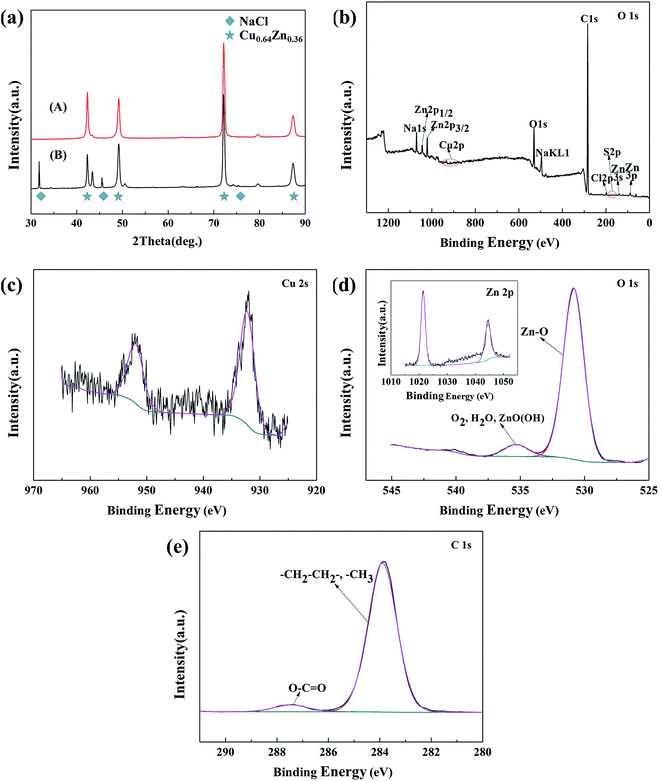
XRD and XPS measurements were used to analyze the chemical composition of the as-prepared surfaces. Fig. 5a compares the XRD patterns of the bare brass surface (A) and the micro-etched brass surface (B) in a 2θ scan range of 30–90°. The four diffraction peaks at 2θ = 42.32°, 49.27°, 72.24°, and 87.45° correspond to Cu0.64Zn0.36 (JCPDS Card No. 50-1333), which came from the brass substrate. After micro-etching, however, new reflections appeared at 2θ = 31.69°, 45.45°, and 75.30° corresponding to NaCl (JCPDS Card No. 05-0628), which indicate that NaCl crystallized on the brass surface during the reaction.
XPS spectroscopy was used to characterize the changes of the surface chemical composition after the STA modification. The full spectrum of the modified brass surface is shown in Fig. 5b, and the presence of C, O, Na, Cl, and Zn were clearly observed. The surface also had a weak signal for Cu 2s (Fig. 5c). In Fig. 5d, the O 1s spectrum consisted of two peaks: at 535.5 eV and 530.8 eV. The peak at 535.5 eV is usually assigned to chemisorbed or adsorbed oxygen species such as O2, H2O, and ZnO(OH) because of surface hydroxyl groups.33 The peak located at 530.8 eV is due to the O2− in Zn–O, and this demonstrates that the STA molecules reacted with the –OH groups of the Zn. The C 1s high-resolution spectrum is shown in Fig. 5e. The peak at 283.9 eV was attributed to carbon atoms in C–C or C–H, and the peak at 287.6 eV was assigned to the carbon atom in O–C![[double bond, length as m-dash]](https://www.rsc.org/images/entities/char_e001.gif) O, which confirms the existence of a long-chain aliphatic group containing –COO–. The combined analyses of the O 1s and C 1s spectra leads us to hypothesize that the STA molecules have a good affinity for the etched brass substrate via the condensation reaction, in which the carboxyl group (COO–H) combines with the hydroxyl group (–OH) in the brass and releases water, forming CH3(CH2)16COO–brass.34,35
O, which confirms the existence of a long-chain aliphatic group containing –COO–. The combined analyses of the O 1s and C 1s spectra leads us to hypothesize that the STA molecules have a good affinity for the etched brass substrate via the condensation reaction, in which the carboxyl group (COO–H) combines with the hydroxyl group (–OH) in the brass and releases water, forming CH3(CH2)16COO–brass.34,35
3.2 Mechanical and thermal stability
Mechanical durability plays a key role in the use of superhydrophobic surfaces in industrial applications.36–38 In this paper, we used a bending test and an abrasion test to assess the stability of the superhydrophobicity. Fig. 6a and b shows images from two views of water droplets on the bent superhydrophobic brass. It can be clearly seen that after bending to an angle of 60°, the bent surface still had excellent superhydrophobic properties. The droplets in the bent area retained a spherical shape and slid off freely with little resistance. The SEM image of the fold is shown in Fig. 6c. It can be seen that only a small portion of the micro–nanostructure was lost from the substrate while most of the original structure was still in place, and what remained had no observable changes. Thus, the as-prepared sample maintained its water repellency. | ||
| Fig. 6 (a and b) Optical photographs showing the shape of the water droplets on the bent surface. (c) SEM image of the fold. | ||
The steps of the abrasion test are shown in Fig. 7a. The as-prepared sample was pushed on 1200 grit SiC sandpaper at a speed of 2 cm s−1 with a weight of 50 g which provided 2.5 kPa of applied pressure. The distance moved was 40 cm in one direction. After abrasion, the CA decreased to 137.7°. Interestingly, the droplet stuck to the surface and did not roll off even when the sample was positioned vertically, and this is called sticky hydrophobicity.39 Fig. 7b and c shows the SEM images of the superhydrophobic brass surface after abrasion. The upper part of the hemispherical structure was scraped, causing partial damage to the morphology. Moreover, as the upper layer of STA molecules were bound to each other only via van der Waals interactions, partially adsorbed STA molecules rubbed off the sample under mechanical stress and resulted in the change in the surface free energy.5 Thus, the abrasion process affected the wetting behavior of the brass surface and was responsible for the switch from non-sticky superhydrophobicity to sticky hydrophobicity.
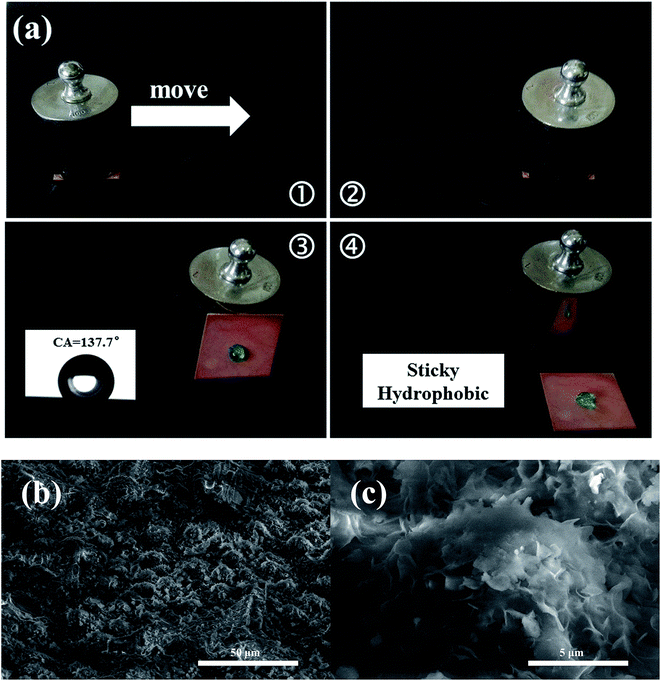 | ||
| Fig. 7 (a) Steps of the abrasion test on the superhydrophobic brass surface. (b and c) SEM images of the superhydrophobic brass surface after abrasion. | ||
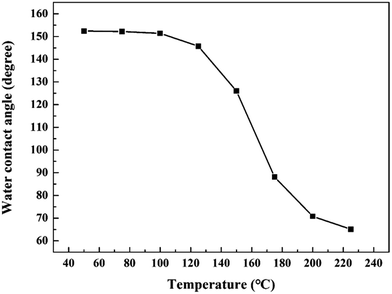
In many applications, brass surfaces are exposed to heat, and so it is necessary to assess the thermal stability of the superhydrophobic brass surface at high temperatures. To investigate this, the as-prepared samples were annealed from 50 to 225 °C for 5 min, and the CAs are given in Fig. 8. When the temperature was below 100 °C, the values of the CA were above 150°, indicating that the surface still retained a sufficient amount of its superhydrophobicity. Then the CA decreased significantly with an increase in temperature, and this was due to the STA decomposition/oxidation. Thus, the surface we fabricated may not be applied in strong thermal environments. This is a problem we want to solve in future work. Additionally, after being exposed to air for one month, the as-prepared surface still retained its superhydrophobicity, and the CA had no remarkable change.
3.3 Self-cleaning property
Self-cleaning is defined as the spontaneous roll-to-clean strategy of a surface,40 and this is illustrated in Fig. 9a. To test the self-cleaning property of the as-prepared surface, we covered it with carbon dust to simulate an extremely dusty environment (Fig. 9b). As the water droplets rolled off the surface quickly, the dust particles were carried away, and the sample was clean within a short time (Fig. 9c). This can be explained by the combined effects of the high hydrophobicity of the surface and the poor adhesive force between the carbon dust and the as-prepared sample. Thus, the self-cleaning ability of the as-prepared surface could readily shelter substrates from pollution in actual applications. | ||
| Fig. 9 (a) Model of self-cleaning, and (b and c) the self-cleaning behavior of the superhydrophobic brass surface. | ||
4. Conclusions
In this study, a superhydrophobic brass surface with a CA of 152.4° was successfully fabricated using a simple and fast micro-etching technique followed by STA modification. The micro-etching time had a major impact on the surface hydrophobicity, and the best effect was with a reaction time of 6 min. The whole fabrication process was finished within 10 min, and all of the required equipment and materials were accessible and affordable. After the bending test and the abrasion test, the as-prepared surface retained good water-repellency and showed good mechanical resistance. Moreover, the surface transformed from non-sticky superhydrophobic to sticky hydrophobic after abrasion. In addition, carbon dust was easily removed from the surface under the action of rolling water drops, and this indicates an excellent self-cleaning ability. We propose that the present method is an effective approach for constructing superhydrophobic surfaces on brass substrates and can be further extended to a variety of industrial applications.Acknowledgements
The authors are very grateful for the support from the National Training Program of Innovation and Entrepreneurship for Undergraduates (No. 201610145034) and the Joint Funds of NSFC-Liaoning (U1508213). The first author (Junyang Tan) and the second author (Junjie Hao) contributed equally to this work.References
- J. Long, P. Fan, D. Gong, D. Jiang, H. Zhang, L. Li and M. Zhong, ACS Appl. Mater. Interfaces, 2015, 7, 9858–9865 CAS.
- C. Liu, J. Ju, Y. Zheng and L. Jiang, ACS Nano, 2014, 8, 1321–1329 CrossRef CAS PubMed.
- G. D. Bixler and B. Bhushan, Nanoscale, 2014, 6, 76–96 RSC.
- J. K. Oh, X. Lu, Y. Min and M. Akbulut, ACS Appl. Mater. Interfaces, 2015, 7, 19274–19281 CAS.
- F. Su and K. Yao, ACS Appl. Mater. Interfaces, 2014, 6, 8762–8770 CAS.
- S. Wooh, H. Huesmann, M. N. Tahir, M. Paven, K. Wichmann, D. Vollmer, W. Tremel, P. Papadopoulos and H. Butt, Adv. Mater., 2015, 27, 7338–7343 CrossRef CAS PubMed.
- W. Barthlott and C. Neinhuis, Planta, 1997, 202, 1–8 CrossRef CAS.
- J. V. I. Timonen, M. Latikka, L. Leibler and R. H. A. Ras, Science, 2013, 341, 253–257 CrossRef CAS PubMed.
- A. Checco, A. Rahman and C. T. Black, Adv. Mater., 2014, 26, 886–891 CrossRef CAS PubMed.
- Q. Li, Y. Wang, C. Rong, F. Zhang, Y. Liu, L. Chen, Q. Wang and C. Peng, Ceram. Int., 2016, 42, 2829–2835 CrossRef CAS.
- S. Cai, Y. Zhang, H. Zhang, H. Yan, H. Lv and B. Jiang, ACS Appl. Mater. Interfaces, 2014, 6, 11470–11475 CAS.
- S. S. Latthe, C. Terashima, K. Nakata, M. Sakai and A. Fujishima, J. Mater. Chem. A, 2014, 2, 5548–5553 CAS.
- M. Boudot, V. Gaud, M. Louarn, M. Selmane and D. Grosso, Chem. Mater., 2014, 26, 1822–1833 CrossRef CAS.
- S. Zhang, J. Huang, Y. Tang, S. Li, M. Ge, Z. Chen, K. Zhang and Y. Lai, Small, 2016, 13, 201600687 Search PubMed.
- T. Darmanin, E. T. Givenchy, S. Amigoni and F. Guittard, Adv. Mater., 2013, 25, 1378–1394 CrossRef CAS PubMed.
- Y. Wu, K. Liu, B. Su and L. Jiang, Adv. Mater., 2014, 26, 1124–1128 CrossRef CAS PubMed.
- L. B. Boinovich, A. G. Domantovskiy, A. M. Emelyanenko, A. S. Pashinin, A. A. Ionin, S. I. Kudryashov and P. N. Saltuganov, ACS Appl. Mater. Interfaces, 2014, 6, 2080–2085 CAS.
- H. B. Jiang, Y. L. Zhang, D. D. Han, H. Xia, J. Feng, Q. D. Chen, Z. R. Hong and H. B. Sun, Adv. Funct. Mater., 2014, 24, 4595–4602 CrossRef CAS.
- Y. H. Yeong, C. Wang, K. J. Wynne and M. C. Gupta, ACS Appl. Mater. Interfaces, 2016, 8, 32050–32059 CAS.
- X. Chen, Y. N. Liang, X. Z. Tang, W. Shena and X. Hu, Chem. Eng. J., 2017, 308, 18–26 CrossRef CAS.
- X. Xue, C. Yu, J. Wang and L. Jiang, ACS Nano, 2016, 10, 10887–10893 CrossRef CAS PubMed.
- C. Meran, Mater. Des., 2006, 27, 719–726 CrossRef CAS.
- H. Jie, Q. Xu, L. Wei and Y. Min, Corros. Sci., 2016, 102, 251–258 CrossRef CAS.
- D. V. Ta, A. Dunn, T. J. Wasley, R. W. Kay, J. Stringer, P. J. Smith, C. Connaughton and J. D. Shephard, Appl. Surf. Sci., 2015, 357, 248–254 CrossRef CAS.
- H. Wang, J. Yu, Y. Wu, W. Shao and X. Xu, J. Mater. Chem. A, 2014, 2, 5010–5017 CAS.
- L. Li, T. Huang, J. Lei, J. He, L. Qu, P. Huang, W. Zhou, N. Li and F. Pan, ACS Appl. Mater. Interfaces, 2015, 7, 1449–1457 CAS.
- Q. Zhu, Y. Chu, Z. Wang, N. Chen, L. Lin, F. Liu and Q. Pan, J. Mater. Chem. A, 2013, 1, 5386–5393 CAS.
- R. Gao, Q. Liu, J. Wang, X. Zhang, W. Yang, J. Liu and L. Liu, Chem. Eng. J., 2014, 241, 352–359 CrossRef CAS.
- W. Liu, Q. Xu, J. Han, X. Chen and Y. Min, Corros. Sci., 2016, 110, 105–113 CrossRef CAS.
- M. Qu, B. Zhang, S. Song, L. Chen, J. Zhang and X. Cao, Adv. Funct. Mater., 2007, 17, 593–596 CrossRef CAS.
- A. B. D. Cassie and S. Baxter, Trans. Faraday Soc., 1944, 40, 546–551 RSC.
- Y. Qing, C. Yang, C. Hu, Y. Zheng and C. Liu, Appl. Surf. Sci., 2015, 326, 48–54 CrossRef CAS.
- Y. Qing, C. Yang, Z. Yu, Z. Zhang, Q. Hu and C. Liu, J. Electrochem. Soc., 2016, 163, D385–D391 CrossRef CAS.
- Y. Liu, X. Yin, J. Zhang, S. Yu, Z. Han and L. Ren, Electrochim. Acta, 2014, 125, 395–403 CrossRef CAS.
- Y. Huang, D. K. Sarkar and X. Chen, Appl. Surf. Sci., 2015, 327, 327–334 CrossRef CAS.
- S. S. Latthe, P. Sudhagar, A. Devadoss, A. M. Kumar, S. Liu, C. Terashima, K. Nakata and A. Fujishima, J. Mater. Chem. A, 2015, 3, 14263–14271 CAS.
- X. Tian, T. Verho and R. H. A. Ras, Science, 2016, 352, 142–143 CrossRef CAS PubMed.
- N. Wang, D. Xiong, Y. Deng, Y. Shi and K. Wang, ACS Appl. Mater. Interfaces, 2015, 7, 6260–6272 CAS.
- Y. Lai, F. Pan, C. Xu, H. Fuchs and L. Chi, Adv. Mater., 2015, 262, 210–216 Search PubMed.
- S. S. Latthe, P. Sudhagar, C. Ravidhas, A. J. Christy, D. D. Kirubakaran, R. Venkatesh, A. Devadoss, C. Terashima, K. Nakata and A. Fujishima, CrystEngComm, 2015, 17, 2624–2628 RSC.
| This journal is © The Royal Society of Chemistry 2017 |

