 Open Access Article
Cobalt supported on Zr-modified SiO2 as an efficient catalyst for Fischer–Tropsch synthesis
Y. J. Wu *abc,
W. T. Zhangd,
M. M. Yangb,
Y. H. Zhaoe,
Z. T. Liu
 a and
J. Y. Yanc
aKey Laboratory of Applied Surface and Colloid Chemistry (MOE), School of Chemistry & Chemical Engineering, Shaanxi Normal University, Xi'an 710062, China. E-mail: yjwu76@163.com
bDepartment of Chemistry and Chemical Engineering, Shaanxi Xueqian Normal University, Xi'an, 710100, China
cSchool of Chemistry and Material Science, Hebei Normal University, Shijiazhuang, 050024, China
dHebei Electric Power Research Institute, No. 239, Tiyu Street, Yuhua District, Shijiazhuang, 050021, China
eSchool of Chemistry and Environmental Engineering, Liaoning University of Technology, Jinzhou 121001, Liaoning, People's Republic of China
First published on 3rd May 2017
Abstract
Amorphous silica–zirconium (SZx) has been synthesized via the sol–gel method accompanied by phase separation in the presence of propylene oxide (PO) and poly(ethylene oxide) (PEO). Herein x is the mol% of zirconium (Zr), i.e. 0, 1.5, 2.8, 5.6 and 8.9 mol%, respectively. 13% wt% cobalt-based SZx (Co/SZx) catalysts were prepared by an impregnation method. The Co/SZ catalysts were characterized by XRD, N2 adsorption–desorption, ESEM, H2-TPR and NH3-TPD. The catalytic behavior of Co/SZx was investigated for the Fischer–Tropsch (FT) reaction via a fixed-bed reactor under the conditions of 1.0 MPa, H2/CO = 2, W/F = 5.05 g h mol−1 and 235 °C. The results indicated that CO conversion followed the order of Co/SZ2.8 > Co/SZ1.5 > Co/SZ0 > Co/SZ5.6% > Co/SZ8.9. The activity differences for FT synthesis are mainly ascribed to the differences in SZx such as Zr dosage, pore structure and aggregation extent, which are also the direct reasons for the various Co dispersions on SZx. The existence of Zr in the Co/SZ catalysts leads to a decrement of the selectivity to CO2/C5+, and an increase of C2–C4 selectivity and N-p/O value. Overall, the Co/SZ2.8 catalyst exhibited the top FT reaction activity, top yield of C5+ and lowest selectivity to methane and C2–C4 among all the Co/SZ catalysts.
Introduction
Fischer–Tropsch synthesis (FTS) is an attractive option for the production of synthetic fuels. Much interest in FTS originates from the wide variety of carbon sources that can be used to produce synthesis gas, such as biomass, coal, or natural gas.1,2 Additionally, the hydrocarbons produced by FTS are benign to the environment because they are free of sulfur, nitrogen, and aromatics.3 Generally, Fe,4 Co,5 and Ru6 are the active metals for FTS catalysts. However, in contrast with iron- and Ru-based catalysts, Co-based catalysts have such advantages as high activity, long service life and products with unbranched long-chain hydrocarbons found in diesel fuels.7,8 In order to obtain a high density of metal sites (Co0), cobalt precursors are usually dispersed on porous supports, such as amorphous SiO2, Al2O3, ZrO2, etc.9–11 Among these oxides, SiO2 is considered as inert oxide, whereas ZrO2 and Al2O3 are considered as active oxides, being more interacting with the supported metals. The use of a strongly interacting oxide like alumina may increase the dispersion but decrease the reducibility. Contrarily, the use of the inert oxide like silica generally leads to a good reducibility but to an easy sintering of the Co metal. To address these problems, promoters, such as noble metal (e.g., Pt, Pt,12 Ru,13 and Re14) are often used to compromise between the cobalt dispersion and reduction degree of metallic cobalt.15 Zirconium, as a cheap promoter, has been paid attention because it may influence Co reduction, dispersion and FTS activity and selectivity. Usually, the fabrication method of zirconium-modified catalysts is impregnation, i.e., as-prepared support is impregnated with Zr-included salt (e.g., ZrO(NO3)2).16–18To tune the metal–support interaction, in the present study, the two types of oxides, ZrO2 and SiO2, are combined together to form the support for FTS cobalt catalyst. ZrO2 is added by preparation of silica–zirconium xerogel via sol–gel method accompanied by phase separation (SGP). Sol–gel-PS is known as a promising technique for fabricating monolithic materials with a hierarchical porous structure. This method has been used to fabricate porous SiO2,19 TiO2,20 Al2O3,21 ZrO2![[thin space (1/6-em)]](https://www.rsc.org/images/entities/char_2009.gif) 22 and mixed oxides such as Mg–Al hydrotalcite-type LDHs,23 mullite24 and silica–zirconia.25
22 and mixed oxides such as Mg–Al hydrotalcite-type LDHs,23 mullite24 and silica–zirconia.25
However, few reports have been found that silica support modification by ZrO2 prepared by SGP using ionic precursor as the zirconia source. The aim of the present investigation is (1) examine the effects of zirconium content on the properties of silica–zirconia (SZ) prepared by SGP taking zirconium oxychloride (ZrOCl2·8H2O) and tetraethylorthosilicate (TEOS) as ZrO2 and silica source, respectively; (2) explore the feasibility and effect mechanism of zirconium content on the catalytic activity of Co/SZ catalysts and the hydrocarbon distribution of FTS product. These results may provide useful information on the design of FTS catalyst.
Experimental
Preparation of silica–zirconium xerogel (SZ) and Co/SZ catalysts
Zirconium oxychloride (ZrOCl2·8H2O) and tetraethylorthosilicate (TEOS) were used as a zirconium and silica source, respectively. A mixture of distilled water and ethanol (EtOH) was used as a solvent. Poly(ethylene oxide) (PEO; Mv = 1 × 10⁶) was used as a phase separation inducer. (±)-Propylene oxide (PO) was added as a proton scavenger to initiate gelation. Isopropylalcohol (IPA; 99.7%) was used to exchange the solvent of wet gels. Cobalt(II) nitrate (Co(NO3)2·6H2O) was used as the cobalt source. All the agents were purchased from Sinopharm Chemical Reagent Co., Ltd., China.A series of zirconium-doped silica-based oxides in which the zirconium content was varied from 0 to 9 mol% were prepared as follows. TEOS (20 mmol), ZrOCl2·8H2O (0, 0.3, 0.6, 1.2 or 2.0 mmol) and PEO (50.0 mg, 5 × 10⁻⁵ mmol) were dissolved in a mixture of water (6.00 mL; 333 mmol) and ethanol (5.00 mL; 85.7 mmol). At 25 °C, PO (1.0 mL; 26.2 mmol) was added to this solution and stirred for 1 min to form a homogeneous sol. The final sol was regulated to pH 4.5 by HCl (3 mol L−1) and was transferred into a polystyrene container, sealed, and kept at 60 °C to form a wet gel. The wet gel was aged for 12 h at 60 °C, subjected to solvent exchange with isopropylalcohol and then dried at 60 °C for 12 h. The resultant xerogels were subsequently heat-treated at 600 °C for 5 h with a heating rate of 2 °C min−1. The obtained amorphous SZ having 0, 1.5, 3, 6 and 9 mol% of zirconium (Zr) calculated by 100 × Zr/(Zr + Si) were denoted as SZ0, 1.5, 2.8, 5.6 and 8.9 based on the results of XRF characterization, respectively.
Above SZ supports were impregnated by incipient wetness with a solution of cobalt nitrate. The final cobalt content is 13 wt% calculated by 100 × Co/(Co + SZ). Here Co and SZ are their mass, respectively. The sample was dried for 12 h and subsequently calcined at 350 °C in air for 3 h. The catalysts were denoted as Co/SZ0, Co/SZ1.5, Co/SZ2.8, Co/SZ5.6, Co/SZ8.9 according to the nomination of SZ.
Characterization of SZ and Co/SZ catalysts
The BET surface areas, pore volumes and pore size distribution were estimated from nitrogen adsorption and desorption isotherm data obtained at −196 °C using a constant-volume adsorption apparatus (Micromeritics, ASAP-2400). The pore volumes were determined at a relative pressure (P/Po) of 0.99. The calcined samples were degassed at 300 °C under a He flow for 4 h before the measurements. The pore size distributions of the samples were determined by the BJH (Barrett–Joyner–Halenda) model from the data of desorption branch of the nitrogen isotherms.The X-ray diffraction (XRD) patterns of SZ and Co/SZ catalysts were obtained at room temperature on a Bruker D8 Advance X-ray diffractometer using monochromatised Cu/Kα radiation (40 kV, 40 mA). The samples were scanned with a step size of 0.02° and a counting time of 0.2 s per step. The average crystallite size of Co3O4 was estimated by using the (311) diffraction at 2θ of about 36.8° and the Scherer's equation. The crystal size of the metallic cobalt in the reduced catalysts was calculated according to the equation of d(Co0) = 0.75d(Co3O4). Cobalt metal dispersion Dx(%) was calculated by using Dx (%) = 96/d(Co0). The elemental analysis of SZ sample was further analyzed by using the X-ray fluorescence (XRF; SEA5120).
The morphology of the fresh SZ supports was characterized separately by using the environmental scanning electron microscope (ESEM; Quanta200, FEI, American).
Temperature programmed reduction (TPR) profiles of calcined catalysts were recorded using a Micromeritics Autochem 2920 apparatus equipped with a thermal conductivity detector (TCD). A sample (0.05 g) was pretreated by purging with flowing argon at 350 °C to remove traces of water. The TPR was performed using a 10% H2/Ar mixture and referenced to argon at a flow rate of 30 cm3 min−1. The sample was heated from 50 to 900 °C using a heating ramp of 10 °C min−1.
The temperature-programmed desorption of H2 (H2-TPD) and NH3 (NH3-TPD) were performed on a Micromeritics Autochem 2920 instrument, respectively.
For H2-TPD, a sample (0.10 g) was reduced in pure H2 (30 mL min−1) at 400 °C for 4 h. After the system was cooled to 70 °C, Ar (30 min−1) was introduced into the sample tube for 1 h to remove the physically absorbed H2. H2-TPD curve was then obtained by increasing the temperature from 70 °C to 410 °C at a heating rate of 10 °C min−1 under a He flow of 30 mL min−1. Cobalt metal dispersion was calculated according to the expected 1/1 H/Co adsorption stoichiometry and the loading of cobalt.
For NH3-TPD, a sample (0.050 g) was pretreated with Ar at 550 °C for 1 h. The sample was pretreated with 5% NH3/He mixture for 0.5 h after it was cooled down to 120 °C and then the system was purged by pure He. Finally, NH3-TPD was performed by increasing the temperature from 120 °C to 550 °C at a heating rate of 10 °C min−1 under a He flow of 30 mL min−1.
FT performance of Co/SZ catalysts
Prior to activity test, the catalysts were activated in a fixed-bed reactor (I.D. = 10.0 mm) for 4 h with high-purity H2 (50 mL min−1) at 400 °C. The activity tests were conducted for around 10 h under the following reaction conditions; reaction T = 235 °C, P = 1.0 MPa, W/F = 5.0 g h mol−1, feed composition (H2/CO/Ar, mol%) = 64.11/31.90/3.99. The effluent gas from the reactor was analyzed by an online gas chromatograph (GC-9560, Shanghai Huaai) employing a HP-PONA capillary column (0.20 mm × 50 m, 0.5 μm) connected with FID for the analysis of hydrocarbons and a Porapack Q/molecular sieve (5 Å) packed column connected with TCD for the analysis of carbon oxides and Ar was selected as an internal standard gas.Results and discussion
Texture and structure of SZ samples
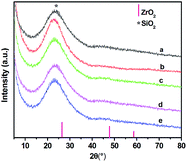
Table 1 shows the weight percentages (wt%) of SiO2 and ZrO2 and calculated Zr mol% in SZ samples, obtained by means of XRF. All SZ samples appear a broad peak at 2θ value of 23°, which is ascribed to the characteristic diffraction of amorphous silica (Fig. 1). No obvious diffractions from ZrO2 can be detected as the zirconium content varied from 1.5 to 8.9 mol% in SZ samples indicating that zirconium was well dispersed through the silica network.| Molar ratio (Si/Zr) | SiO2 (wt%) | ZrO2 (wt%) | Zr (mol%) from XRF (mol%) |
|---|---|---|---|
20![[thin space (1/6-em)]](https://www.rsc.org/images/entities/char_2009.gif) : :![[thin space (1/6-em)]](https://www.rsc.org/images/entities/char_2009.gif) 0.0 0.0 |
100 | 0 | 0 |
20![[thin space (1/6-em)]](https://www.rsc.org/images/entities/char_2009.gif) : :![[thin space (1/6-em)]](https://www.rsc.org/images/entities/char_2009.gif) 0.3 0.3 |
97.0 | 3.0 | 1.5 |
20![[thin space (1/6-em)]](https://www.rsc.org/images/entities/char_2009.gif) : :![[thin space (1/6-em)]](https://www.rsc.org/images/entities/char_2009.gif) 0.6 0.6 |
94.4 | 5.6 | 2.8 |
20![[thin space (1/6-em)]](https://www.rsc.org/images/entities/char_2009.gif) : :![[thin space (1/6-em)]](https://www.rsc.org/images/entities/char_2009.gif) 1.2 1.2 |
89.2 | 10.8 | 5.6 |
20![[thin space (1/6-em)]](https://www.rsc.org/images/entities/char_2009.gif) : :![[thin space (1/6-em)]](https://www.rsc.org/images/entities/char_2009.gif) 2.0 2.0 |
83.3 | 16.7 | 8.9 |
The mesoporous structure of SZ samples has been confirmed by N2-adsorption/desorption isotherms (Fig. 2). The sample presents type IV isotherm (definition by IUPAC)26 which is characteristic of mesoporous material. The appearance of type H-1 hysteresis loop in the isotherm indicates the presence of uniform pores in SZ samples, which is also confirmed by the inset of Fig. 2.27 It can be seen from Table 2 that trace ZrO2 markedly enhances the surface area with respect to the pure silica. This indicates addition of trace ZrO2 into SiO2 improves the thermal stability of the pore structure both in micro- and meso-pore scales. However, the BET surface area, average pore diameter and pore volume decrease with the increasing of Zr content because Zr-rich samples are denser and more aggregation in Texture than those with low Zr content.28
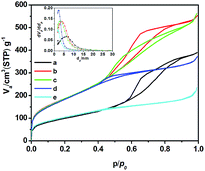 | ||
| Fig. 2 Nitrogen adsorption/desorption isotherms of SZ samples (a), SZ0 (b), SZ1.5 (c), SZ2.8 (d), SZ5.6 (e), SZ8.9. | ||
| Samples | BET surface area (m2 g−1) | Pore volume (cm3 g−1) | Average pore diameter (nm) |
|---|---|---|---|
| SA0 | 357.8 | 0.60 | 6.7 |
| SA1.5 | 693.5 | 0.88 | 5.2 |
| SA2.8 | 686.6 | 0.87 | 5.1 |
| SA5.6 | 568.1 | 0.54 | 3.8 |
| SA8.9 | 372.0 | 0.36 | 3.3 |
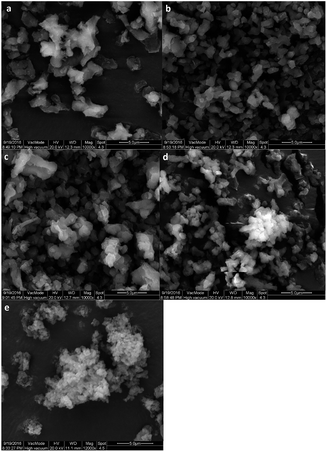
The aggregation phenomenon can be confirmed by the ESEM images of SZ samples (Fig. 3). As shown in Fig. 3, Trace of doped zirconium (Fig. 3b and c) is favor for the stability of silica matrix. However, aggregation becomes heavier with the increasing of Zr content (Fig. 3d and e), which is unhelpful for the catalytic performance of a material.
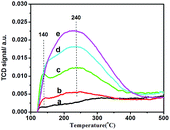
Mixed oxides often show greatly enhanced acid activity compared with the individual component oxides due to a charge imbalance imposed upon the minor component oxide by the imposition of the bond matrix.29 Herein SZx sample is also so. As shown in Fig. 4, The TCD signal of NH3-TPD at 140 °C and 240 °C significantly increases with the increment of Zr content from 0 to 8.9 mol% (Fig. 4), indicating Zr markedly increases the acid density of SZ mixed oxides.
Structure analysis and reduction behavior of Co/SZx the catalysts
The XRD patterns of the Co/SZx catalysts are given in Fig. 5. Comparing the results in Fig. 4 and 1, The new diffraction peaks at 2θ of 19.1, 31.4, 36.8, 44.9, 59.6, and 65.5° are well agreeable with the standard pattern of cubic Co3O4 (JCPDS65-3103), indicating that cobalt species over all of the calcined catalysts are primarily in the form of crystalline Co3O4. Moreover, the strength of the diffraction peak at 2θ of 36.8° increases with the increment of Zr content, indicating that crystallization extent of Co3O4 increases. This can be confirmed by the estimated sizes of Co3O4 based on various Zr content of Table 3. The particles size of metallic Co obtained from XRD increases from 8.0 to 11.9 nm with the increasing of Zr content from 0 to 8.9 mol%, which is well agreeable with that the results obtained H2-TPD. The dispersion of metallic Co has a decrement tendency with the increasing of doped Zr. This may be originated from the gradually strengthened interactions between cobalt and the SZ supports due to the gradually heavier aggregation, decreased BET surface area and pore parameters of SZ samples.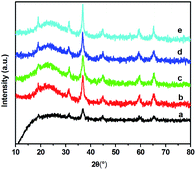 | ||
| Fig. 5 XRD patterns for Co/SZ catalysts (a), Co/SZ0 (b), Co/SZ1.5 (c), Co/SZ2.8 (d), Co/SZ5.6 (e), Co/SZ8.9. | ||
| Catalyst | XRD | H2-TPD | |||
|---|---|---|---|---|---|
| d(Co3O4) (nm) | d(Co0) (nm) | Dx (%) | d(Co0) (nm) | Dx (%) | |
| Co/SZ0 | 10.6 | 8.0 | 12.0 | 7.6 | 7.9 |
| Co/SZ1.5.9 | 12.5 | 9.4 | 10.2 | 9.1 | 7.4 |
| Co/SZ2.8 | 12.7 | 9.5 | 10.1 | 8.7 | 6.9 |
| Co/SZ5.6 | 13.4 | 10.0 | 9.6 | 9.7 | 6.4 |
| Co/SZ8.9 | 15.9 | 11.9 | 8.1 | 12.1 | 6.0 |
The TPR patterns are displayed in Fig. 6. The reduction peak of Co/SZ1.5–8.9 corresponding to first step reduction of Co3O4 to CoO shows the similar temperature (270 °C) in comparison with that of Co/SZ0 catalyst. However, the reduction peak of Co/SZ1.5–8.9 corresponding to the second step reduction of CoO to Co moves to lower temperature (315 °C) in comparison with that (388 °C) of Co/SZ0 catalyst. Meanwhile, the H2-TPR profiles of Co/SZ1.5–8.9 catalysts appear an obvious high-temperature reduction peak (>600 °C) that may be attributed to the reduction of cobalt species having strong interactions with SZ support, which is difficult to be reduced as commonly revealed.30
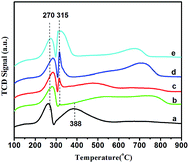 | ||
| Fig. 6 H2-TPR profiles for Co/SZ catalysts (a) Co/SZ0, (b) Co/SZ1.5, (c) Co/SZ2.8, (d) Co/SZ5.6, (e) Co/SZ8.9. | ||
FT performance
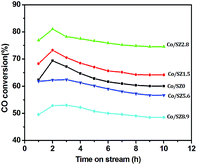
The time-on-stream (TOS) CO conversion profiles displayed a fast increase from 1 h to 2 h followed by a slow decrease phase where CO conversion reaches a steady state at a TOS of about 6 h for all of catalysts (Fig. 7). The steady CO conversion substantially increases from 59.5% to 75.4% as Zr content is increased from 0 to 2.8 mol%, which indicates that trace Zr improve the FT activity of catalyst. This can be ascribed to the role of doped Zr that increases the pore volume (Table 2) and decreases the reduction temperature of Co3O4 from CoO to Co (Fig. 6), i.e., exist of trivial Zr enhance the amount of the active phase (Co0) for the Co/SZ1.5 and Co/SZ2.8 catalysts. However, as Zr content is further increased to 5.6 and 8.9 mol%, the CO conversion decreases to 56.5 and 48.6%, respectively. This may be ascribed to the heavy aggregation of SZ5.6 and 8.9 (Fig. 3), which directly lead to abbreviation of pore parameters, decrease of reduction degree for Co3O4 and increase of Co size.The steady results of product distribution (TOS = 10 h) are summarized in Table 3. In comparison to the results over Co/SZ0, The CO2 selectivity is slightly decreased and the methane selectivity has no obvious changes over Co/SZ1.5–8.9 catalysts under the same reaction conditions. This may be partly ascribed to the carbonization of methane in the presence of CO2 expressed by eqn (1)–(4).31
 | (1) |
 | (2) |
 | (3) |
 | (4) |
 | (5) |
In comparison to the results over Co/SZ0, The C2–C4 selectivity and the value of N-p/O over Co/SZ1.5–8.9 catalysts are increased. The selectivity of C5+ hydrocarbons slightly decreased over Co/SZ1.5–8.9 catalysts. This may be ascribed to the synergistic effect of (1)–(5) reactions and the hydrocracking reactions of long-chain FT hydrocarbons resulted from the acidity of catalyst. Taking Co/SZ8.9 catalyst as an example, its highest amount of acidic sites (Fig. 3) versus the highest selectivity of C2–C4 and the lowest selectivity of C5+ hydrocarbons (Table 4) supports this explanation. Overall, Co/SZ2.8 catalyst shows the best FT activity and the top yield to C5+ hydrocarbons.
| Catalyst | CO2 sel. (%) | Hydrocarbon distribution (%) | ||||
|---|---|---|---|---|---|---|
| CH4 | C2–C4 | N-p/Ob | C5+ | C5+ yield | ||
| a Reaction conditions: catalyst weight = 0.5 g, T = 235 °C, P = 1.0 MPa, W/F = 5.0 g h mol−1, H2/CO = 2.b The molar ratio of normal paraffin to olefin in C2–C4 hydrocarbons. | ||||||
| Co/SZ0 | 2.4 | 18.5 | 10.0 | 3.30 | 73.1 | 43.5 |
| Co/SZ1.5 | 1.8 | 19.1 | 12.1 | 4.05 | 68.8 | 44.2 |
| Co/SZ2.8 | 1.2 | 17.3 | 11.7 | 4.07 | 71.0 | 52.8 |
| Co/SZ5.6 | 1.1 | 18.1 | 12.8 | 4.43 | 69.1 | 39.0 |
| Co/SZ8.9 | 0.7 | 19.0 | 13.4 | 4.56 | 67.6 | 32.8 |
Comparisons of FTS properties of Co/SZ2.8 catalyst with other Zr modified FTS materials
Direct comparisons of FTS properties of Co/SZ2.8 catalyst with other Zr modified cobalt-based FTS materials are very difficult due to the different applied experimental conditions. The FTS properties of similar dosage of Zr-modified cobalt-based catalyst are summarized in Table 5.| Catalysts | Preparation method | CO con. (%) | CH4 sel. (%) | C5+ sel. (%) | C5+ yield |
|---|---|---|---|---|---|
| a Incipient wetness impregnation (IWI).b Co-precipitation (CP). | |||||
9.4%Co–Zr/SiO2![[thin space (1/6-em)]](https://www.rsc.org/images/entities/char_2009.gif) 16 16 |
IWIa | 3.0 | 22.0 | 60.0 | 1.8 |
25%Co–Zr/Al2O3![[thin space (1/6-em)]](https://www.rsc.org/images/entities/char_2009.gif) 18 18 |
IWI | 50.0 | 6.2 | 87.5 | 43.7 |
20%Co–Zr/SiO2![[thin space (1/6-em)]](https://www.rsc.org/images/entities/char_2009.gif) 32 32 |
CPb | 45.8 | 14.1 | 75.0 | 34.3 |
| 13%Co–Zr/SiO2 (here) | SGP + IWI | 75.4 | 17.3 | 71.0 | 52.8 |
The CO conversion and C5+ yield of 13%Co–Zr/SiO2, i.e., Co/SZ2.8 in this study, are the highest in the Zr-modified cobalt-based catalysts reported in the ref. 13–15 and 29 although its Co loading is only 13%. Therefore, SZx, fabricated by a simple preparation process, is promising as a support used for FTS catalyst.
Conclusions
Herein amorphous SZx was prepared by sol–gel route accompanied by phase separation. Co-based silica–zirconia catalysts with various mol% of zirconium content were prepared by impregnation method. SZx were characterized by XRD, N2 adsorption–desorption, ESEM, H2-TPR and NH3-TPD, respectively. The zirconium content in SZx has a key effect on the structural and textural properties of SZx and Co/SZx such as the surface area, acidity, mean particle size of Co and reducibility. The surface area of SZx decreases from 693.6 to 373.0 m2 g−1 as zirconium content increases from 1.5% to 8.9 mol%. The mean particle size of Co from Co/SZx increased from 8.0 to 11.9 nm with the changes of zirconium content from 0 to 9 mol%. The order of the catalytic behavior is Co/SZ2.8 > Co/SZ1.5 > Co/SZ0 > Co/SZ5.6 > Co/SZ8.9. The existence of zirconium has an important effect on the selectivity to the products of FTS. The doped-Zr in Co/SZ catalysts lead to the decrement of the selectivity to CO2 and C5+, increase of C2–C4 selectivity and the increment of N-p/O. The possible mechanism is the synergistic effect of carbonization between methane and CO2 and the hydrocracking reactions of long-chain FT hydrocarbons. On the whole, Co/SZ2.8 catalyst shows the top yield to C5+ and lower selectivity to methane and C2–C4 among the Co/SZx catalysts.Acknowledgements
This work was supported by natural science foundation of china (No. 51402324), natural science foundation of Shaanaxi Province (2016JM2018) and natural science foundation of Hebei Province (B2015205172).Notes and references
- Q. Zhang, W. Deng and Y. Wang, J. Energy Chem., 2013, 22, 27 CrossRef CAS.
- M. E. Dry, Catal. Today, 2002, 71, 227 CrossRef CAS.
- C. Knottenbelt, Catal. Today, 2002, 71, 437 CrossRef CAS.
- X. B. Fan, N. Yan, Z. Y. Tao, D. E. Prof, C. X. X. Dr and K. P. Yuan, ChemSusChem, 2009, 2, 941 CrossRef CAS PubMed.
- C. Chen, H. Yuuda and X. Li, Appl. Catal., A, 2011, 396, 116 CrossRef CAS.
- C. X. Xiao, Z. P. Cai, T. Wang, Y. Kou and N. Yan, Angew. Chem., Int. Ed., 2008, 47(4), 746 CrossRef CAS PubMed.
- W. Ma, E. L. Kugler and D. B. Dadyburjor, Energy Fuels, 2007, 21, 1832 CrossRef CAS.
- A. Y. Khodakov, W. Chu and P. Fongarland, Chem. Rev., 2007, 107, 169 CrossRef PubMed.
- L. Shi, Y. Jin, C. Xing, C. Zeng, T. Kawabata, K. Imai, K. Matsuda, Y. Tan and N. Tsubaki, Appl. Catal., A, 2012, 435–436, 217 CrossRef CAS.
- G. Jacobs, P. M. Patterson, Y. Zhang, T. K. Das, J. Li and B. H. Davis, Appl. Catal., A, 2002, 233, 215 CrossRef CAS.
- Y. Liu, J. Chen, K. Fang, Y. Wang and Y. Sun, Catal. Commun., 2007, 8, 945 CrossRef CAS.
- A. K. Dalai and B. H. Davis, Appl. Catal., A, 2008, 348, 1 CrossRef CAS.
- Y. Sun, Q. W. Sun, F. K. Jiang, J. S. Liu and Z. S. Zhang, J. Fuel Chem. Technol., 2012, 40(1), 54 CrossRef CAS.
- B. Tymowski, Y. Liu, C. Meny, C. Lefèvre, D. Begin, P. Nguyen, C. Pham, D. Edouard, F. Luck and C. Pham-Huu, Appl. Catal., A, 2012, 419–420, 31 CrossRef.
- H. Iida, K. Sakamoto, M. Takeuchi and A. Igarashi, Appl. Catal., A, 2013, 466, 256 CrossRef CAS.
- R. J. Gregory and T. B. Alexis, ACS Catal., 2016, 6, 100 CrossRef.
- X. Zhou, Q. Chen, Y. Tao and H. Weng, Chin. J. Catal., 2011, 32, 1156 CrossRef CAS.
- W. Ma, G. Jacobs, P. Gao, T. Jermwongratanachai, W. D. Shafer, V. R. R. Pendyala, C. H. Yen and L. S. J. Klettlinger, Appl. Catal., A, 2014, 475, 314 CrossRef CAS.
- K. Nakanishi, J. Porous Mater., 1997, 4, 67 CrossRef CAS.
- G. Hasegawa, K. Kanamori, K. Nakanishi and T. Hanada, J. Am. Ceram. Soc., 2010, 93, 3110 CrossRef CAS.
- Y. Tokudome, K. Fujita, K. i. Nakanishi, K. Miura and K. Hirao, Chem. Mater., 2007, 19, 3393 CrossRef CAS.
- X. Guo, J. Song, Y. Lvlin, K. Nakanishi, K. Kanamori and H. Yang, Sci. Technol. Adv. Mater., 2015, 16, 25003 CrossRef PubMed.
- Y. Tokudome, N. Tarutani, K. Nakanishi and M. Takahashi, J. Mater. Chem. A, 2013, 7702 CAS.
- X. Guo, W. Li, K. Nakanishi, K. Kanamori, Y. Zhu and H. Yang, J. Eur. Ceram. Soc., 2013, 33, 1967 CrossRef CAS.
- R. Takahashi, S. Sato, T. Sodesawa and K. Suzuki, J. Am. Ceram. Soc., 2001, 84, 1968 CrossRef CAS.
- P. Bilyana, T. Boyko, B. Temenuzhka, P. Nartzislav, F. V. Leticia and O. A. Conchi, Chem. Eng. J., 2011, 8079, 1 Search PubMed.
- S. Hongbo and C. B. Elizabeth, Chemosphere, 2007, 68, 1807 CrossRef PubMed.
- J. A. Anderson, C. Fergusson, I. Rodrfguez-Ramos and A. Guerrero-Ruiz, J. Catal., 2000, 192, 344 CrossRef CAS.
- C. L. Thomas, Ind. Eng. Chem., 1949, 41, 2564 CrossRef CAS.
- Y. H. Zhao, Y. J. Wang, Q. Q. Hao, Z. T. Liu and Z. W. Liu, Fuel Process. Technol., 2015, 136, 87 CrossRef CAS.
- X. Wang, G. Qi, J. Xu, B. Li, C. Wang and D. Feng, Angew. Chem., Int. Ed., 2012, 51, 3850 CrossRef CAS PubMed.
- T. Miyazawa, T. Hanaoka, K. Shimura and S. Hirata, Appl. Catal., A, 2013, 467, 47 CrossRef CAS.
| This journal is © The Royal Society of Chemistry 2017 |

