DOI:
10.1039/C7RA03531D
(Paper)
RSC Adv., 2017,
7, 24149-24156
Facile synthesis of MoS2/reduced graphene oxide composites for efficient removal of Cr(VI) from aqueous solutions†
Received
27th March 2017
, Accepted 19th April 2017
First published on 3rd May 2017
Abstract
Cr(VI) as a common heavy metal contaminate has attracted much attention for its high toxicity and bioaccumulation. In this study, novel adsorbents, MoS2/reduced graphene oxide composites (MoS2/rGO), were prepared via a facile solvothermal process and effectively used for Cr(VI) adsorption. The MoS2/rGO was characterized by SEM, TEM, XRD, BET and XPS. Results showed that the MoS2 layers had been successfully grown on the surface of reduced graphene oxide layers. MoS2/rGO exhibited an enhanced surface area of 81.34 m2 g−1, more than rGO (57.20 m2 g−1) and MoS2 (1.57 m2 g−1). Batch adsorption experiments of Cr(VI) were also investigated. The pseudo-second order model best described the adsorption kinetics. Effective Cr(VI) removal occurred in a wide pH range from 2.0 to 10.0. The excellent adsorption capacity at 25 °C, calculated from the Langmuir isotherm model, was 268.82 mg g−1 at pH 2.0 and 192.63 mg g−1 at pH 4.6. The electrostatic attraction and reduction on the adsorbents surface was considered to be the possible mechanism of Cr(VI) removal. These studies revealed the potential application of MoS2/rGO for Cr(VI) removal.
1. Introduction
The removal of heavy metals from wastewater has attracted much attention due to their high toxicity, persistence and non-degradability in the ecosystem. Hexavalent chromium (Cr(VI)) is a widespread environmental and public health problem as it is widely used in metallurgical and chemical industries. Plenty of industrial effluents contain chromium species discharged from leather tanning, paint, steel, electroplating, wood preservation, textile industries, etc.1 It is known that both Cr(III) and Cr(VI) exist in industrial wastewater, while Cr(VI) is about 500 times more toxic than Cr(III) due to its carcinogenic properties. It can be easily adsorbed in the human body through the digestive system, respiratory tract and skin contact.2
There are various methods to remove Cr(VI) that have been reported, such as chemical precipitation, ion exchange, electrodeposition, filtration, adsorption, membrane separation, and reduction.3 Compared to these methods, adsorption is an easy, effective and flexible method for removing Cr(VI). Adsorbents used for Cr(VI) include activated carbon, chitosan, activated alumina, biomaterials, ethyl cellulose, zeolites, and modified graphene.3–5 Graphene, as a carbon material with a special one-atom thick structure, has received much attention. It has excellent thermal, electrical, optical, and mechanical properties. As reported, graphene is a promising adsorbent for removing heavy metals, dyes and fluoride ions from aqueous solutions.6 Reduced graphene oxide (rGO) is the product of incomplete reduction of graphene oxide (GO), which containing a number of the oxygen-containing functional groups. The existence of irreversible aggregation during the process of direct GO reduction in water limits the use of rGO for heavy metal adsorption. Molybdenum disulfide (MoS2) has been investigated in several fields including electrochemical devices, hydrogen storage, catalysis, capacitors, solid lubricants, and intercalation hosts due to its unique chemical and physical properties.7–9 It is known that MoS2 has an analogous structure to graphite, which is like a sandwich with a Mo layer between two S layers; these three atom layers stacked together in a through weak van der Waals interactions.10 As reported, MoS2 provides a large surface area for double-layer charge storage due to its special sheet-like structure,11 which may be used for metal ion adsorption. MoS2 embedded in graphene sheets through a simple hydrothermal method can be helpful for the reduction of overlapping and coalescing of graphene layers, enlarging the specific surface area and increasing the adsorption capacity of the material. The combination of graphene and MoS2 has already shown to have an excellent electrochemical performance,12 and it may also produce new properties through their interactions. In this study, we synthesized MoS2/rGO by a simple solvothermal process, which was used for removing Cr(VI) from aqueous solutions for the first time. The present study presents a new application of MoS2/rGO for the removal of Cr(VI) from aqueous solutions.
2. Materials and methods
2.1 Materials
Potassium dichromate (K2Cr2O7), thioacetamide (CH3CSNH2) and all acid reagents (HNO3) were of guaranteed grade. Ammonium molybdate ((NH4)6Mo7O24·4H2O) and the other chemicals and reagents used in the experiments were of analytical grade and used without further purification. All solutions were prepared using deionized water. All stopped conical flasks, beakers, centrifuge tubes, pipettes and containers were carefully cleaned and soaked in 10% HNO3 for one day, triply rinsed with deionized water and air-dried before use.
2.2 Methods
2.2.1 Preparation of MoS2/rGO. MoS2/rGO was prepared via a simple hydrothermal process. Briefly, graphene oxide was prepared by a modified Hummers method.6 Ammonium molybdate and graphene oxide at a mass ratio of 1![[thin space (1/6-em)]](https://www.rsc.org/images/entities/char_2009.gif) :
:![[thin space (1/6-em)]](https://www.rsc.org/images/entities/char_2009.gif) 9, ammonium molybdate and thioacetamide at a mass ratio of 1
9, ammonium molybdate and thioacetamide at a mass ratio of 1![[thin space (1/6-em)]](https://www.rsc.org/images/entities/char_2009.gif) :
:![[thin space (1/6-em)]](https://www.rsc.org/images/entities/char_2009.gif) 2, and 1080 mg of ammonium molybdate were dissolved in 40 mL of a 3 mg mL−1 graphene oxide aqueous dispersion. After ultrasonication and stirring for 1 h, aqueous NaOH was added until the pH value changed to 6.5. Furthermore, 2160 mg thioacetamide was added and ultrasonicated to form a homogeneous solution; the solution was transferred into a 50 mL Teflon-lined stainless steel autoclave, sealed tightly, and heated at 200 °C for 24 h in an electric oven. For comparison, mass ratios of 1
2, and 1080 mg of ammonium molybdate were dissolved in 40 mL of a 3 mg mL−1 graphene oxide aqueous dispersion. After ultrasonication and stirring for 1 h, aqueous NaOH was added until the pH value changed to 6.5. Furthermore, 2160 mg thioacetamide was added and ultrasonicated to form a homogeneous solution; the solution was transferred into a 50 mL Teflon-lined stainless steel autoclave, sealed tightly, and heated at 200 °C for 24 h in an electric oven. For comparison, mass ratios of 1![[thin space (1/6-em)]](https://www.rsc.org/images/entities/char_2009.gif) :
:![[thin space (1/6-em)]](https://www.rsc.org/images/entities/char_2009.gif) 1, 1
1, 1![[thin space (1/6-em)]](https://www.rsc.org/images/entities/char_2009.gif) :
:![[thin space (1/6-em)]](https://www.rsc.org/images/entities/char_2009.gif) 3, 1
3, 1![[thin space (1/6-em)]](https://www.rsc.org/images/entities/char_2009.gif) :
:![[thin space (1/6-em)]](https://www.rsc.org/images/entities/char_2009.gif) 5, 1
5, 1![[thin space (1/6-em)]](https://www.rsc.org/images/entities/char_2009.gif) :
:![[thin space (1/6-em)]](https://www.rsc.org/images/entities/char_2009.gif) 7, pure MoS2 and rGO were prepared in the same manner.
7, pure MoS2 and rGO were prepared in the same manner.
2.2.2 Characterization of MoS2/rGO. MoS2/rGO was observed with a Merlin field emission scanning electron microscope (SEM) equipped with energy dispersive spectroscopy (EDS) and a FEI Tecnai G2 F20 transmission electron microscope (TEM) with high-resolution transmission electron microscopy (HRTEM). XRD patterns of MoS2/rGO were collected using a D8-Advance X-ray diffractometer based on Cu Kα radiation. The Brunauer–Emmett–Teller (BET) surface area of MoS2/rGO was determined using a Quantachrome Autosorb-IQ-MP low temperature nitrogen sorption method. The XPS spectrum was recorded on the Thermo Fisher Scientific ESCALAB 250Xi spectrometer with monochromatic Al Kα radiation.
2.2.3 Cr(VI) adsorption experiments. For batch adsorption experiments of Cr(VI), a stock solution of Cr(VI) at concentration of 1000 mg L−1 was prepared. All adsorption experiments were conducted at room temperature (25 ± 2 °C) at an agitation speed of 180 rpm and the normal pH of Cr(VI) solutions (4.6 ± 0.1) unless otherwise noted. Adsorption kinetics were studied by adding 0.01 g of adsorbents into 25 mL of 50 mg L−1 Cr(VI) solutions and stirring for specific time intervals. The effect of the adsorbent dose was analyzed by a dosing range from 0.005 g to 0.025 g. To observe the pH effect on the adsorption, Cr(VI) solutions with varying pH values from 2.0 (±0.1) to 10.0 (±0.1) were prepared. The effect of the initial Cr(VI) concentration was investigated from 10 mg L−1 to 100 mg L−1. Adsorption isotherm studies were performed at different temperatures from 25 °C to 45 °C. All experiments were repeated three times. After shaking, the samples were filtered with a 0.45 μm filter membrane. The filtrate was used for the remaining Cr(VI) determination, and the Cr(VI) removal and adsorption capacity were determined by triplicate measurements, with the average data reported.
2.2.4 Determination of Cr(VI) concentration. The concentration of Cr(VI) was analyzed by a UV-Vis spectrophotometer (UV-1750, SHIMADZU, Japan), which was measured by the purple complex of Cr(VI) with 1,5-diphenylcarbazide at 540 nm.2 The details of the analytical method are presented in ESI.†
3. Results and discussions
3.1 Characterization of materials
The morphology of MoS2/rGO was observed by SEM and is shown in Fig. 1. The SEM image of MoS2/rGO clearly illustrates a 3D sphere-like architecture, which is quite different from the reported flake-like structure of graphene. The interaction of MoS2 and rGO resulted in the overlapping or coalescence of graphene layers being more difficult; thus the 3D sphere-like architecture increased the specific surface area and aided the adsorption. Due to the superior strength of graphene, the 3D sphere-like architecture was also helpful for the stability of MoS2/rGO.13
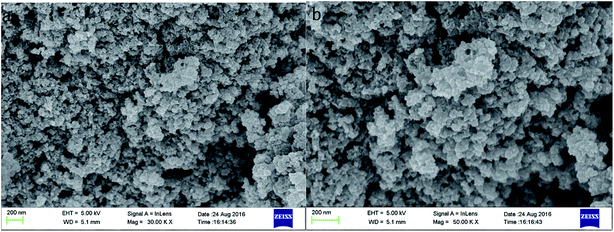 |
| | Fig. 1 The SEM image of MoS2/rGO. | |
The TEM image of MoS2/rGO is shown in Fig. 2. From Fig. 2, it is clear that the MoS2 (black stripes) layers are homogeneously embedded in the graphene layers. The thickness of pure MoS2 is reported to be tens of layers,14 while the thickness of MoS2 embedded in graphene layers, shown in the HRTEM image, is smaller than pure MoS2 and about 4–5 layers. The difference in thickness reveals that during the self-assembled process of MoS2/rGO, MoS2 is grown in situ on the surface of the graphene layers, and the combination of MoS2 and graphene greatly inhibits the restacking of MoS2 and graphene layers.14
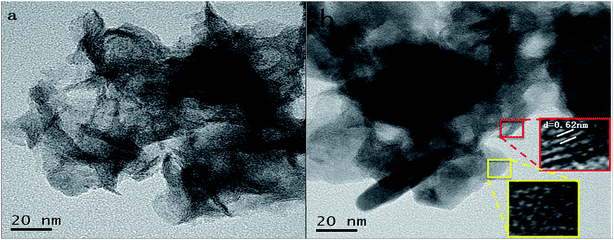 |
| | Fig. 2 The TEM and HRTEM images of MoS2/rGO. | |
Fig. 3 shows the XRD patterns of rGO, MoS2 and MoS2/rGO. The XRD pattern of rGO exhibits a clear diffraction peak at 2θ = 24.8°, corresponding to the characteristic of graphene. At about 2θ = 12.3°, there is a diffraction peak that may be characteristic of graphene oxide because of the incomplete elimination of oxygen-containing functional groups during the synthesis of MoS2/rGO. The XRD patterns of MoS2 and MoS2/rGO show a similar trend because of the big mass ratio of MoS2 in the composites. The diffraction peak of MoS2/rGO shows very weak, at (100), (110) diffraction line is slightly stronger than the diffraction peak of MoS2, indicating the poor crystallinity of MoS2 and MoS2/rGO.
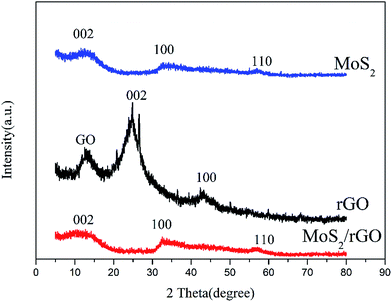 |
| | Fig. 3 The XRD patterns of MoS2, rGO, and MoS2/rGO. | |
The rGO, MoS2 and MoS2/rGO were investigated by the BET method to calculate the specific surface area. The nitrogen adsorption/desorption isotherms are shown in Fig. 4. The specific surface area of rGO, MoS2 and MoS2/rGO is 57.20 m2 g−1, 1.57 m2 g−1 and 81.34 m2 g−1, respectively. The specific surface area of MoS2/rGO is higher than those of both rGO and MoS2, meaning the combination of MoS2 and rGO can greatly reduce the restacking of MoS2 layers and graphene layers.
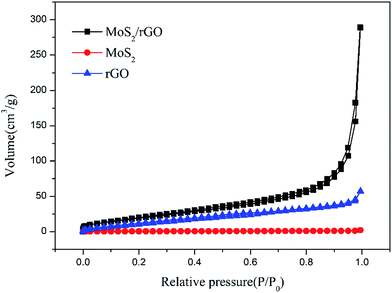 |
| | Fig. 4 The nitrogen adsorption/desorption isotherms of rGO, MoS2 and MoS2/rGO. | |
To further understand the chemical composition and valence states of MoS2/rGO, the XPS spectrum was recorded and shown in Fig. 5. The C 1s peak associated with the binding energy of 284.8 eV represents the sp2 carbon of graphene (oxide). Two peaks at 229.2 eV and 232.4 eV can be assigned to Mo 3d5/2 and Mo 3d3/2, respectively. The S 2p and S 2s can be fitted with the peaks at 162.3 eV, 163.2 eV and 227.5 eV.
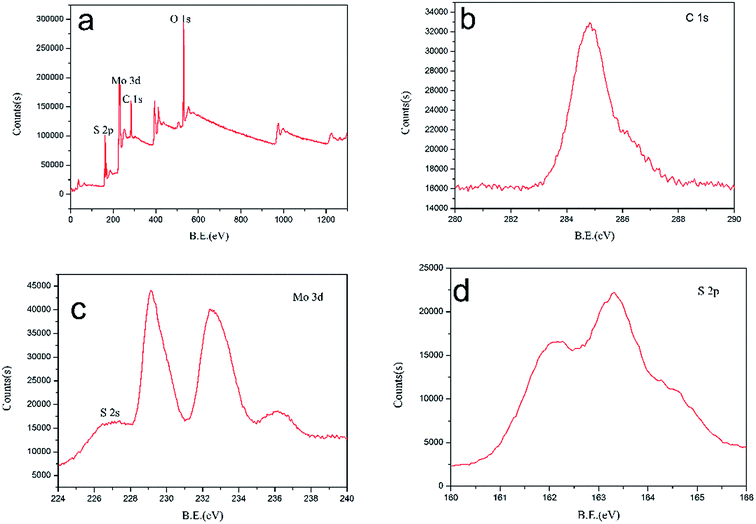 |
| | Fig. 5 (a) XPS survey spectrum of MoS2/rGO and high resolution scans for (b) the C 1s, (c) Mo 3d, and (d) S 2p. | |
3.2 Effect of contact time
Fig. 6 shows the effect of contact time on the adsorption of Cr(VI) onto MoS2/rGO. The adsorption of different initial concentrations of Cr(VI) solutions showed a similar trend. The adsorption capacity at an initial concentration of 50 mg L−1 was better than 30 mg L−1 and 70 mg L−1. In the first 15 min, the adsorption rapidly increased, which was due to the abundant, available vacant sites of MoS2/rGO. With further increases in time, the rate of adsorption slowed and reached equilibrium within 180 min. Moreover, the rapid adsorption process is an important feature of physical adsorption, which revealed that the adsorption of Cr(VI) onto MoS2/rGO is a combination of physical adsorption and chemical adsorption. The optimum contact time was 180 min according to the above results.
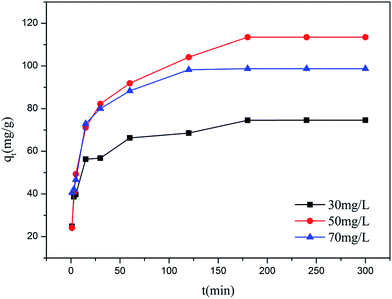 |
| | Fig. 6 Effect of contact time on the adsorption of Cr(VI) by MoS2/rGO. | |
3.3 Effect of the adsorbent dose
The relation between the adsorbent dose of MoS2/rGO and removal efficiency is shown in Fig. 7. With an increase in the MoS2/rGO dosage, the efficiency of the removal of Cr(VI) increased. In addition, the adsorption capacity decreased. It is clear that the efficiency of the removal of Cr(VI) sharply increased from 59.55% to 98.14%, when the adsorbent dose increased from 0.20 g L−1 to 0.40 g L−1. Correspondingly, the adsorption capacity decreased from 148.88 mg g−1 to 122.67 mg g−1. This might be due an increased dose that led to an enhancement in the surface and the available active sites for adsorption.15 Based on these results, 0.40 g L−1 was selected as an optimum adsorbent dose.
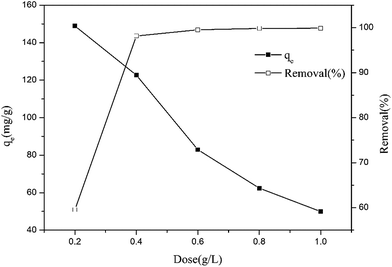 |
| | Fig. 7 Effect of adsorption dose on adsorption capacity and removal of Cr(VI) by MoS2/rGO. | |
3.4 Effect of pH
Fig. 8 shows the effect of pH on the adsorption of Cr(VI) by MoS2/rGO. The pH of the solution was an important factor in the adsorption. It indicates that the change between the initial pH of the solution and adsorption capacity of Cr(VI) tends to be similar. At a pH range of 2.0–10.0, MoS2/rGO (mass ratio of 1![[thin space (1/6-em)]](https://www.rsc.org/images/entities/char_2009.gif) :
:![[thin space (1/6-em)]](https://www.rsc.org/images/entities/char_2009.gif) 9) had a much higher adsorption capacity (>87.59 mg g−1) than the others in this study. MoS2/rGO (mass ratio of 1
9) had a much higher adsorption capacity (>87.59 mg g−1) than the others in this study. MoS2/rGO (mass ratio of 1![[thin space (1/6-em)]](https://www.rsc.org/images/entities/char_2009.gif) :
:![[thin space (1/6-em)]](https://www.rsc.org/images/entities/char_2009.gif) 9) showed a great adsorption capacity not only at pH 2.0 (124.67 mg g−1) but also at pH 4.6 (118.31 mg g−1). The adsorption capacity decreased with the value of pH increasing until the pH value was 10. Cr(VI) exists in various different ionic forms in solutions. Chromate (CrO42−), dichromate (Cr2O72−) and hydrogen chromate (HCrO4−) are the main ionic forms of Cr(VI) in solutions. At a pH lower than 6.8, HCrO4− is the major species, while above 6.8, only CrO42− is stable. Under acidic conditions, the adsorption is facilitated by electrostatic attraction between the sorbents and sorbates, which might due to the protonation on the sorbents surface. In fact, much chromium-containing water is acidic, such as electroplating wastewater at pH 4–6 and acid pickling wastewater at a pH lower than 1.5. Most of the reported adsorbents of Cr(VI) show a high adsorption capacity only under strong acidic conditions, such as pH 2.0. In this case, pH 4.6 was selected for the subsequent experiments unless otherwise noted. This was done to avoid adjusting the pH value of Cr(VI) solutions to reduce experimental error and to show the great potential of MoS2/rGO for removing Cr(VI) compared to the other reported adsorbents at pH 4.6.
9) showed a great adsorption capacity not only at pH 2.0 (124.67 mg g−1) but also at pH 4.6 (118.31 mg g−1). The adsorption capacity decreased with the value of pH increasing until the pH value was 10. Cr(VI) exists in various different ionic forms in solutions. Chromate (CrO42−), dichromate (Cr2O72−) and hydrogen chromate (HCrO4−) are the main ionic forms of Cr(VI) in solutions. At a pH lower than 6.8, HCrO4− is the major species, while above 6.8, only CrO42− is stable. Under acidic conditions, the adsorption is facilitated by electrostatic attraction between the sorbents and sorbates, which might due to the protonation on the sorbents surface. In fact, much chromium-containing water is acidic, such as electroplating wastewater at pH 4–6 and acid pickling wastewater at a pH lower than 1.5. Most of the reported adsorbents of Cr(VI) show a high adsorption capacity only under strong acidic conditions, such as pH 2.0. In this case, pH 4.6 was selected for the subsequent experiments unless otherwise noted. This was done to avoid adjusting the pH value of Cr(VI) solutions to reduce experimental error and to show the great potential of MoS2/rGO for removing Cr(VI) compared to the other reported adsorbents at pH 4.6.
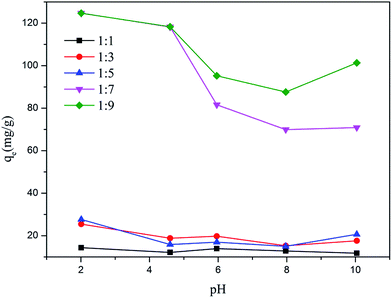 |
| | Fig. 8 Effect of pH on the adsorption of Cr(VI) by MoS2/rGO. | |
3.5 Effect of initial concentration
The effect of the initial concentration on Cr(VI) adsorption by rGO, MoS2 and MoS2/rGO is shown in Fig. 9. It shows that the adsorption capacity of MoS2/rGO is quite higher than the adsorption capacity of rGO and MoS2, signifying that the combination of rGO and MoS2 not only exhibited the properties of constituents, but also produced new properties through the interaction.
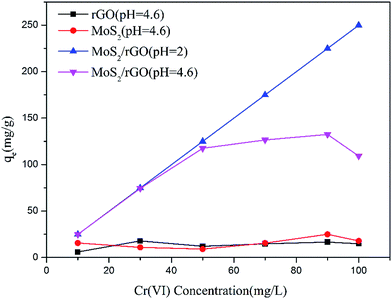 |
| | Fig. 9 Effect of initial concentration on the adsorption of Cr(VI) by rGO, MoS2 and MoS2/rGO. | |
3.6 Adsorption kinetics study
The pseudo-first order16 model and the pseudo-second order17 model were employed to investigate the controlling mechanism. The linearized forms of the adsorption kinetic models are given in eqn (1) and (2), respectively:| |
 | (1) |
| |
 | (2) |
where qe is the amount adsorbed at equilibrium (mg g−1), qt is the amount adsorbed at time t (mg g−1), and k1 and k2 are the pseudo-first order and pseudo-second order, respectively.
Fig. 10a and b show the linearized plots of eqn (1) and (2), respectively. The fitting results of kinetic models are shown in Table 1. The results suggest that the calculated qe values by a pseudo-second order model are close to the experimental values and the correlation coefficient (r2 ≈ 0.9990–0.9996). Meanwhile, the calculated qe values by a pseudo-first order model greatly differ from the experimental values, and the correlation coefficient (r2 ≈ 0.6363–0.9455), which indicates that the Cr(VI) adsorption onto MoS2/rGO fits well with the pseudo-second order model than the pseudo-first order model.
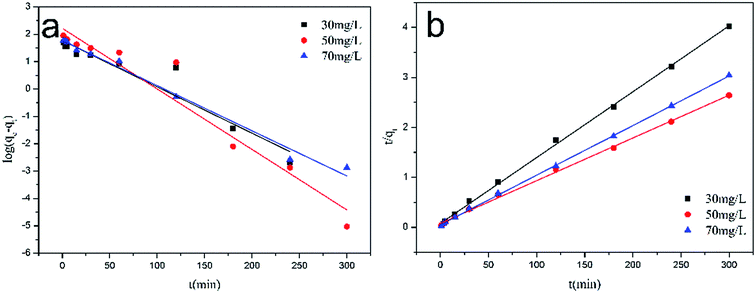 |
| | Fig. 10 (a) The pseudo-first-order, (b) the pseudo-second-order kinetics model for the adsorption of Cr(VI) by MoS2/rGO. | |
Table 1 Kinetic parameters for the adsorption of Cr(VI) by MoS2/rGO
| Kinetic models |
Parameters |
| qe,exp (mg g−1) |
qe,cal (mg g−1) |
k1 (min−1) |
r2 |
| Pseudo-first-order model |
30 mg L−1 |
74.59 |
31.83 |
2.46 × 10⁻² |
0.6363 |
| 50 mg L−1 |
113.49 |
164.38 |
5.09 × 10⁻² |
0.9461 |
| 70 mg L−1 |
98.74 |
63.92 |
3.59 × 10⁻² |
0.9455 |
| Kinetic models |
Parameters |
| qe,exp (mg g−1) |
qe,cal (mg g−1) |
k2 [g mg−1 min−1] |
r2 |
| Pseudo-second-order model |
30 mg L−1 |
74.59 |
75.87 |
0.22 × 10⁻² |
0.9990 |
| 50 mg L−1 |
113.49 |
116.82 |
0.09 × 10⁻² |
0.9985 |
| 70 mg L−1 |
98.74 |
100.70 |
0.20 × 10⁻² |
0.9996 |
3.7 Adsorption isotherms study
The Langmuir18 and Freundlich19 isotherm models were employed to understand the adsorption mechanism. The Langmuir isotherm assumes a homogeneous adsorption surface with all the adsorption sites having an equal adsorbate affinity. The equation of the Langmuir isotherm is given as follows:| |
 | (3) |
where qm is the maximum adsorption capacity (mg g−1), and kL is the Langmuir constant related to the free energy of adsorption. In addition, a dimensionless separation constant RL can be expressed as follows:| |
 | (4) |
where the value of RL indicates the type of isotherm that is unfavorable (RL > 1), linear (RL = 1), favorable (0 < RL < 1), or irreversible (RL = 0).
The Freundlich isotherm assumes a heterogeneous adsorption surface during the adsorption process. The Freundlich isotherm model is represented by the following equation:
| |
 | (5) |
where 1/
n and
kF are the constants related to the intensity of adsorption and capacity of adsorption, respectively.
Fig. 11a and b show the linearized plots of the Langmuir and Freundlich isotherm models, and the values of the parameters are listed in Table 2. Based on the high value of the correlation coefficient by the Langmuir isotherm model (r2 ≈ 0.9998–0.9601) compared to the Freundlich isotherm model (r2 ≈ 0.1247–0.8377), the Langmuir isotherm model gave a better description of Cr(VI) adsorption by MoS2/rGO. The maximum capacity at pH 2.0 and pH 4.6 at 25 °C were calculated to be 268.82 mg g−1 and 192.63 mg g−1, respectively. The value of RL at three different temperatures was in the range of 0.0011–0.0234 and revealed that the Cr(VI) adsorption process was favorable. The comparison of the maximum adsorption capacity of MoS2/rGO with various reported adsorbents in the Langmuir isotherm is shown in Table 3. The dose of MoS2/rGO was only 0.4 g L−1, which is much less than some materials, such as reduced graphene oxide–montmorillonite3 (6.0 g L−1) and polypyrrole/F3O4 magnetic nanocomposite5 (2.0 g L−1), among others.6,20–22 Based on the results, the MoS2/rGO had a much higher maximum adsorption capacity than others, which can be considered as a promising material for the removal of Cr(VI) in wastewater.
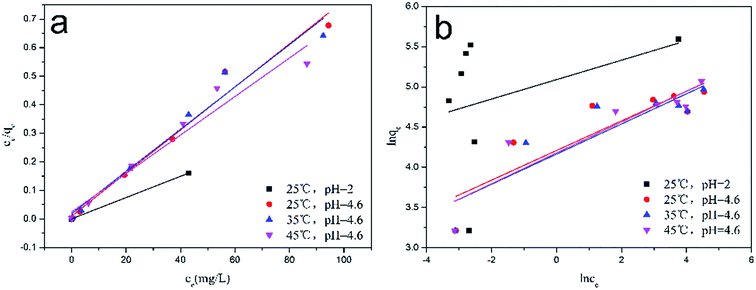 |
| | Fig. 11 (a) The Langmuir, and (b) the Freundlich isotherm models for the adsorption of Cr(VI) by MoS2/rGO. | |
Table 2 Isotherm parameters for the adsorption of Cr(VI) by MoS2/rGO
| Temp (°C) |
pH |
Langmuir |
Freundlich |
| qm (mg g−1) |
kL (L mg−1) |
r2 |
RL |
1/n |
kF (mg g−1) |
r2 |
| 25 |
2.0 |
268.82 |
6.2000 |
0.9998 |
0.0011 |
0.1209 |
162.4061 |
0.1247 |
| 4.6 |
192.63 |
0.7414 |
0.9799 |
0.0089 |
0.1842 |
67.2805 |
0.7730 |
| 35 |
4.6 |
134.95 |
0.4074 |
0.9720 |
0.0161 |
0.1874 |
64.3599 |
0.8030 |
| 45 |
4.6 |
148.15 |
0.2787 |
0.9601 |
0.0234 |
0.1917 |
65.3149 |
0.8377 |
Table 3 Comparison of adsorption capacity for Cr(VI) on different adsorbents at 25 °C
| Adsorbent |
Dose (g L−1) |
pH |
qmax (mg g−1) |
Reference |
| MoS2/rGO |
0.4 |
2.0 |
268.82 |
This study |
| MoS2/rGO |
0.4 |
4.6 |
192.63 |
This study |
| Reduced graphene oxide–montmorillonite |
6.0 |
2.0 |
12.86 |
3 |
| Polypyrrole/F3O4 magnetic nanocomposite |
2.0 |
2.0 |
169.4–243.9 |
5 |
| Graphene modified with cetyltrimethylammonium bromide |
4.0 |
2.0 |
21.57 |
6 |
| Graphene oxide/Fe3O4/SO3H nanohybrid |
0.5 |
3.0 |
222.22 |
20 |
| Magnetic ionic liquid/chitosan/graphene oxide composite |
1.0 |
3.0 |
145.35 |
21 |
| β-Cyclodextrin–chitosan modified biochars |
2.0 |
2.0 |
206 |
22 |
3.8 Thermodynamic study
To investigate the thermodynamic study of MoS2/rGO, the Gibbs free energy (ΔG0), enthalpy (ΔH0), and entropy (ΔS0)23 were determined at temperatures from 298 K to 318 K, as shown in Table 4. At all three temperatures, the negative value of ΔG0 indicated that the Cr(VI) adsorption process by MoS2/rGO was spontaneous. The negative ΔH0 value suggested that the removal of Cr(VI) was an exothermic reaction.24
Table 4 Thermodynamic parameters for the adsorption of Cr(VI) by MoS2/rGO
| T (K) |
ΔG0 (kJ mol−1) |
ΔH0 (kJ mol−1) |
ΔS0 (J mol−1 K−1) |
| 298 |
−7.0085 |
−30.7309 |
−79.6053 |
| 308 |
−6.2124 |
| 318 |
−5.4164 |
3.9 Adsorption mechanism
The EDS pattern (Fig. 12a) of MoS2/rGO after Cr(VI) adsorption at pH 4.6 revealed the existence of C, O, Mo, S and Cr. Furthermore, it was noted that the peaks of Mo and S were overlapped. To further understand the adsorption mechanism of MoS2/rGO, Cr ions loaded on the surface of MoS2/rGO after Cr(VI) adsorption at pH 4.6 were employed to XPS. The XPS spectra are shown in Fig. 12b. There are two obvious energy bands at about 577.5 eV and 587.5 eV, which correspond to the orbital binding energies of Cr(2p3/2) and Cr(2p1/2), respectively. This indicated that the Cr ions exist as Cr(VI) and Cr(III) on the MoS2/rGO surface.5 The Cr(VI) on the adsorbents surface, due to the sorption of Cr(VI), may be due to the specific surface area of MoS2/rGO and the electrostatic attraction between adsorbents and Cr(VI) ions. The Cr(III) on the adsorbents surface suggests that some fraction of adsorbed Cr(VI) on the MoS2/rGO surface is reduced to Cr(III), and the Cr(III) species can be precipitated on the surface of MoS2/rGO due to the co-electron cloud, which formed by the electrons of the S atom layer and its adjacent carbon layer.18 The reduction was accompanied by the consumption of protons (eqn (6)).| | |
HCrO4− + 7H+ + 3e− → Cr3+ + 4H2O
| (6) |
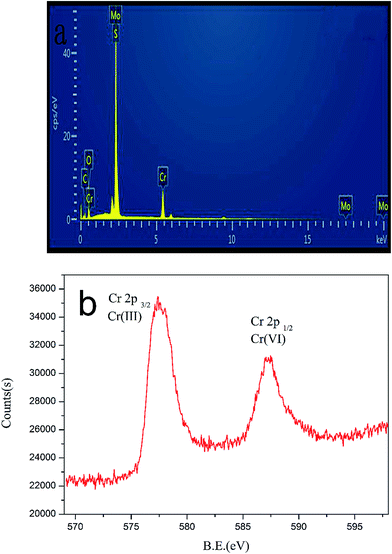 |
| | Fig. 12 (a) EDS pattern and (b) XPS spectra of the MoS2/rGO after Cr(VI) adsorption at pH 4.6. | |
4. Conclusions
In this study, MoS2/rGO was synthesized via a facile, one-step solvothermal process and successfully showed new properties for Cr(VI) removal. It had an excellent adsorption capacity from pH 2.0 to 10.0 compared to some of the reported adsorbents. The adsorption kinetics fitted better to a pseudo-second-order model than a pseudo-first-order model. The Langmuir isotherm was found to describe the experimental data better than the Freundlich isotherm. The maximum adsorption capacity of MoS2/rGO at pH 2.0 and at pH 4.6 was 268.82 mg g−1 and 192.63 mg g−1, respectively. A thermodynamic study suggested that Cr(VI) adsorption was spontaneous and exothermic. The abovementioned results revealed that MoS2/rGO can be an effective adsorbent for the removal of Cr(VI).
Acknowledgements
Financial support from the Key Natural Science Foundation of Guangdong Province (No. 2015A030311002) is gratefully acknowledged.
References
- T. Karthikeyan, S. Rajgopal and L. Miranda, J. Hazard. Mater., 2005, 124, 192 CrossRef CAS PubMed.
- B. Hu and H. Luo, Appl. Surf. Sci., 2010, 257, 769 CrossRef CAS.
- Z. Zhang, H. Luo, X. Jiang, Z. Jiang and C. Yang, RSC Adv., 2015, 5, 47408 RSC.
- Y. Zhao, H. Shen, S. Pan, M. Hu and Q. Xia, J. Mater. Sci., 2010, 45, 5291 CrossRef CAS.
- M. Bhaumik, A. Maity, V. V. Srinivasu and M. S. Onyango, J. Hazard. Mater., 2011, 190, 381 CrossRef CAS PubMed.
- Y. Wu, H. Luo, H. Wang, C. Wang, J. Zhang and Z. Zhang, J. Colloid Interface Sci., 2013, 394, 183 CrossRef CAS PubMed.
- J. Chen, N. Kuriyama, H. Yuan, H. T. Takeshita and T. Sakai, J. Am. Chem. Soc., 2001, 47, 11813 CrossRef.
- S. J. Ding, J. S. Chen and X. W. Lou, Chem.–Eur. J., 2011, 17, 13142 CrossRef CAS PubMed.
- M. Sun, J. Adjaye and A. E. Nelson, Appl. Catal., A, 2004, 263, 131 CrossRef CAS.
- H. S. S. Ramakrishna Matte, A. Gomathi, A. K. Manna, D. J. Late, R. Datta, S. K. Pati and C. N. R. Rao, Angew. Chem., 2010, 122, 4153 CrossRef.
- J. M. Soon and K. P. Loh, Electrochem. Solid-State Lett., 2007, 10, A250 CrossRef CAS.
- W. Zhou, K. Zhou, D. Hou, X. Liu, G. Li, Y. Sang, H. Liu, L. Li and S. Chen, ACS Appl. Mater. Interfaces, 2014, 6, 21534 CAS.
- K. Huang, L. Wang, Y. Liu, Y. Liu, H. Wang, T. Gan and L. Wang, Int. J. Hydrogen Energy, 2013, 38, 14027 CrossRef CAS.
- K. Chang and W. Chen, Chem. Commun., 2011, 47, 4252 RSC.
- E. N. El Qada, S. J. Allen and G. M. Walker, Ind. Eng. Chem. Res., 2006, 45, 6044 CrossRef CAS.
- M. Doğan, M. Alkan, Ö. Demirbaş, Y. Özdemir and C. Özmetin, Chem. Eng. J., 2006, 124, 89 CrossRef.
- Y. S. Ho and C. C. Chiang, Adsorption, 2001, 7, 139 CrossRef CAS.
- I. Langmuir, J. Am. Chem. Soc., 1918, 40, 1361 CrossRef CAS.
- H. M. F. Freundlich, J. Phys. Chem., 1906, 57, 385 CAS.
- A. Alizadeh, G. Abdi, M. M. Khodaei, M. Ashokkumarc and J. Amiriand, RSC Adv., 2017, 7, 14876 RSC.
- L. Li, C. Luo, X. Li, H. Duan and X. Wang, Int. J. Biol. Macromol., 2014, 66, 172 CrossRef CAS PubMed.
- X. Huang, Y. Liu, S. Liu, X. Tan, Y. Ding, G. Zeng, Y. Zhou, M. Zhang, S. Wang and B. Zheng, RSC Adv., 2016, 6, 94 RSC.
- L. Zhang, H. Luo, P. Liu, W. Fang and J. Geng, Int. J. Biol. Macromol., 2016, 87, 586 CrossRef CAS PubMed.
- N. Nasuha and B. H. Hameed, Chem. Eng. J., 2011, 166, 783 CrossRef CAS.
Footnote |
| † Electronic supplementary information (ESI) available. See DOI: 10.1039/c7ra03531d |
|
| This journal is © The Royal Society of Chemistry 2017 |
Click here to see how this site uses Cookies. View our privacy policy here.  Open Access Article
 *abc,
Yuwei Yinabc and
Weijia Zhou
 a
a
![[thin space (1/6-em)]](https://www.rsc.org/images/entities/char_2009.gif) :
:![[thin space (1/6-em)]](https://www.rsc.org/images/entities/char_2009.gif) 9, ammonium molybdate and thioacetamide at a mass ratio of 1
9, ammonium molybdate and thioacetamide at a mass ratio of 1![[thin space (1/6-em)]](https://www.rsc.org/images/entities/char_2009.gif) :
:![[thin space (1/6-em)]](https://www.rsc.org/images/entities/char_2009.gif) 2, and 1080 mg of ammonium molybdate were dissolved in 40 mL of a 3 mg mL−1 graphene oxide aqueous dispersion. After ultrasonication and stirring for 1 h, aqueous NaOH was added until the pH value changed to 6.5. Furthermore, 2160 mg thioacetamide was added and ultrasonicated to form a homogeneous solution; the solution was transferred into a 50 mL Teflon-lined stainless steel autoclave, sealed tightly, and heated at 200 °C for 24 h in an electric oven. For comparison, mass ratios of 1
2, and 1080 mg of ammonium molybdate were dissolved in 40 mL of a 3 mg mL−1 graphene oxide aqueous dispersion. After ultrasonication and stirring for 1 h, aqueous NaOH was added until the pH value changed to 6.5. Furthermore, 2160 mg thioacetamide was added and ultrasonicated to form a homogeneous solution; the solution was transferred into a 50 mL Teflon-lined stainless steel autoclave, sealed tightly, and heated at 200 °C for 24 h in an electric oven. For comparison, mass ratios of 1![[thin space (1/6-em)]](https://www.rsc.org/images/entities/char_2009.gif) :
:![[thin space (1/6-em)]](https://www.rsc.org/images/entities/char_2009.gif) 1, 1
1, 1![[thin space (1/6-em)]](https://www.rsc.org/images/entities/char_2009.gif) :
:![[thin space (1/6-em)]](https://www.rsc.org/images/entities/char_2009.gif) 3, 1
3, 1![[thin space (1/6-em)]](https://www.rsc.org/images/entities/char_2009.gif) :
:![[thin space (1/6-em)]](https://www.rsc.org/images/entities/char_2009.gif) 5, 1
5, 1![[thin space (1/6-em)]](https://www.rsc.org/images/entities/char_2009.gif) :
:![[thin space (1/6-em)]](https://www.rsc.org/images/entities/char_2009.gif) 7, pure MoS2 and rGO were prepared in the same manner.
7, pure MoS2 and rGO were prepared in the same manner.
![[thin space (1/6-em)]](https://www.rsc.org/images/entities/char_2009.gif) :
:![[thin space (1/6-em)]](https://www.rsc.org/images/entities/char_2009.gif) 9) had a much higher adsorption capacity (>87.59 mg g−1) than the others in this study. MoS2/rGO (mass ratio of 1
9) had a much higher adsorption capacity (>87.59 mg g−1) than the others in this study. MoS2/rGO (mass ratio of 1![[thin space (1/6-em)]](https://www.rsc.org/images/entities/char_2009.gif) :
:![[thin space (1/6-em)]](https://www.rsc.org/images/entities/char_2009.gif) 9) showed a great adsorption capacity not only at pH 2.0 (124.67 mg g−1) but also at pH 4.6 (118.31 mg g−1). The adsorption capacity decreased with the value of pH increasing until the pH value was 10. Cr(VI) exists in various different ionic forms in solutions. Chromate (CrO42−), dichromate (Cr2O72−) and hydrogen chromate (HCrO4−) are the main ionic forms of Cr(VI) in solutions. At a pH lower than 6.8, HCrO4− is the major species, while above 6.8, only CrO42− is stable. Under acidic conditions, the adsorption is facilitated by electrostatic attraction between the sorbents and sorbates, which might due to the protonation on the sorbents surface. In fact, much chromium-containing water is acidic, such as electroplating wastewater at pH 4–6 and acid pickling wastewater at a pH lower than 1.5. Most of the reported adsorbents of Cr(VI) show a high adsorption capacity only under strong acidic conditions, such as pH 2.0. In this case, pH 4.6 was selected for the subsequent experiments unless otherwise noted. This was done to avoid adjusting the pH value of Cr(VI) solutions to reduce experimental error and to show the great potential of MoS2/rGO for removing Cr(VI) compared to the other reported adsorbents at pH 4.6.
9) showed a great adsorption capacity not only at pH 2.0 (124.67 mg g−1) but also at pH 4.6 (118.31 mg g−1). The adsorption capacity decreased with the value of pH increasing until the pH value was 10. Cr(VI) exists in various different ionic forms in solutions. Chromate (CrO42−), dichromate (Cr2O72−) and hydrogen chromate (HCrO4−) are the main ionic forms of Cr(VI) in solutions. At a pH lower than 6.8, HCrO4− is the major species, while above 6.8, only CrO42− is stable. Under acidic conditions, the adsorption is facilitated by electrostatic attraction between the sorbents and sorbates, which might due to the protonation on the sorbents surface. In fact, much chromium-containing water is acidic, such as electroplating wastewater at pH 4–6 and acid pickling wastewater at a pH lower than 1.5. Most of the reported adsorbents of Cr(VI) show a high adsorption capacity only under strong acidic conditions, such as pH 2.0. In this case, pH 4.6 was selected for the subsequent experiments unless otherwise noted. This was done to avoid adjusting the pH value of Cr(VI) solutions to reduce experimental error and to show the great potential of MoS2/rGO for removing Cr(VI) compared to the other reported adsorbents at pH 4.6.


