
 Open Access Article
 This Open Access Article is licensed under a Creative Commons Attribution-Non Commercial 3.0 Unported Licence
Three sandwich-type zinc(II)–lanthanide(III) clusters: structures, luminescence and magnetic properties†
Xue-Qin Song *a,
Pan-Pan Liua,
Cai-yun Wanga,
Yuan-An Liua,
Wei-Sheng Liub and
Mo Zhanga
*a,
Pan-Pan Liua,
Cai-yun Wanga,
Yuan-An Liua,
Wei-Sheng Liub and
Mo Zhanga
aSchool of Chemical and Biological Engineering, Lanzhou Jiaotong University, Lanzhou, China. E-mail: songxq@mail.lzjtu.cn; Fax: +86-931-4938755; Tel: +86-931-4938755
bLanzhou University, Key Laboratory of Nonferrous Metals Chemistry and Resources Utilization of Gansu Province, State Key Laboratory of Applied Organic Chemistry, College of Chemistry and Chemical Engineering, Lanzhou, China. E-mail: liuws@lzu.edu.cn; Fax: +86-931-8915151; Tel: +86-931-8915151
First published on 26th April 2017
Abstract
Three new sandwich-type hexanuclear ZnII–LnIII clusters based on a methoxy substituted salicylamide Salen-like ligand and o-vanilline, [Zn2Ln4(HL)4(o-vanilline)2(OH)4(CH3OH)2]·2NO3·5CH3OH (Ln = Eu, Tb and Dy, H3L = 1-(2-hydroxy-4-methoxy-benzamido)-2-(2-hydroxy-3-methoxy-benzylideneamino)-ethane) were synthesised. Single-crystal structure analyses reveal that these ZnII–LnIII clusters display a hydroxyl bridged tetranuclear LnIII4 core sandwiched in an environment of two ZnII ions, four doubly deprotonated HL2− and two singly deprotonated o-vanilline. Photophysical determinations indicate that the ZnII–EuIII cluster shows mixed emissions both originating from ligands and EuIII ions, and the other two only display ligand-centered emission in visible region. The magnetic studies reveal that the ZnII–DyIII cluster displays rare ferromagnetic behavior with slow magnetic relaxation behavior at zero field.
Introduction
High-nuclearity heterometallic clusters containing ZnII–LnIII metal ions have blossomed into a promising topic of modern coordination chemistry and attracted increasing attention primarily because of their interesting magnetic and photophysical properties since the first ZnII–EuIII/SmIII heterometallic clusters were reported in 1995 by Brennan et al.1 This is attributed to: (a) magnetic behaviour that can easily be explained due to the diamagnetic character of the ZnII ion, and (b) LnIII ions are desired luminescent and magnetic species because of their characteristic 4f electronic configuration. The magnetic properties of ZnII–LnIII heterometallic compounds mainly arise from the intrinsic large spin ground state and the strong uniaxial magnetic anisotropy of some LnIII ions. It is expected that the incorporation of ZnII and LnIII ions into one coordination system may not only enhance the structural diversity, but also integrate the optical and magnetic properties of LnIII ions which can offer multifunctional properties.2–7 To our best knowledge, high-nuclearity ZnII–LnIII coordination clusters are still scarce because their design and controllable synthesis represent a formidable challenge. Consequently, only a few nanosized ZnII–LnIII clusters of varying nuclearities range from kite-like Ln3Zn,2 square-shaped Ln2Zn2,3 cyclic Zn2Ln2,4 cubane-like Ln2Zn2,5 drum-like Ln4Zn8 (ref. 6) and triangular ring-like Ln24Zn6 (ref. 7) have been reported. Due to the strong easy-axis type magnetic anisotropy and larger J(L + S) value originating from lanthanide ions,8 the magnetic exploration for LnIII-based compounds, especially for single-molecule magnets (SMMs), have stimulated a wide range of research interests. Among which, DyIII ions are the most appealing mainly because they have an inherent strong spin–orbital coupling effect and very large magnetic anisotropy of the 6H15/2 ground state. It is well known that the coordination environment, the local ligand field and the magnetic interaction strength between metal ions can have impact on SMM behavior of DyIII containing systems. Undoubtedly, further exploration of DyIII containing SMMs deserves attention not only for better SMMs but also for deciphering the relaxation dynamics and mechanisms. Although several CuII–DyIII clusters displaying ferromagnetic behavior with slow magnetization relaxation systems have been reported,9 it is rare that ferromagnetic interaction with slow magnetic relaxation exists in ZnII–DyIII heterometallic clusters.Recently, we reported a nitrate-bridged ZnII6DyIII6 dodecanuclear heterometallic cluster of Salen-like salicylamide ligand, 1-(2-hydroxy-benzamido)-2-(2-hydroxy-benzylideneamino)-ethane, which represents an unusual example of ZnII–DyIII cluster that exhibits ferromagnetic SMM behavior.10 However, the blocking temperature is lower than the temperature limit of the magnetometer even an external field of 2 kOe was applied. For the sake of increasing energy barrier and therefore to improve the SMM properties of ZnII–DyIII clusters of this kind of ligands, a new methoxy substituted Salen-like salicylamide ligand, 1-(2-hydroxy-4-methoxy-benzamido)-2-(2-hydroxy-3-methoxy-benzylideneamino)-ethane (H3L, Scheme 1) was synthesised. The basis of the strategy presented herein, relies on the use of a new multidendate Salen-like salicylamide ligand as well as o-vanilline, which are elaborately selected to compartmentalize LnIII ions through oxygen based coordination pockets free of nitrate coordination. As a result, we succeeded in obtaining three heterometallic hexanuclear clusters, [Zn2Ln4(HL)4(o-vanilline)2(OH)4(CH3OH)2]·2NO3·5CH3OH (Ln = Eu, Tb and Dy). The photophysical properties of compounds ZnII2EuIII4, ZnII2TbIII4 and ZnII2DyIII4 as well as the magnetic properties of ZnII2DyIII4 have been explored and the results indicate ZnII2EuIII4 shows mixed emissions both originating from ligands and EuIII ions, and the other two only display ligand-centered emission in visible region. Interestingly, the corresponding dysprosium containing complex ZnII2DyIII4 shows typical ferromagnetic single molecule magnetic behavior with slow zero-field relaxation. To our best knowledge, it is rather infrequent to observe ferromagnetic coupling and zero-field slow magnetic relaxation coexisted in ZnII–LnIII heterometallic clusters.
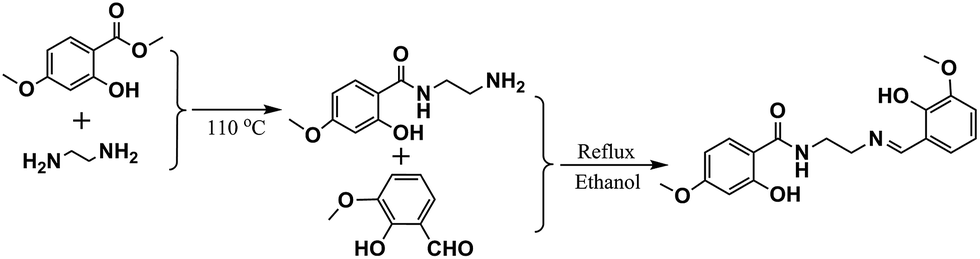 | ||
| Scheme 1 The synthesis route of the ligand H3L. | ||
Experimental section
Materials
Methyl 2-hydroxy-4-methoxybenzoate, ethane-1,2-diamine and 3-methoxy-4-hydroxybenzaldehyde were obtained from Aladain. Solvents and all other chemicals were analytical grade, available commercially, and used as received.Synthesis of the ligand
1-(2-Hydroxy-4-methoxy-benzamido)-2-(2-hydroxy-3-methoxy-benzylideneamino)-ethane (H3L) is shown in Scheme 1. N-(2-Aminoethyl)-2-hydroxy-4-methoxybenzamide was prepared according to literature using methyl 2-hydroxy-4-methoxybenzoate instead.11 10 mmol (1.52 g) o-vanilline was added to a 30 mL ethanol solution of N-(2-aminoethyl)-2-hydroxy-4-methoxybenzamide (2.10 g, 10 mmol) under stirring. The mixture was refluxed for 4 h to make a clear solution. Then the solution was rotary-evaporated to near dryness to obtain a pale-yellow solid. The yellow crystalline product obtained by ethanol recrystallization was washed with ethanol and dried in air. H3L: 2.68 g, yield 78.0%. Mp 166–167 °C. Analytical data, calc. for C18H20N2O5: C, 62.78; H, 5.85; N, 8.13; found: C, 62.81, H, 5.85, N, 8.17; IR (KBr, ν, cm−1): 3393 (w), 2938 (w), 1649 (s), 1598 (s), 1544 (m), 1467 (m), 1389 (m), 1251 (s), 1204 (m), 1160 (m), 1076 (m), 1022 (m), 958 (m), 831 (m), 736 (m). 1H NMR (CDCl3, 400 MHz) δ: 3.77 (m, 3H, CH3), 3.88 (m, 3H, CH3), 3.80 (m, 2H, CH2), 3.85 (m, 2H, CH2), 6.71 (s, 1H, ArH), 6.80 (m, 1H, ArH), 6.88 (m, 1H, ArH), 6.97 (m, 1H, ArH), 7.23 (m, 1H, ArH), 7.35 (m, 3H, CH![[double bond, length as m-dash]](https://www.rsc.org/images/entities/char_e001.gif) N), 8.41 (t, 1H, NH, J = 4 Hz), 12.21 (s, 2H, OH).
N), 8.41 (t, 1H, NH, J = 4 Hz), 12.21 (s, 2H, OH).
Preparation of complexes
Physical measurements
Elemental analyses were performed on a Perkin-Elmer 2400 Series II CHNO elemental analyzer. IR spectra were recorded in the range 400–4000 cm−1 on a Perkin-Elmer FTIR spectrometer using KBr pellets. X-ray powder diffraction (XRPD) patterns of the samples were recorded on a X-ray diffractometer (Rigaku D/Max 2200PC) with a graphite monochromator and Cu Kα radiation (λ = 1.5418 Å) at room temperature with a scan speed of 0.2 s per step and a step size of 0.02 (2θ), while the voltage and electric current were held at 40 kV and 20 mA. Thermogravimetric analysis experiments were performed using a TGA/NETZSCH STA449C instrument heated from 25–800 °C (heating rate of 10 °C min−1, nitrogen stream). Emission and excitation spectra were recorded with a Hitachi F-7000 spectrophotometer equipped with quartz cuvettes of 2.5 cm path length. The luminescence decays were recorded using a pumped dye laser (Lambda Physics model FL2002) as the excitation source. The magnetic susceptibility measurements were obtained on a Quantum Design SQUID magnetometer MPMS-XL. Measurements were performed on a polycrystalline sample of 30.09 mg for ZnII2DyIII4. Direct-current magnetic susceptibility measurements were carried out at 2–300 K for dc applied fields at 1000 Oe. Field dependence of the magnetization magnetic susceptibility measurements on the polycrystalline samples were performed with the same magnetometer. Alternating-current susceptibility measurements were carried out utilizing an oscillating ac field of 3.0 Oe and frequencies ranging from 20 to 1600 Hz under 0 and 2000 Oe dc field respectively. All crystalline samples for photoluminescence and magnetic studies were obtained from the same batch and characterized by PXRD, TG, EA and IR spectra.X-ray crystallography
Suitable pale yellow block crystals of ZnII2EuIII4 (0.24 × 0.18 × 0.14 mm3), ZnII2TbIII4 (0.32 × 0.26 × 0.14 mm3) and ZnII2DyIII4 (0.33 × 0.31 × 0.23 mm3) were coated with perfluoropolyether oil before mounting. Intensity data of all the complexes were recorded at 293(2) K employing a Bruker SMART APEX II CCD diffractometer equipped with a monochromatized Mo Kα radiation (λ = 0.71073 Å) source. No crystal decay was observed during the data collections. In all cases, absorption corrections based on multiscans using the SADABS software12 were applied. The structures were solved by direct methods13 and refined on F2 by a full-matrix least-squares procedure. SHELXL was used for both structure solutions and refinements.14 All non-hydrogen atoms were refined anisotropically. The positions of hydrogen atoms were calculated and isotropically fixed in the final refinement. The SMART and SAINT software packages15 were used for data collection and reduction respectively. Crystallographic diagrams were drawn using the DIAMOND software package.16 Also severely disordered methanol molecules in ZnII2EuIII4, ZnII2TbIII4 and ZnII2DyIII4 were removed by SQUEEZE during the structural refinements.17 For details about the squeezed material, see CIF data in ESI.† Therefore, five methanol molecules which were determined on the basis of TGA and elemental microanalysis, and the data treated with the SQUEEZE routine within PLATON were added to the molecular formula of ZnII2EuIII4, ZnII2TbIII4 and ZnII2DyIII4 respectively.Result and discussion
Synthesis and characterization
A stepwise synthetic protocol was employed to prepare the three heterometallic hexanuclear ZnII–LnIII clusters. A suspension solution of zinc containing solution was obtained from the treatment of Zn(NO3)2·2H2O with mixture of H3L, o-vanilline and triethylamine in CH3CN in a 1![[thin space (1/6-em)]](https://www.rsc.org/images/entities/char_2009.gif) :1:2 molar ratio. Addition of a solution of Ln(NO3)3·6H2O in MeOH followed by magnetic stirring gave a clear pale yellow solution from which yellow crystals suitable for crystal analysis of ZnII2EuIII4, ZnII2TbIII4 and ZnII2DyII4 were obtained during the evaporation of the solvent after three weeks. The series of compounds were soluble in methanol, DMSO and DMF. Their chemical formulas were confirmed by elemental analysis. Consistent with the successful formation of the desired compounds, the characteristic bands of carbonyl and imine of the H3L (1648 and 1598 cm−1) hypochromatic shifted about 30 and 49 cm−1, with two new bands presented at IR spectra ca. 1618 cm−1 and 1544 cm−1 respectively. The none but ν3 (1380 cm−1) of the free nitrate groups' appearance in the IR spectra of the three compounds clearly indicates the exclusive existence of free nitrate groups as further confirmed by X-ray crystallography analysis as follows.
:1:2 molar ratio. Addition of a solution of Ln(NO3)3·6H2O in MeOH followed by magnetic stirring gave a clear pale yellow solution from which yellow crystals suitable for crystal analysis of ZnII2EuIII4, ZnII2TbIII4 and ZnII2DyII4 were obtained during the evaporation of the solvent after three weeks. The series of compounds were soluble in methanol, DMSO and DMF. Their chemical formulas were confirmed by elemental analysis. Consistent with the successful formation of the desired compounds, the characteristic bands of carbonyl and imine of the H3L (1648 and 1598 cm−1) hypochromatic shifted about 30 and 49 cm−1, with two new bands presented at IR spectra ca. 1618 cm−1 and 1544 cm−1 respectively. The none but ν3 (1380 cm−1) of the free nitrate groups' appearance in the IR spectra of the three compounds clearly indicates the exclusive existence of free nitrate groups as further confirmed by X-ray crystallography analysis as follows.
Thermal gravimetric analysis (TGA) were carried out under N2 atmosphere to show their thermal stability. As shown in Fig. S1,† the three hexanuclear complexes ZnII2EuIII4, ZnII2TbIII4 and ZnII2DyIII4 showed very similar TG curves, and ZnII2DyIII4 is selected to describe as a representative. The thermal decomposition of ZnII2DyIII4 occurs in a three-step process from 25 to 800 °C. The first stage takes place in the range of 27–112 °C with a weight loss of 3.36% which was caused by the release of three crystalline methanol molecules free of hydrogen bonding. Upon further heating to about 168 °C, the two crystalline hydrogen bonded nitrates and methanol molecules were lost and the weight loss was 6.54%. Above 172 °C, the entire architecture began to collapse. PXRD experiments were also carried out for ZnII2EuIII4, ZnII2TbIII4 and ZnII2DyIII4 to verify whether the crystal structures are truly representative of the bulk materials. As we can see in Fig. S2,† the experimental patterns are in good agreement with that of the simulated ones indicating the as-synthesized samples are pure enough for spectroscopic and magnetic properties' study.
Description of structures
Signal-crystal X-ray diffraction analysis revealed that the as-synthesized ZnII–LnIII clusters are all sandwich-type hexanuclear compounds with a formula of [Zn2Ln4(HL)4(o-vanilline)2(OH)4(CH3OH)2]·2NO3·5CH3OH. For they are isostructural, here we select ZnII2DyIII4 to describe their structure features in detail. The crystal structure of ZnII2DyIII4 consists of a divalent cationic entity [Zn2Dy4(HL)4(o-vanilline)2(OH)4(CH3OH)2]2+, two uncoordinated nitrate anions for charge balance, and five crystalline methanol molecules. A cursory glance at the structure reveals that a μ3-OH−-bridged DyIII4 core is sandwiched between two layers composed of one ZnII, two HL2− and one deprotonated o-vanilline (Fig. 1a) with the asymmetric unit shows half of the molecule. As depicted in Fig. 1b, Zn1 is in an tetragonal pyramidal geometry coordinated by two phenolate oxygen atoms from two different HL2− ligands, one oxygen atom from μ3-hydroxyl group, and two imine nitrogen atoms from two different HL2− ligands. Meanwhile, two crystallographically independent DyIII ions (Dy1 and Dy2) are merely coordinated to eight oxygen atoms with Dy–O bond lengths range between 2.189 and 2.645 Å. Exact geometry analysis by SHAPE 2.1 software shows that the inner coordination sphere of eight-coordinated DyIII ions are residing in distorted biaugmented trigonal prisms with a deviation of 6.174 for Dy1 and 8.035 for Dy2 from the ideal C2v symmetry (Fig. S3†).9k,18 Owing to the two oxygen atoms from two hydroxyl groups (O11 and O15) and one phenoxo oxygen atom (O12) of singly deprotonated o-vanilline, Dy1 and Dy2 are bridged to give a trigonal pyramid [Dy2O3] unit. Furthermore, Zn1 is appended at Dy2 site with two oxygen bridge (O4 and O15) giving a Zn⋯Dy distance of 3.609 (3) Å. Noticeably, the oxygen atoms both from two hydroxyl groups (O11) and four phenoxo oxygen atom of doubly deprotonated HL2− anion (O7) and singly deprotonated o-vanilline (O12) further bridged the crystallographically Dy1 and Dy2 forming two plane-sharing cubic units [Dy4O6] short of one vertex (Fig. 1c). The Dy⋯Dy distances of the four precisely coplanar DyIII ions are 3.567(7) Å and 3.889(5) Å. Such tetranuclear subunits with four μ3-OH− displaced above and below the Dy4 plane by 0.869(2) Å and 0.490(4) Å can be viewed as a parallelogram and the shortest edge, Dy1⋯Dy2A, is that which comprises three oxygen bridges. Noticeably, this structural characteristic is quite different from reported OH− bridged Dy4 clusters.19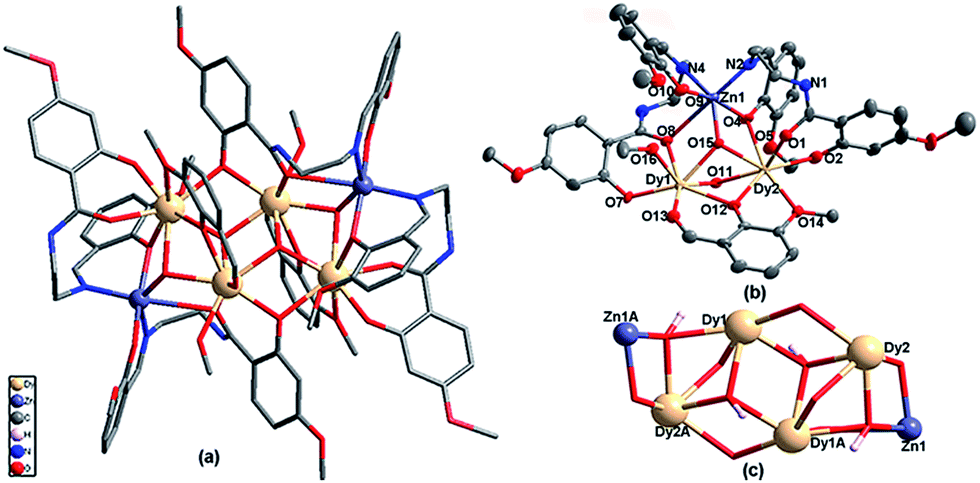 | ||
| Fig. 1 (a) Structure of the cation [Zn2Dy4(HL)4(o-vanilline)2(OH)4(CH3OH)2]2+ in ZnII2DyIII4 (b) asymmetric unit with atomic labels in ZnII2DyIII4 (H atoms as well as crystalline nitrate anion and methanol molecules are omitted for clarity); (c) the phenoxy/hydroxo-bridged metal framework [Zn2Dy4O8] in ZnII2DyIII4. | ||
Luminescent properties
Chromogenic ZnII components have been used as sensitizers for lanthanide luminescence following ligand → f and d → f energy-transfers.20 The photophysical properties of H3L, o-vanilline, ZnII2EuIII4, ZnII2TbIII4 and ZnII2DyIII4 in solid state were studied and their emission spectra is shown in Fig. 2.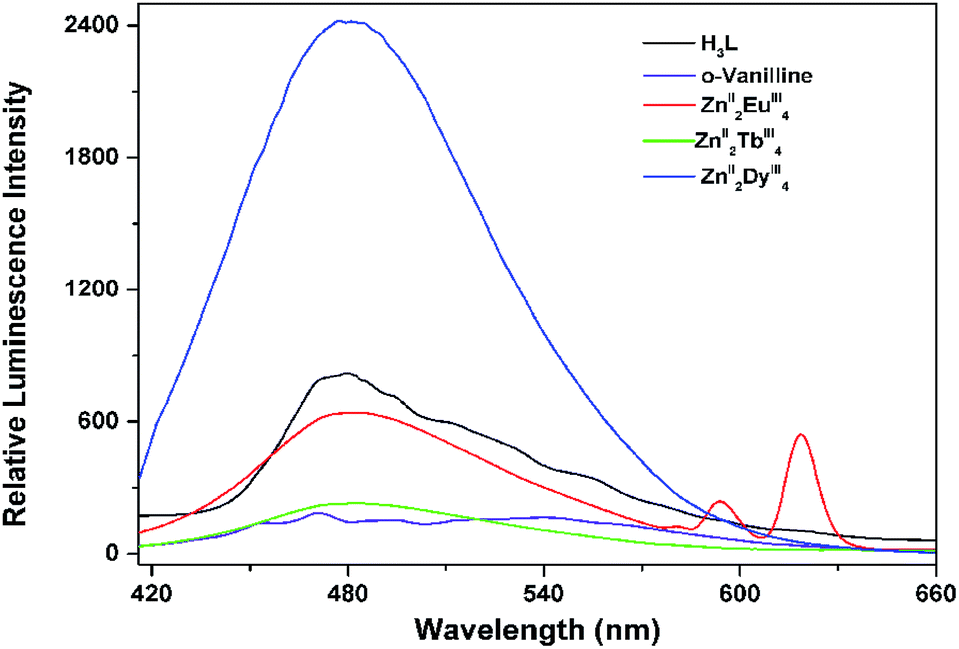 | ||
| Fig. 2 Emission spectra of H3L, o-vanilline, ZnII2EuIII4, ZnII2TbIII4 and ZnII2DyIII4 in solid state (excitation and emission passes = 2.5 nm). | ||
Upon UV irradiation at 340 nm, both H3L and o-vanilline present very broad bands ranging from 435 nm to 600 nm, which could be attributed to π* → π and intramolecular charge transitions of H3L and o-vanilline. The excitation spectra of ZnII2EuIII4 exhibits broad bands ranging from 325 nm to 425 nm upon EuIII-centered emission (Fig. S4†). Excited at ca. 365 nm, ZnII2EuIII4 shows reddish luminescence and exhibits both ligand-centered (λmax = 456 nm) and the typical f → f transitions of the EuIII ion with the former stronger than the latter. As for the characteristic emission of EuIII ion, the strong emission peak at 599 and 621 nm is assigned to magnetic dipolar 5D0 → 7F1 transition and the electric dipolar 5D0 → 7F2 transition respectively, the weak one at 582 nm can be attributed to the 5D0 → 7F0 transition. The intensity of the 5D0 → 7F2 transition is about 2.26 times stronger than that of the 5D0 → 7F1 transitions, higher than the value (0.67) for a centrosymmetric EuIII compound.21 The symmetry-forbidden emission 5D0 → 7F0 also appears in the emission spectra of ZnII2EuIII4. All these indicate that EuIII ions in ZnII2EuIII4 occupy sites with low symmetry and have no inversion center which is in good agreement with the result of the single crystal structure analyses. The luminescence decay of ZnII2EuIII4 is best described by a double-exponential process with significantly shorter lifetimes of τ1 = 0.245 ms, τ2 = 0.072 ms observed likely because of the presence of two distinct emitting species (Fig. S5†). When the same system were adopted to populate the excited state of the TbIII ion, the ligands-centered emission rather than TbIII luminescence is observed, indicating this mixed system can transfer some excitation energy to EuIII than to TbIII ions. Compared to that of ZnII2EuIII4, the luminescence lifetime of ZnII2TbIII4 is quite shorter with τ = 0.097 ms (Fig. S6†). In the case of ZnII2DyIII4, very strong blue emission with shortest lifetime of 9 ns (Fig. S7†) attributed to Zn–ligands system presented. It is well-known that the presence of OH oscillators in the lanthanide first coordination sphere provides an efficient non-radiative path,22 so we can suggest that the observed weak EuIII luminescence in ZnII2EuIII4 and the absence of TbIII/DyIII-centered emission are mainly related to increases in non-radiative transitions due to the presence of OH oscillators in the first coordination shell together with the mismatch between resonance energy levels of LnIII and excited states of ligands in these clusters. Notably, the emission spectra of the three clusters showed negligible changes when excited at different wavelengths as shown in Fig. S8–S10.†
Magnetic properties
The static magnetic behaviour of the ZnII2DyIII4 complex through direct current (dc) magnetic measurements between 2 and 300 K with an applied dc field of 1000 Oe was performed on microcrystalline samples. As observed in Fig. 3a, the χMT value almost remains unchanged from 300 to 12 K with a value of 57.44 cm3 K mol−1 at 300 K which is fairly close to the expected value of 56.68 cm3 K mol−1 for four uncoupled DyIII ions (6H15/2, g = 4/3). Below 10 K, the χMT value sharply goes up upon cooling and reaches 83.11 cm3 K mol−1 at 2 K. This behavior indicates that spin–orbital coupling leads the 4fn configuration of LnIII to split into 2S+1LJ states, and further into Stark components under the crystal-field perturbation, and the effect of depopulation of the Stark components of DyIII is nearly equal of the ferromagnetic coupling between DyIII ions in the higher temperature range. The increase of χMT in the low-temperature range obviously implies the presence of ferromagnetic coupling between DyIII ions, and it is strong enough to overcome the effect of depopulation of the Stark components of DyIII.8 Such strong ferromagnetic interactions are rare for both ZnII–LnIII clusters and LnIII complexes.23 Its occurrence may result from the connecting of two [Dy2Zn] building blocks through two μ3-OH−-bridge. In ZnII2DyIII4, the [Dy4O6] core was closely wrapped and the Dy–OH−–Dy angles with shortest distance of 3.567(7) Å are 96.51 and 98.76°, which therefore may lead to the strong uniaxial anisotropy of the DyIII ion.23d By comparison, a similar Dy4 clusters with the Dy–OH−–Dy angle above 103.95° exhibits antiferromagnetic interactions.19a The M vs. H data below 8 K show a rapid increase in the magnetization at low magnetic fields (Fig. 2b) which is expected for materials having ferromagnetically coupled spins. at higher fields, M increases slowly reaching a value of 36 μB which almost close to the theoretical value of 40 μB of four DyIII ions. The nonsuperposition of M vs. HT−1 in different fields (Fig. 2b inset) suggests the presence of significant magnetic anisotropy and/or low-lying excited states in ZnII2DyIII4.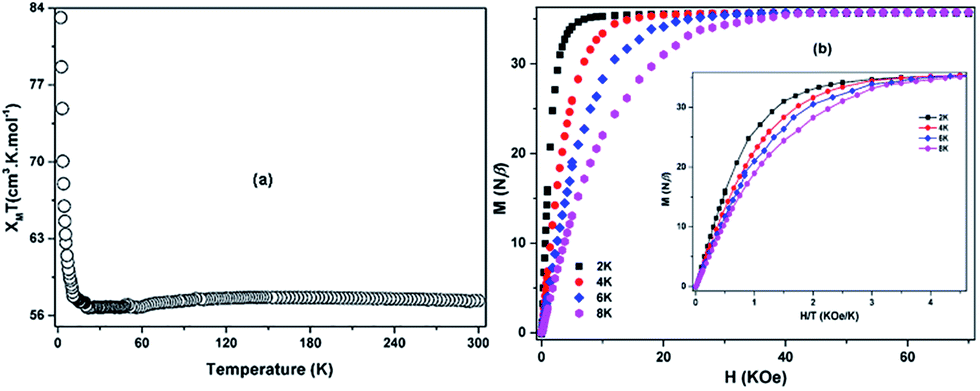 | ||
| Fig. 3 (a) Temperature dependence of χMT for ZnII2DyIII4 at 1000 Oe over the temperature of 2–300 K; (b) M vs. H plots and M vs. HT−1 plots (inset) for ZnII2DyIII4 at different temperatures. | ||
In addition, it is worth mentioning that the M vs. H data do not exhibit a hysteresis effect above 2 K with sweep rates used (100–300 Oe min−1). The absence of the M vs. H hysteresis loop at 2 K may be caused by the presence of a relatively fast zero-field relaxation as ascertained as follows.24
To further explore the dynamics of magnetization, we performed alternating current (ac) magnetic measurements on ZnII2DyIII4. Expectedly, strong frequency dependences for the real χ′M–T and the imaginary χ′′M–T parts of the ac susceptibilities were observed below 20 K as shown in Fig. 4. In plots of both χ′M–T and χ′′M–T, the peaks are observed above 20 Hz and shift to high temperature with increasing frequencies, which is the nature of slow magnetic relaxation. Noticeably, both χ′M and χ′′M below about 6 K increase with decreasing temperature, indicating the intervention of QTM. For Kramer's ions, such as DyIII, dipole–dipole and hyperfine interactions allow the mixing of the two Kramer's ground states at zero field, leading to the quantum tunnelling dynamics of the magnetization. Therefore, the temperature and frequency dependent ac susceptibility were measured under an applied 2000 Oe field which is also shown in Fig. 4. The diminishing of the upward χ′M and χ′′M at low temperatures can be taken as a clear indication of the efficient suppression of zero-field tunneling of magnetization occurring in ZnII2DyIII4. In addition, compared with magnetization at zero-field, the out-of-phase component χ′′M for higher frequencies exhibits a series of frequency-dependent peaks around 16.5 K, with a second set around 6 K, which indicates two relaxation processes dominate for Zn2IIDy4III under an applied 2 kOe field. The low temperature one (RLT) and high temperature one (RHT) could be ascribed to the two different DyIII ions centers in ZnII2DyIII4.25
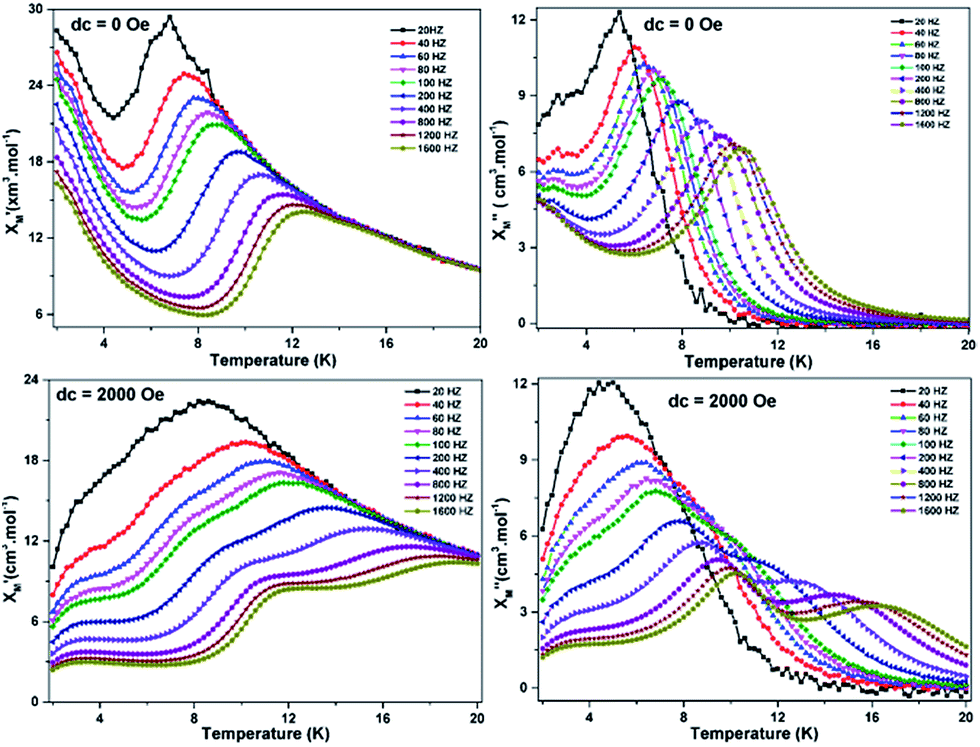 | ||
| Fig. 4 Ac magnetic measurements for ZnII2DyIII4 at Hac = 3 Oe and Hdc = 0 Oe/2000 Oe respectively. | ||
Soncini et al. used an electrostatic model to determine the magnetic anisotropy in dysprosium complexes and their results indicated the ground state of DyIII is doublet quantized along the anisotropy axis with an angular momentum quantum number mJ = ±15/2 in absence of high symmetry.26 Theoretical research has presented that the large magnetic anisotropy is obtained when only the low-lying ground state, |±15/2〉 Kramers doublet, is significantly populated.27 In case of ZnII2DyIII4, the combination of long and short Dy–O bond length in the ligand field can facilitate the stability of the oblate shape of |±15/2〉 Kramers doublet, which in turn leads to strong magnetic anisotropy.29 The peak temperatures, Tp, obtained by the Lorentzian peak function fitting from plots of χ′′M–T deduce a linear plot of 1/Tp vs. ln(2πf) and obey the Arrhénius law 1/Tp = −kB/ΔE[ln(2πf) + lnτ0] (Fig. 5), where f is the frequency. The best fitting of out-of-phase component χ′′M under zero dc field yields the energy barrier ΔE/kB = 56.7 K and the relaxation time τ0 = 4.8 × 10⁻⁷ s, which are comparable to those of reported DyIII-based SMMS.28
 | ||
| Fig. 5 The least-squares fit of the experimental data at Hdc = 0 Oe to the Arrhenius equation. | ||
Plotting the relaxation time τ of out-of-phase component χ′′M under 2000 Oe dc field versus the temperature Tp−1 and a linear fitting of the thermally activated points to the Arrhenius law afford ΔE1/kB = 6.30 K and the relaxation time τ1 = 9.55 × 10⁻³ s for RLT and ΔE2/kB = 67.1 K and τ2 = 1.66 × 10⁻⁶ s for RHT (Fig. 6). As a comparison, the energy barriers extracted from the high temperature regions is only a slight increase of the energy barrier, indicating that the quantum tunneling effect in this compound is not very pronounced.29
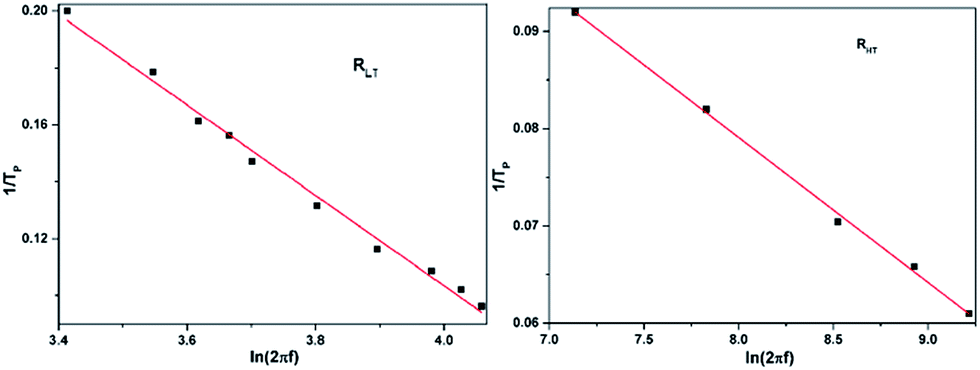 | ||
| Fig. 6 The least-squares fit of the experimental data at Hdc = 2000 Oe to the Arrhenius equation. | ||
The frequency dependence of ac susceptibilities at zero field leads to the semicircle Cole–Cole plots of χ′′M vs. χ′M (Fig. 7) at 8, 10, 12 and 14 K, respectively. The least-squares fitting results of the data are in good agreement with a distribution of single relaxation processes with α parameters of 0.07–0.15 (α = 0 corresponding to an infinitely narrow distribution of relaxation times), which is also compatible with the value reported.30 The shift of the peak temperature (Tp) of χ′′M is measured by a parameter ϕ = (ΔTp/Tp)/Δ(logf) = 0.26, which falls in the range of a normal value for a superparamagnet.8
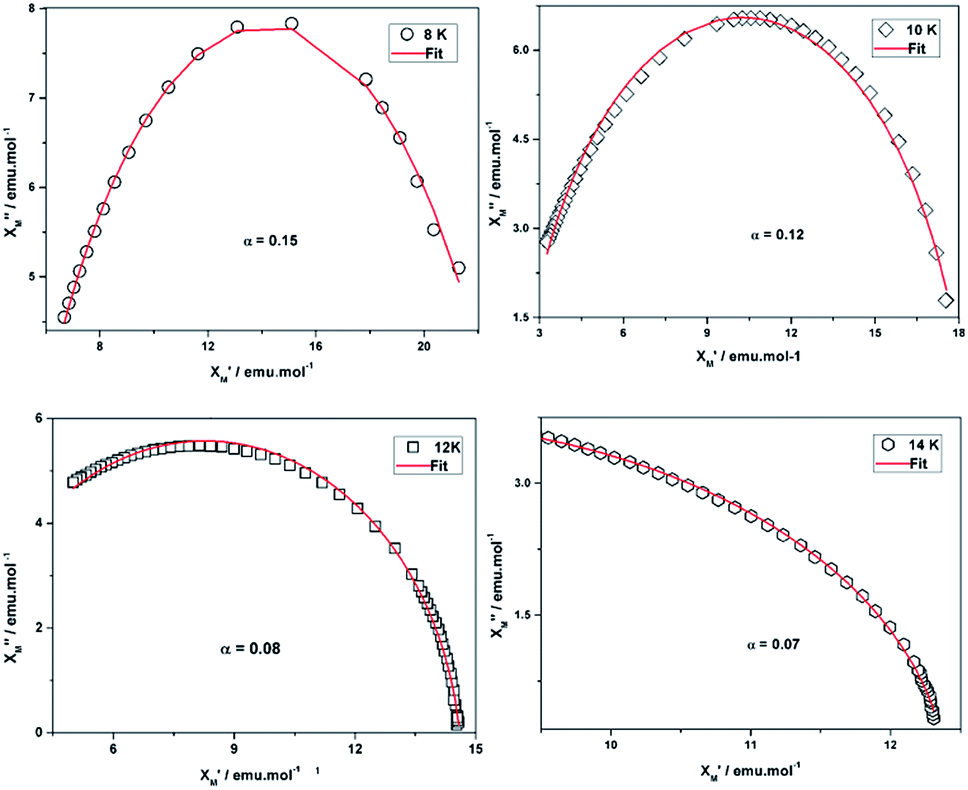 | ||
Fig. 7 Plots of χ′′M vs. χ′M of Zn2Dy4 at 8 K (○), 10 K (◇), 12 K (□) and 14 K (![[hexagon open, flat-side down]](https://www.rsc.org/images/entities/char_e1c0.gif) ) respectively. Red solid lines are the least-squares fitting results to a distribution of single relaxation processes with the small α value. ) respectively. Red solid lines are the least-squares fitting results to a distribution of single relaxation processes with the small α value. | ||
Conclusions
The self-assembly of a methoxy substituted salicylamide Salen-like ligand and o-vanilline in ZnII–LnIII chemistry led to three sandwich-like heterometallic clusters with hydroxyl bridged tetranuclear LnIII4 core swaddled by ZnII ion and deprotonated ligands. Photophysical determination indicate that ZnII2EuIII4 shows mixed emission both originating from ligands and EuIII ions, and ligand-centered emission in visible region is exclusively found for ZnII2TbIII4 and ZnII2DyIII4. Interestingly, ZnII2DyIII4 exhibits strong ferromagnetic magnetic behavior with a slow zero-field relaxation with τ0 = 4.8 × 10⁻⁷ s and ΔE/kB = 56.7 K. To our best knowledge, it is quite unusual that strong ferromagnetic coupling and slow magnetic relaxation coexist in ZnII–LnIII heterometallic clusters. Our current studies on construction of high-nuclearity heterometallic clusters are helpful in achieving further insights into the rational design and preparation of novel multifunctional ZnII–LnIII heterometallic clusters. Further studies focused on the construction of d–f nanoclusters of Salen-like salicylamide ligands with other auxiliary ligands, different substitution and different d-metal ions are in progress in our group.Acknowledgements
This work was supported by the National Natural Science Foundation of China (Grant: 21661019) and Gansu Natural Science Foundation of China. (Grant: 1212RJZA038).Notes and references
- (a) M. Brewer, J. Lee and J. G. Brennan, Inorg. Chem., 1995, 34, 5919 CrossRef CAS; (b) M. Berardini, T. J. Emge and J. G. Brennan, Inorg. Chem., 1995, 34, 5327 CrossRef CAS; (c) J. Ruiz, G. Lorusso, M. Evangelisti, E. K. Brechin, S. J. A. Pope and E. Colacio, Inorg. Chem., 2014, 53, 3586 CrossRef CAS PubMed; (d) T. D. Pasatoiu, C. Tiseanu, A. M. Madalan, B. Jurca, C. Duhayon, J. P. Sutter and M. Andruh, Inorg. Chem., 2011, 50, 5879 CrossRef CAS PubMed.
- K. Z. Su, F. L. Jiang, J. J. Qian, M. Y. Wu, K. C. Xiong, Y. L. Gai and M. C. Hong, Inorg. Chem., 2013, 52, 3780 CrossRef CAS PubMed.
- H.-B. Xu, H.-M. Wen, Z.-H. Chen, J. Li, L.-X. Shi and Z.-N. Chen, Dalton Trans., 2010, 39, 1948 RSC.
- X.-Q. Lü, W.-X. Feng, Y.-N. Hui, T. Wei, J.-R. Song, S.-S. Zhao, W.-Y. Wong, W.-K. Wong and R. A. Jones, Eur. J. Inorg. Chem., 2010, 2010, 2714 CrossRef.
- Z.-S. Meng, F.-S. Guo, J.-L. Liu, J.-D. Leng and M.-L. Tong, Dalton Trans., 2012, 41, 2320 RSC.
- X. P. Yang, Z. P. Li, S. Q. Wang, S. M. Huang, D. Schipperc and R. A. Jones, Chem. Commun., 2014, 50, 15569 RSC.
- L. Zhang, L. Zhao, P. Zhang, C. Wang, S.-W. Yuan and J. K. Tang, Inorg. Chem., 2015, 54, 11535 CrossRef CAS PubMed.
- Z. Chen, B. Zhao, P. Cheng, X.-Q. Zhao, W. Shi and Y. Song, Inorg. Chem., 2009, 48, 3493 CrossRef CAS PubMed.
- (a) H. Zhang, G.-L. Zhuang, X.-J. Kong, Y.-P. Ren, L.-S. Long, R.-B. Huang and L.-S. Zheng, Cryst. Growth Des., 2013, 13, 2493 CrossRef CAS; (b) R. Modak, Y. Sikdar, G. Cosquer, S. Hatterjee, M. Yamashita and S. Goswami, Inorg. Chem., 2016, 55, 691 CrossRef CAS PubMed; (c) S. Osa, T. Kido, N. Matsumoto, N. Re, A. Pochaba and J. Mrozinski, J. Am. Chem. Soc., 2004, 126, 420 CrossRef CAS PubMed; (d) S. F. Xue, Y.-N. Guo, L. Zhao, H. X. Zhang and J. K. Tang, Inorg. Chem., 2014, 53, 8165 CrossRef CAS PubMed; (e) I. A. Kühne, G. E. Kostakis, C. E. Anson and A. K. Powell, Inorg. Chem., 2016, 55, 4072 CrossRef PubMed; (f) J. Q. Zhang, C. Li, J. J. Wang, M. Zhu and L. C. Li, Eur. J. Inorg. Chem., 2016, 2016, 1383 CrossRef CAS; (g) X. F. Wang, P. Hu and J.-P. Sutter, Inorg. Chem., 2015, 54, 9664 CrossRef CAS PubMed; (h) H.-R. Wen, J. Bao, S.-J. Liu, C. M. Liu, C.-W. Zhang and Y.-Z. Tang, Dalton Trans., 2015, 44, 11191 RSC; (i) W.-W. Kuang, L. L. Zhu, L. C. Li and P.-P. Yang, Eur. J. Inorg. Chem., 2015, 2015, 2245 CrossRef CAS; (j) Y.-A. Liu, C.-Y. Wang, M. Zhang and X.-Q. Song, Polyhedron, 2017, 127, 278 CrossRef CAS; (k) F. J. Kettles, V. A. Milway, F. Una, R. Valiente, L. H. Thomas, W. Wernsdorfer, S. T. Ochsenbein and M. Murrie, Inorg. Chem., 2014, 53, 8970 CrossRef CAS PubMed.
- X.-Q. Song, P.-P. Liu, Y.-A. Liu, J.-J. Zhou and X. L. Wang, Dalton Trans., 2016, 45, 8154 RSC.
- X.-Q. Song, P.-P. Liu, Z.-R. Xiao, X. Li and Y.-A. Liu, Inorg. Chim. Acta, 2015, 438, 232 CrossRef CAS.
- D. C. Santra, K. B. Manas, K. S. Pradip and M. Sudip, Chem.–Eur. J., 2016, 22, 2012 CrossRef CAS PubMed.
- G. M. Sheldrick, Acta Crystallogr., Sect. A: Found. Crystallogr., 1990, 46, 467 CrossRef.
- G. M. Sheldrick, SHELXL-2014, University of Gottingen, Gottingen, Germany, 2014 Search PubMed.
- (a) SAINT, version 6.02, Bruker AXS Inc, Madison, WI, 2002 Search PubMed; (b) K. Bhattacharya, M. Maity, D. Mondal, A. Endo and M. Chaudhury, Inorg. Chem., 2012, 51, 7454 CrossRef CAS PubMed.
- (a) DIAMOND, Visual Crystal Structure Information System, version 3.1, Crystal Impact, Bonn, Germany, 2004 Search PubMed; (b) X.-Q. Song, Y.-K. Lei, X.-R. Wang, M.-M. Zhao, Y.-Q. Peng and G.-Q. Cheng, J. Solid State Chem., 2014, 218, 202 CrossRef CAS.
- A. L. Spek, J. Appl. Crystallogr., 2003, 36, 7 CrossRef CAS.
- A. K. Mondal, H. S. Jena, A. Malviya and S. Konar, Inorg. Chem., 2016, 55, 5237 CrossRef CAS PubMed.
- (a) P.-H. Guo, J.-L. Liu, Z.-M. Zhang, L. Ungur, L. F. Chibotaru, J. D. Leng, F.-S. Guo and M.-L. Tong, Inorg. Chem., 2012, 51, 1233 CrossRef CAS PubMed; (b) H. S. Ke, P. Gamez, L. Zhao, G.-F. Xu, S. F. Xue and J. K. Tang, Inorg. Chem., 2010, 49, 7549 CrossRef CAS PubMed.
- X. P. Yang, D. Schipper, R. A. Jones, L. A. Lytwak, B. J. Holliday and S. M. Huang, J. Am. Chem. Soc., 2013, 135, 8468 CrossRef CAS PubMed.
- M. Latva, H. Takalo, V.-M. Mukkala, C. Matachescu, J. C. Rodríguez-Ubis and J. Kankare, J. Lumin., 1997, 75, 149 CrossRef CAS.
- (a) W. D. Horrocks Jr, J. Am. Chem. Soc., 1979, 101, 334 CrossRef; (b) X. Q. Song, X. Y. Zhou, W. S. Liu, W. Dou, J. X. Ma, X. L. Tang and J. R. Zheng, Inorg. Chem., 2008, 47, 11501 CrossRef CAS PubMed.
- (a) M. Chen, E. C. Sañudo, E. Jiménez, S.-M. Fang, C.-S. Liu and M. Du, Inorg. Chem., 2014, 53, 6708 CrossRef CAS PubMed; (b) R.-X. Yao, X. Xu and X.-M. Zhang, RSC Adv., 2014, 4, 53954 RSC; (c) S.-J. Liu, J.-P. Zhao, W.-C. Song, S.-D. Han, Z.-Y. Liu and X.-H. Bu, Inorg. Chem., 2013, 52, 2103 CrossRef CAS PubMed; (d) P. Zhang, L. Zhang, S.-Y. Lin and J. K. Tang, Inorg. Chem., 2013, 52, 6595 CrossRef CAS PubMed.
- P.-H. Lin, T. J. Burchell, R. Clérac and M. Murugesu, Angew. Chem., Int. Ed., 2008, 47, 8848 CrossRef CAS PubMed.
- W.-B. Sun, B. Yan, L.-H. Jia, B.-W. Wang, Q. Yang, X. Cheng, H.-F. Li, P. Chen, Z.-M. Wang and S. Gao, Dalton Trans., 2016, 45, 8790 RSC.
- N. F. Chilton, D. Collison, E. J. L. McInnes, R. E. P. Winpenny and A. Soncini, Nat. Commun., 2013, 4, 2551 Search PubMed.
- I. Oyarzabal, J. Ruiz, J. M. Eco, M. Evangelisti, A. Camón, E. Ruiz, D. Aravena and E. Colacio, Chem.–Eur. J., 2014, 20, 14262 CrossRef CAS PubMed.
- S. Liu, K. Lang, Y. Zhang, Q. Yang, B. Wang and S. A Gao, Dalton Trans., 2016, 45, 8149 RSC.
- G. Abbas, Y. Lan, G. E. Kostakis, W. Wernsdorfer, C. E. Anson and A. K. Powell, Inorg. Chem., 2010, 49, 8067 CrossRef CAS PubMed.
- (a) W.-M. Wang, W.-Z. Qiao, H.-X. Zhang, S.-Y. Wang, Y.-Y. Nie, H.-M. Chen, Z. Liu, H.-L. Gao, J.-Z. Cui and B. Zhao, Dalton Trans., 2016, 45, 8182 RSC; (b) G. Xiong, X. Y. Qin, P. F. Shi, Y. L. Hou, J. Z. Cui and B. Zhao, Chem. Commun., 2014, 50, 4255 RSC; (c) R. Modak, Y. Sikdar, G. Cosquer, S. Chatterjee, M. Yamashita and S. Goswami, Inorg. Chem., 2016, 55, 691 CrossRef CAS PubMed.
Footnote |
| † Electronic supplementary information (ESI) available: A brief statement in CIF, figures of TGA curves (Fig. S1), figures of PXRD curves (Fig. S2), coordination polyhedron of DyIII in ZnII2DyIII4 (Fig. S3), excitation spectra of ZnII2EuIII4 (Fig. S4), emission decay curves of ZnII2EuIII4, ZnII2EuIII4, and ZnII2DyIII4 (Fig. S5–S7), emission spectra of different wavelength excitation (Fig. S8–S10). A summary of the relevant crystallographic data and the final refinement details are given in Table S1, important bond lengths are listed in Table S2. CCDC 482428–1482430. For ESI and crystallographic data in CIF or other electronic format see DOI: 10.1039/c7ra01469d |
| This journal is © The Royal Society of Chemistry 2017 |