 Open Access Article
Combinatorial optimization of the atomic compositions for green-emitting YBO3:Ce3+,Tb3+ and red-emitting YBO3:Ce3+,Tb3+,Eu3+ phosphors using a microplate reader†
Kohei Yano,
Satoru Takeshita‡
,
Yoshiki Iso * and
Tetsuhiko Isobe*
Department of Applied Chemistry, Faculty of Science and Technology, Keio University, 3-14-1 Hiyoshi, Kohoku-ku, Yokohama 223-8522, Japan. E-mail: iso@applc.keio.ac.jp; isobe@applc.keio.ac.jp; Fax: +81 45 566 1551; Tel: +81 45 566 1558 Tel: +81 45 566 1554
First published on 21st March 2017
Abstract
Microplate readers are versatile devices that can rapidly measure the photoluminescence intensities of multiple samples, and are widely used in biological chemistry. In this work, using a commercial microplate reader, we attempted to optimize the atomic compositions of green-emitting phosphor Y1−x−yCexTbyBO3 and red-emitting phosphor Y1−x−y−zCexTbyEuzBO3. We filled 48 individual wells of an alumina microplate with aqueous solutions of nitrates of Y3+, Ce3+, Tb3+, and Eu3+ with different compositions, and then added an aqueous solution of boric acid to each well. After drying, the microplate was heated at 550 °C for 2 h in air, and then at 1100 °C for 3 h in a reducing atmosphere. Y1−x−yCexTbyBO3 absorbed near ultraviolet light through 4f → 5d transitions of Ce3+ and emitted green fluorescence corresponding to 4f → 4f transitions of Tb3+ through Ce3+ → Tb3+ energy transfer. Moreover, Y1−x−y−zCexTbyEuzBO3 emitted red fluorescence corresponding to 4f → 4f transitions of Eu3+ through Ce3+ → Tb3+ → Eu3+ energy transfer under near-ultraviolet light. Measurement of the photoluminescence intensity of each well by a microplate reader revealed that the optimized green and red phosphors were Y0.835Ce0.025Tb0.14BO3 and Y0.535Ce0.005Tb0.45Eu0.01BO3, respectively.
1 Introduction
Luminescent inorganic materials are widely used in various optoelectronic devices and bioassays, such as white light-emitting diodes (LEDs),1–5 displays,6 and biological labels,7–10 because of their high durability and thermal and chemical stabilities. Phosphors that emit visible colors under near-ultraviolet (near-UV) or blue excitation light are currently used as spectral conversion materials in white LEDs. White LEDs composed of a blue-emitting LED and Y3Al5O12(YAG):Ce3+ phosphor that converts blue light to yellow are widely available.11 However, this conventional combination exhibits a low color rendering index (CRI) because of the lack of a red component. Accordingly, red-emitting phosphors excited by blue LEDs have been used to improve the CRI of devices.3 White LEDs consisting of a near-UV LED and blue-, green-, and red-emitting phosphors have also been developed.3 Conventional red phosphors such as Y2O3:Eu3+ and Y2O2S:Eu3+ show poor photoluminescence (PL) efficiency under near-UV excitation.12–15 The absorbance of these phosphors are small in the near-UV region because 4f → 4f transitions of Eu3+ are forbidden and their line widths are narrow.16 To realize efficient red emission of Eu3+, sensitizers with broad and strong absorption in the near-UV region are needed.YBO3 is used as a host crystal because of its high transparency and excellent optical damage threshold in the UV and visible regions.17–20 YBO3 has been synthesized via a solid-state reaction at high temperature.21 In addition, YBO3 has also been synthesized at low temperature by combustion,22,23,28 spray pyrolysis,24–27 the sol–gel method,28–33 and coprecipitation.34,35 Nohara et al. and Sato et al.36–38 reported that YBO3:Ce3+,Tb3+ emits green light through Ce3+ → Tb3+ energy transfer under near-UV excitation. Setlur and colleagues found that YBO3:Ce3+,Tb3+,Eu3+ emits red light via Ce3+ → Tb3+ → Eu3+ energy transfer under near-UV excitation.39 Sohal and co-workers reported that the PL intensities of Ce3+ and Tb3+ decreased and that of Eu3+ increased with increasing Tb3+ concentration in YBO3:Ce3+,Tb3+,Eu3+ at fixed concentrations of Ce3+ and Eu3+.40 The intensity ratio of red emission corresponding to the electric dipole transition (5D0 → 7F2) relative to orange emission corresponding to the magnetic dipole transition (5D0 → 7F1) was improved because of the highly distorted symmetry around the Eu3+ local site. YBO3:Ce3+,Tb3+ and YBO3:Ce3+,Tb3+,Eu3+ have various relaxation routes whose probabilities depend on the concentrations of individual dopants. For YBO3:Ce3+,Eu3+, the Eu3+ emission is quenched by metal-to-metal charge transfer (MMCT) from Ce3+ to Eu3+ to form Ce4+ and Eu2+ under near-UV excitation.39 When YBO3:Ce3+,Eu3+ is codoped with a high concentration of Tb3+, Ce3+ absorbs near-UV light through the 4f → 5d transition, and then sequential energy transfer occurs from Ce3+ to Tb3+ to Eu3+, followed by red emission from Eu3+.
The combinatorial method is used to fabricate multiple products called a “library” by reacting various combinations of feedstocks. The library is analyzed to identify an optimal product. This method can drastically shorten the time for experimental planning, execution, and analysis. In recent years, combinatorial chemistry has been widely used for drug analysis and synthesis of functional inorganic materials including fluorescent compounds.41–47 Chen et al.46 developed a unique drop-on-demand inkjet delivery system, which they used to optimize the composition of red-emitting phosphor Y2O3:Bi3+,Eu3+. Su and colleagues determined the optimum composition of yellow-emitting phosphor (Lu1−xGdx)3Al5O12:Ce3y through a combinatorial procedure.47 However, these methods used custom-made equipment to analyze each sample in the libraries.
Microplate readers are common commercial devices often used to simultaneously measure the fluorescence intensities of a number of samples, e.g., fluorescently-labeled biomolecules, in a library.48–50 As a result, microplate readers can drastically shorten analysis time. In this work, we attempt to optimize the atomic compositions of green-emitting phosphor YBO3:Ce3+,Tb3+ and red-emitting phosphor YBO3:Ce3+,Tb3+,Eu3+ excited by near-UV irradiation through combinatorial synthesis and simultaneous analysis using a microplate reader.
2 Experimental section
2.1 Preparation of YBO3:Ce3+,Tb3+ and YBO3:Ce3+,Tb3+,Eu3+ libraries
Yttrium(III) nitrate hexahydrate (Kanto, 99.99%), cerium(III) nitrate hexahydrate (Kanto, 98.5%), terbium(III) nitrate hexahydrate (Kanto, 99.95%), and europium(III) nitrate hexahydrate (Kanto, 99.99%) were dissolved in ultrapure water to prepare 0.5 M aqueous solutions of RE(NO3)3 (RE = Y, Ce, Tb, Eu). Boric acid (Aldrich, 99.99%) was dissolved in ultrapure water to prepare a 0.6 M aqueous solution. Each of the 48 wells of an alumina microplate was filled with an aqueous nitrate solution (1 mL), which is a mixture of the prepared RE(NO3)3 solutions with a desired ratio and boric acid (4 mL), and then the microplate was dried at 80 °C. This process was repeated five times by human hands. After drying, the 48 mixtures in the microplate were ground by human hands and pre-heated in a muffle furnace at 550 °C for 2 h in air, following cooling to room temperature. Each sample was reground and then heated at 1100 °C for 3 h in a reducing atmosphere using carbon board to obtain YBO3:Ce3+,Tb3+ and YBO3:Ce3+,Tb3+,Eu3+ phosphors.2.2 Characterization
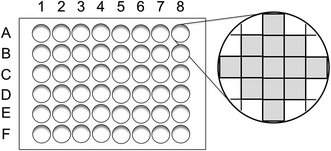
Powder X-ray diffraction (XRD) profiles were measured using an X-ray diffractometer (Rigaku, Rint 2200) with a Cu Kα radiation source. The elemental composition of YBO3:Ce3+,Tb3+ and YBO3:Ce3+,Tb3+,Eu3+ powder samples was determined by the fundamental parameter method using an X-ray fluorescence analyzer (Rigaku, ZSX mini II). Both PL and photoluminescence excitation (PLE) spectra were measured using a fluorescence spectrometer (JASCO, FP-6500) equipped with a 150-W Xe lamp. The PL intensity of each well of the microplate was measured using a multi-detection microplate reader (DS Pharma Biomedical, Powerscan HT) with an excitation band-pass filter (BT-7082220; 360 ± 40 nm). Emission band-pass filters [BT-7082210 (545 ± 40 nm) and BT-7082226 (645 ± 40 nm)] were used to detect green and red emission, respectively. Each well of a microplate was divided to 13 blocks, as shown in Fig. 1, and the PL intensity of each well was defined as an average of three strongest PL intensity among the 13 blocks. The PL measurement of 48 wells was completed in ∼8 min. To determine the precision of the procedure, Y0.82Ce0.03Tb0.15BO3 was synthesized in 48 wells of a microplate and the PL intensity of each well was evaluated from a representative value, which was the average of the three highest PL intensities among 13 blocks. The relative deviation of representative values of PL intensities was within 8.0%.3 Results and discussion
3.1 Structural properties of the Y1−x−yCexTbyBO3 library
XRD profiles of samples from the Y1−x−yCexTbyBO3 library (0 ≤ x ≤ 0.1, 0 ≤ y ≤ 0.4) with a wide range of Ce3+ and Tb3+ concentrations synthesized in the wells of a microplate were measured (see Fig. S1†). All the XRD peaks except for that at 27.5° belonged to YBO3 with hexagonal structure. The peak at 27.5° possibly originated from the byproduct Y3BO6, which accidentally formed through the evaporation of boron. Actual metallic compositions of typical samples (shown in Table S1†) were evaluated to be close to loading ones except for that of the sample taken from well A-7.3.2 Photoluminescence spectra of the Y1−x−yCexTbyBO3 library
Fig. 2 shows PL and PLE spectra of Y0.98Ce0.02BO3 and Y0.83Ce0.02Tb0.15BO3 synthesized in the wells of a microplate. The PL intensity at 416 nm corresponding to the 5d → 4f transition of Ce3+ for Y0.83Ce0.02Tb0.15BO3, which exhibited Tb3+ emission in the wavelength region of 480–640 nm, was lower than that for Y0.98Ce0.02BO3. In the PLE spectrum of Y0.83Ce0.02Tb0.15BO3 monitored at the Tb3+ 5D4 → 7F5 emission wavelength λem of 544 nm, the excitation peak corresponding to the 4f → 5d transition of Ce3+ was observed at 360 nm. This result indicates that energy transfer occurred from Ce3+ to Tb3+.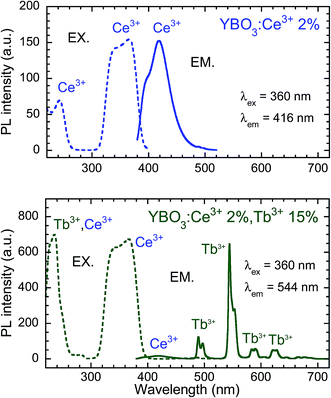 | ||
| Fig. 2 PL and PLE spectra of Y0.98Ce0.02BO3 and Y0.83Ce0.02Tb0.15BO3 synthesized in the wells of a microplate. | ||
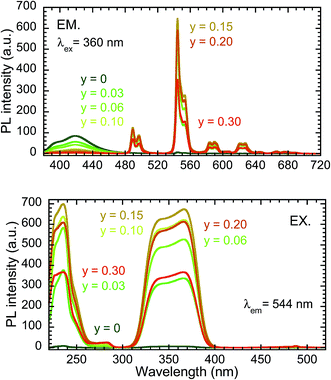
Fig. 3 depicts the PL (excitation wavelength λex = 360 nm) and PLE (λem = 544 nm) spectra of the samples from the Y0.98−yCe0.02TbyBO3 library, in which the Ce3+ concentration was fixed at 2 at% and the Tb3+ concentration was varied from 0 to 30 at%. The maximum PL intensity at 544 nm corresponding to the 5D4 → 7F5 transition of Tb3+ was observed when the Tb3+ concentration was 15 at%. The PL intensity of the Ce3+ 5d → 4f emission simply decreased with increasing Tb3+ concentration. The efficiency of Ce3+ → Tb3+ energy transfer and PL intensity of the Tb3+ 5D4 → 7F5 emission at 544 nm are plotted as a function of Tb3+ concentration in Fig. 4. Energy transfer efficiency, η, is given by:
 | (1) |
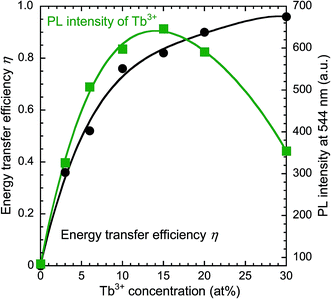 | ||
| Fig. 4 Dependence of the energy transfer efficiency and PL intensity of Y0.98−yCe0.02TbyBO3 (0 ≤ y ≤ 0.3) samples on Tb3+ concentration. | ||
3.3 Optimization of the atomic composition of the Y1−x−yCexTbyBO3 phosphor
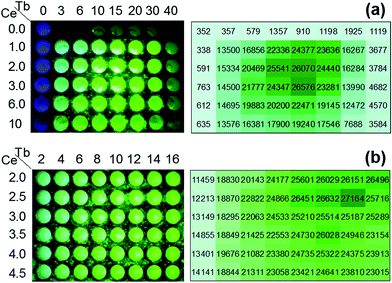
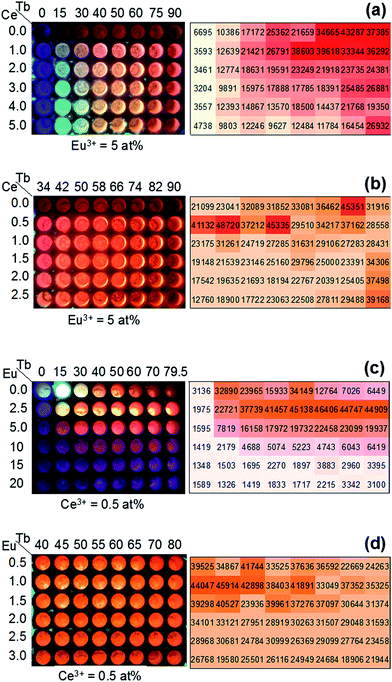
To roughly determine the optimum atomic composition range of the Y1−x−yCexTbyBO3 phosphor, a Y1−x−yCexTbyBO3 library with various Ce3+ and Tb3+ concentrations over wide ranges of 0 ≤ x ≤ 0.1 and 0 ≤ y ≤ 0.4 was prepared. Fig. 5(a) shows a fluorescence image of the library under near-UV excitation and measured PL intensities of each well measured by the microplate reader. Strong emission was observed when the Ce3+ concentration was 2–3 at% and Tb3+ concentration was 15 at%.Next, a Y1−x−yCexTbyBO3 library with narrow ranges of 0.020 ≤ x ≤ 0.045 and 0.02 ≤ y ≤ 0.16 was prepared to find the optimum atomic composition for this phosphor. As illustrated in Fig. 5(b), Y0.835Ce0.025Tb0.14BO3 was determined as the optimum composition with the strongest green PL intensity.
3.4 Structural properties of the Y1−x−y−zCexTbyEuzBO3 library
XRD profiles of samples from the Y1−x−y−zCexTbyEuzBO3 library (0 ≤ x ≤ 0.05, 0 ≤ y ≤ 0.90, z = 0.05; synthesized with wide ranges of Ce3+ and Tb3+ concentrations and a fixed Eu3+ concentration of 5 at%) and Y1−x−y−zCexTbyEuzBO3 library (x = 0.005, 0 ≤ y ≤ 0.795, 0 ≤ z ≤ 0.20; synthesized with wide ranges of Tb3+ and Eu3+ concentrations and a fixed Ce3+ concentration of 0.5 at%) were measured (see Fig. S2 and S3,† respectively). All the XRD peaks except for a weak peak attributed to Y3BO6 at 27.5° belonged to YBO3 with hexagonal structure. Actual metallic compositions were close to loading ones (see Tables S2 and S3†).3.5 Photoluminescence spectra of the Y1−x−y−zCexTbyEuzBO3 library
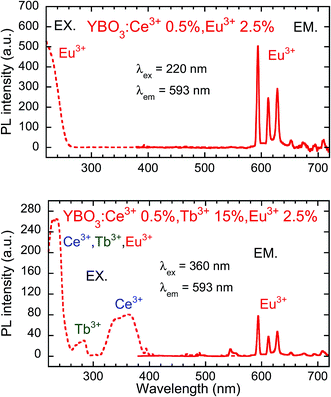
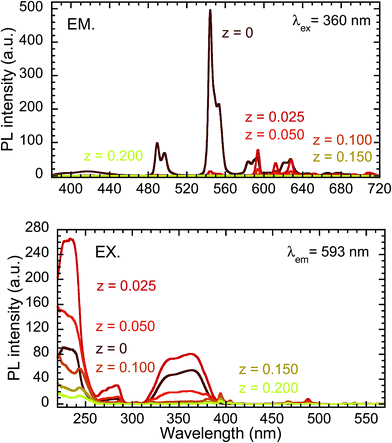
Fig. 6 presents PL and PLE spectra of Y0.97Ce0.005Eu0.025BO3 and Y0.82Ce0.005Tb0.15Eu0.025BO3 synthesized in the wells of a microplate. In the PLE spectrum monitored at the Eu3+ 5D0 → 7F1 emission (λem = 593 nm), the excitation peak corresponding to the 4f → 5d transition of Ce3+ was not observed for Y0.97Ce0.005Eu0.025BO3. In contrast, for Y0.82Ce0.005Tb0.15Eu0.025BO3, the excitation peaks ascribed to the Tb3+ 4f8 → 4f75d1 and Ce3+ 4f → 5d transitions were observed at 280 and 360 nm, respectively. This result indicates that Tb3+ relays the energy of excited Ce3+ to Eu3+. Judging from the PL spectra of Y0.845Ce0.005Tb0.15BO3 and Y0.82Ce0.005Tb0.15Eu0.025BO3 synthesized in the wells of a microplate (Fig. S4†), PL intensities of Tb3+ and Ce3+ under excitation of Ce3+ decreased after co-doping with Eu3+, indicating that Ce3+ → Eu3+ and Ce3+ → Tb3+ → Eu3+ energy transfer processes occurred. However, Ce3+ → Eu3+ direct energy transfer did not contribute to the Eu3+ emission, because MMCT caused Ce3+ and Eu3+ to convert to Ce4+ and Eu2+, respectively, quenching the Eu3+ emission.Fig. 7 shows the PL (λex = 360 nm) and PLE (λem = 593 nm) spectra of samples from the Y0.845−zCe0.005Tb0.15EuzBO3 library, in which Ce3+ and Tb3+ concentrations were fixed at 0.5 and 15 at%, respectively, and Eu3+ concentration was varied from 0 to 20 at%. The maximum PL intensity of Eu3+ at 593 nm was reached at an Eu3+ concentration of 2.5 at%. The PL intensity of Tb3+ decreased with increasing Eu3+ concentration. Tb3+ → Eu3+ energy transfer efficiency and the PL intensity of Eu3+ at 593 nm are plotted as a function of Eu3+ concentration in Fig. 8. The η of Tb3+ → Eu3+ energy transfer was estimated using eqn (1); in this case, I0 and I were the PL intensities of Tb3+ at 544 nm in the absence and presence of Eu3+, respectively. With increasing Eu3+ concentration, η increased until it approached unity over an Eu3+ concentration of 2.5 at%, while the PL intensity of Eu3+ decreased over this concentration. This result would indicate that concentration quenching of Eu3+,52,53 caused by enhancement of probability of a non-radiative relaxation through the energy migration of Eu3+ → Eu3+, occurred when the Eu3+ concentration exceeded 2.5 at%. It should be noted that the MMCT effect between Ce3+ and Eu3+ was ignored for the calculation of η. The decrease in PL intensity might be affected by enhancement of the MMCT as well as the concentration quenching.
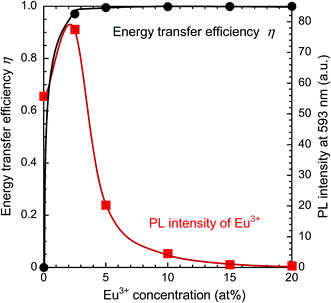 | ||
| Fig. 8 Dependence of the energy transfer efficiency and PL intensity of Y0.845−zCe0.005Tb0.15EuzBO3 (0 ≤ z ≤ 0.2) on Eu3+ concentration. | ||
3.6 Optimization of the atomic composition of the Y1−x−y−zCexTbyEuzBO3 phosphor
To roughly determine the optimum concentration range of the Y1−x−y−zCexTbyEuzBO3 phosphor, a Y1−x−y−zCexTbyEuzBO3 library with various Ce3+ and Tb3+ concentrations over wide ranges of 0 ≤ x ≤ 0.05 and 0 ≤ y ≤ 0.90 and a fixed Eu3+ concentration of 5 at% was prepared. Fig. 9(a) shows a fluorescence image of the library under near-UV excitation and the average value of the three strongest red emission intensities in each well measured by a microplate reader. The strong emission was observed for Ce3+ and Tb3+ concentrations of 0–2 and 40–90 at%, respectively. To determine the optimum concentration of Ce3+, a Y1−x−y−zCexTbyEuzBO3 library with narrow ranges of 0 ≤ x ≤ 0.025 and 0.34 ≤ y ≤ 0.90 and at a fixed Eu3+ concentration of 5 at% was prepared. As illustrated in Fig. 9(b), the strong emission was found when the concentrations of Ce3+ and Tb3+ were 0.5 at% and 40–60 at%, respectively. Therefore, the optimum concentration of Ce3+ was 0.5 at%.A Y1−x−y−zCexTbyEuzBO3 library with wide concentration ranges of 0 ≤ y ≤ 0.795 and 0 ≤ z ≤ 0.20 and at a fixed Ce3+ concentration of 0.5 at% was prepared. Fig. 9(c) reveals that strong emission was obtained for concentrations of Tb3+ of 40–80 at% and Eu3+ of 2.5 at%. Then, a Y1−x−y−zCexTbyEuzBO3 library with narrow ranges of 0.40 ≤ y ≤ 0.80 and 0.005 ≤ z ≤ 0.030 and a fixed Ce3+ concentration of 0.5 at% was prepared to determine the optimum composition of this phosphor. Fig. 9(d) indicates that Y0.535Ce0.005Tb0.45Eu0.01BO3 is the optimum composition with the strongest red PL intensity. Red to orange ratios were calculated from the PL intensities attributed to 5D0 → 7F1 transition (O) at 593 nm and 5D0 → 7F2 transition of Eu3+ (see PL and PLE spectra shown in Fig. S5†). There were two large red peaks assigned to the 5D0 → 7F2 transition at 611 nm (R1) and 627 nm (R2) due to Stark splitting. Calculated ratios were R1/O = 0.484 and R2/O = 0.621. CIE coordinate obtained from the PL spectrum was (0.636, 0.359) (also shown in Fig. S5†).
3.7 Factors determining the optimum composition of the Y1−x−y−zCexTbyEuzBO3 phosphor
The optimum concentration of Ce3+ and Tb3+ in Y1−x−yCexTbyBO3 were 2.5 and 14 at%, respectively. In contrast, the optimum concentrations of Ce3+, Tb3+, and Eu3+ in Y1−x−y−zCexTbyEuzBO3 were 0.5, 45, and 1.0 at%, respectively. We note that the optimum concentrations of Ce3+ and Tb3+ for Y1−x−y−zCexTbyEuzBO3 were lower and higher, respectively, compared with those in Y1−x−yCexTbyBO3. This means the addition of Tb3+ suppresses the quenching of Eu3+ emission by inhibiting MMCT from Ce3+ to Eu3+ which results from enhancing probability of the Ce3+ → Tb3+ energy transfer. Fig. 10 summarizes energy transfer routes in the phosphors. Because of the lower concentration of Ce3+ and higher concentration of Tb3+ in Y1−x−y−zCexTbyEuzBO3 compared with those in Y1−x−yCexTbyBO3, the possibility of Ce3+ → Tb3+ energy transfer could be higher than Ce3+ → Eu3+ energy transfer in Y1−x−y−zCexTbyEuzBO3.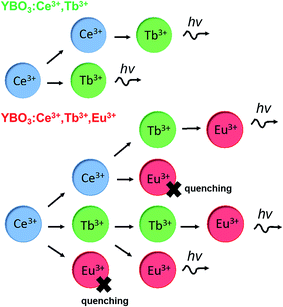 | ||
| Fig. 10 Schematic illustration of the energy transfer routes in YBO3:Ce3+,Tb3+ and YBO3:Ce3+,Tb3+,Eu3+. | ||
4 Conclusions
Metal nitrate aqueous solutions with different compositions and boric acid aqueous solution were reacted in alumina microplate wells to obtain libraries of the green-emitting phosphor Y1−x−yCexTbyBO3 and red-emitting phosphor Y1−x−y−zCexTbyEuzBO3. The compositions of both phosphors were optimized by evaluating the PL intensity of each microplate well measured by a versatile microplate reader. For the green-emitting phosphor, the concentrations of Ce3+ and Tb3+ were changed over wide ranges, and then over narrow ranges. The determined optimum composition of Y1−x−yCexTbyBO3 was Y0.835Ce0.025Tb0.14BO3. For the red-emitting phosphor, the concentration of Eu3+ was fixed at 5 at% and the concentrations of Ce3+ and Tb3+ were optimized similarly. The PL intensity of this phosphor was more sensitive to Ce3+ concentration than Tb3+, and the determined optimum concentration of Ce3+ was 0.5 at%. Then, the concentrations of Tb3+ and Eu3+ were optimized at a constant Ce3+ concentration of 0.5 at%. The determined optimum composition of Y1−x−y−zCexTbyEuzBO3 was Y0.535Ce0.005Tb0.45Eu0.01BO3. The optimum concentration of Ce3+ was lower and that of Tb3+ was higher for the red-emitting phosphor compared with those of the green-emitting phosphor. This is attributed to suppression of Ce3+ → Eu3+ MMCT, which causes quenching of Eu3+ emission, using a lower Ce3+concentration. The technique developed in this work will be useful to determine the optimum compositions of other phosphors.References
- D. A. Steigerwald, J. C. Bhat, D. Collins, R. M. Fletcher, M. O. Holcomb, M. J. Ludowise, P. S. Martin and S. L. Rudaz, IEEE J. Sel. Top. Quantum Electron., 2002, 8, 310–320 CrossRef CAS.
- H. A. Höppe, Angew. Chem., Int. Ed., 2009, 48, 3572–3582 CrossRef PubMed.
- S. Ye, F. Xiao, Y. X. Pan, Y. Y. Ma and Q. Y. Zhang, Mater. Sci. Eng., R, 2010, 71, 1–34 CrossRef.
- A. Revaux, G. Dantelle, N. George, R. Seshadri, T. Gacoin and J. P. Boilot, Nanoscale, 2011, 3, 2015–2022 RSC.
- W.-Y. Huang, F. Yoshimura, K. Ueda, Y. Shimomura, H.-S. Sheu, T.-S. Chan, H. F. Greer, W. Zhou, S.-F. Hu, R.-S. Liu and J. P. Attfield, Angew. Chem., Int. Ed., 2013, 52, 8102–8106 CrossRef CAS PubMed.
- S. Zhang, IEEE Trans. Plasma Sci., 2006, 34, 294–304 CrossRef CAS.
- B. Dong, J. Wang, J. Sun, S. Xu, X. Bai, Z. Jiang, L. Xia, L. Sun and H. Song, RSC Adv., 2012, 2, 3897–3905 RSC.
- K. M. Kim and J. H. Ryu, J. Alloys Compd., 2013, 576, 195–200 CrossRef CAS.
- I. L. Medintz, H. T. Uyada, E. R. Goldman and H. Mattoussi, Nat. Mater., 2005, 4, 435–446 CrossRef CAS PubMed.
- H. Dong, L.-D. Sun and C.-H. Yan, Nanoscale, 2013, 5, 5703–5714 RSC.
- V. Bachmann, C. Ronda and A. Meijerink, Chem. Mater., 2009, 21, 2077–2084 CrossRef CAS.
- J. Dhanaraj, R. Jagannathan, T. R. N. Kutty and C.-H. Lu, J. Phys. Chem. B, 2001, 105, 11098–11105 CrossRef CAS.
- J.-G. Li, X. Li, X. Sun and T. Ishigaki, J. Phys. Chem. C, 2008, 112, 11707–11716 CAS.
- C. Guo, L. Luan, C. Chen, D. Huang and Q. Su, Mater. Lett., 2008, 62, 600–602 CrossRef CAS.
- J. Kuang, Y. Liu and D. Yuan, Electrochem. Solid-State Lett., 2005, 8, H72–H74 CrossRef CAS.
- R. Yu, H. Noh, B. Moon, B. Choi, J. Jeong, K. Jang, S. Yi and J. Jang, J. Alloys Compd., 2013, 576, 236–241 CrossRef CAS.
- D. Zou, Y. Q. Ma, S. B. Qian, B. T. Huang, G. H. Zheng and Z. X. Dai, J. Alloys Compd., 2014, 584, 471–476 CrossRef CAS.
- L. Jia, Z. Shao, Q. Lü, Y. Tian and J. Han, Ceram. Int., 2014, 40, 739–743 CrossRef CAS.
- K. S. Sohn, Y. Y. Choi and H. D. Park, J. Electrochem. Soc., 2000, 147, 1988–1992 CrossRef CAS.
- X. Zhang, X. Zhang, Z. Zhao and J. Chauduhuri, J. Mater. Sci., 2015, 50, 251–257 CrossRef CAS.
- G. B. Chadeyron, M. E. Ghozzi, D. Boyer, R. Mahiou and J. C. Cousseins, J. Alloys Compd., 2001, 317, 183–185 CrossRef.
- J. T. Ingle, R. P. Sonekar, S. K. Omanwar, Y. Wang and L. Zhao, Combust. Sci. Technol., 2014, 186, 83–89 CrossRef CAS.
- A. B. Gawande, R. P. Sonekar and S. K. Omanwar, Combust. Sci. Technol., 2014, 186, 785–791 CrossRef CAS.
- K. Y. Jung, E. J. Kim and Y. C. Kang, J. Electrochem. Soc., 2004, 151, H69–H73 CrossRef CAS.
- N. Joffin, B. Caillier, A. Garcia, P. Guillot, J. Galy, A. Fernandes, R. Mauricot and J. D. Ghys, Opt. Mater., 2006, 28, 597–601 CrossRef CAS.
- G. Jia, P. A. Tanner, C. K. Duan and J. D. Ghys, J. Phys. Chem. C, 2010, 114, 2769–2775 CAS.
- K. Y. Jung and H. K. Jung, J. Lumin., 2010, 130, 1970–1974 CrossRef CAS.
- D. Boyer, G. B. Chadeyron, R. Mahiou, C. Caperaa and J. C. Cousseins, J. Mater. Chem., 1999, 9, 211–214 RSC.
- L. Lou, D. Boyer, G. B. Chadeyron, E. Bernstein, R. Mahiou and J. Mugnier, Opt. Mater., 2000, 15, 1–6 CrossRef CAS.
- Z. Wei, L. Sun, C. Liao, J. Yin, X. Jiang and C. Yan, J. Phys. Chem. B, 2002, 106, 10610–10617 CrossRef CAS.
- Z. G. Wei, L. D. Sun, C. S. Liao, X. C. Jiang, C. H. Yan, Y. Tao, X. Y. Hou and X. Ju, J. Appl. Phys., 2003, 93, 9783–9788 CrossRef CAS.
- D. Boyer, G. Bertrand and R. Mahiou, J. Lumin., 2003, 104, 229–237 CrossRef CAS.
- H. Zhu, L. Zhang, T. Zuo, X. Gu, Z. Wang, L. Zhu and K. Yao, Appl. Surf. Sci., 2008, 254, 6362–6365 CrossRef CAS.
- K. N. Kim, H. K. Jung, H. D. Park and D. Kim, J. Mater. Res., 2002, 17, 907–910 CrossRef CAS.
- X. C. Jiang, C. H. Yan, L. D. Sun, Z. G. Wei and C. S. Liao, J. Solid State Chem., 2003, 175, 245–251 CrossRef CAS.
- R. Sato, S. Takeshita, T. Isobe, T. Sawayama and S. Niikura, ECS J. Solid State Sci. Technol., 2012, 1, R163–R168 CrossRef CAS.
- A. Nohara, S. Takeshita and T. Isobe, RSC Adv., 2014, 4, 11219–11224 RSC.
- A. Nohara, S. Takeshita, Y. Iso and T. Isobe, J. Mater. Sci., 2016, 51, 3311–3317 CrossRef CAS.
- A. A. Setlur, Electrochem. Solid-State Lett., 012, 15, J25–J27 CrossRef.
- S. Sohal, M. Nazari, X. Zhang, E. Hassanzadeh, V. V. Kuryatkov, J. Chaudhuri, L. J. Hope-Weeks, J. Y. Huang and M. Holtz, J. Appl. Phys., 2014, 115, 183505 CrossRef.
- B. Lee, S. Lee, H. G. Jeong and K.-S. Sohn, ACS Comb. Sci., 2011, 13, 154–158 CrossRef CAS PubMed.
- K. H. Son, S. P. Singh and K.-S. Sohn, J. Mater. Chem., 2012, 17, 8505–8511 RSC.
- S. P. Singh, W. B. Park, C. Yoon, D. Kim and K.-S. Sohn, ECS J. Solid State Sci. Technol., 2016, 5, R3032–R3039 CrossRef CAS.
- W. B. Park, S. P. Singh, M. Kim and K.-S. Sohn, Inorg. Chem., 2015, 4, 1829–1840 CrossRef PubMed.
- J. W. Park, B. Y. Han, Y. S. Kim and K.-S. Sohn, J. Nanosci. Nanotechnol., 2013, 6, 3935–3958 Search PubMed.
- T. Chan, C. Kang, R. Liu, L. Chen, X. Liu, J. Ding, J. Bao and C. Gao, J. Comb. Chem., 2007, 9, 343–346 CrossRef CAS PubMed.
- X. Su, K. Zhang, Q. Liu, H. Zhong, Y. Shi and Y. Pan, ACS Comb. Sci., 2011, 13, 79–83 CrossRef CAS PubMed.
- B. Bender, C. Condra, R. J. Gould and T. M. Connolly, Thromb. Res., 1995, 77, 453–463 CrossRef.
- H. Wang and J. A. Joseph, Free Radical Biol. Med., 1999, 27, 612–616 CrossRef CAS PubMed.
- M. U. Kassack, B. Hofgan, J. Lehmann, N. Eckstein, J. M. Quillan and W. Sadee, J. Biomol. Screening, 2002, 7, 233–246 CAS.
- X. Zhao, X. Wang, B. Chen, W. Di, Q. Meng and Y. Yang, Proc. SPIE, 2006, 6030, 60300N CrossRef.
- X. Zhang, L. Zhou, Q. Pang and M. Gong, J. Am. Ceram. Soc., 2014, 97, 2124–2129 CrossRef CAS.
- X. Zhang, L. Zhou, Q. Pang and M. Gong, Opt. Mater., 2014, 36, 1112–1118 CrossRef CAS.
Footnotes |
| † Electronic supplementary information (ESI) available: XRD profiles, crystallite sizes, and actual metallic compositions of the samples taken from the libraries of Y1−x−yCexTbyBO3 (0 ≤ x ≤ 0.1, 0 ≤ y ≤ 0.4) (Fig. S1 and Table S1), Y1−x−y−zCexTbyEuzBO3 (0 ≤ x ≤ 0.05, 0 ≤ y ≤ 0.90, z = 0.05) (Fig. S2 and Table S2), and Y1−x−y−zCexTbyEuzBO3 (x = 0.005, 0 ≤ y ≤ 0.795, 0 ≤ z ≤ 0.20) (Fig. S3 and Table S3); PL spectra of Y0.845Ce0.005Tb0.15BO3 and Y0.82Ce0.005Tb0.15Eu0.025BO3 synthesized in the wells of a microplate (Fig. S4); PL and PLE spectra, and CIE coordinate with a color diagram of Y0.535Ce0.005Tb0.45Eu0.01BO3 (Fig. S5). See DOI: 10.1039/c7ra01356f |
| ‡ Research Institute for Chemical Process Technology, National Institute of Advanced Industrial Science and Technology (AIST), Tsukuba Central 5, 1-1-1 Higashi, Tsukuba, Ibaraki 305-8565, Japan E-mail: E-mail: s.takeshita@aist.go.jp. |
| This journal is © The Royal Society of Chemistry 2017 |

