 Open Access Article
Creative Commons Attribution 3.0 Unported Licence
Effect of melt and solution electrospinning on the formation and structure of poly(vinylidene fluoride) fibres†
Hanako Asai *,
Marina Kikuchi,
Naoki Shimada and
Koji Nakane
Frontier Fibre Technology and Science, Graduate School of Engineering, University of Fukui, 3-9-1 Bunkyo, Fukui, 910-8507, Japan. E-mail: h_asai@u-fukui.ac.jp
First published on 21st March 2017
Abstract
We investigated the effects of applied voltage and collector rotating speed on the crystal structure and piezoelectricity of poly(vinylidene fluoride) (PVDF) fibres obtained by two electrospinning (ES) systems; laser-melt electrospinning (M-ES) and conventional solution electrospinning (S-ES). A higher β phase fraction was observed in the S-ES fibres, although the M-ES fibres showed comparable crystallinity. The piezoelectric constant (d33) for the S-ES fibres was also higher than that of the M-ES fibres. This is the first report clarifying the difference between M-ES and S-ES for the formation of PVDF fibres.
1. Introduction
Poly(vinylidene fluoride) (PVDF) is known as a piezoelectric polymer and is widely used in sensors, electroacoustic and electromechanical transducers, etc.1,2 PVDF can form several types of crystal structures depending on the processing conditions.3 Among them, the β crystalline phase, where the dipoles point in the same directions, shows remarkable piezoelectricity.1 In order to obtain the β crystalline phase from a solution or melt states of PVDF, processes such as electrical poling and mechanical drawing are generally carried out.3Recently, electrospinning techniques have been investigated to fabricate piezoelectric materials. Because electrospinning can prepare nanofibres by applying a high voltage to a polymer solution or a polymer melt, one can easily obtain piezoelectric textiles without post poling processes. For example, near-field electrospinning techniques enable in situ mechanical stretching and electrical poling and could produce piezoelectric PVDF nanofibres with high energy conversion efficiency.4,5 In addition, some researchers used a rotating collector to add mechanical drawing to the electrospun nanofibres.5–7 Considering that energy harvesting textiles have attracted attention in the field of wearable electronics,8 it is worth studying the relationship between spinning conditions and piezoelectricity.
There are many parameters for electrospinning, such as applied voltage, feeding rate, spinning solution concentration, and nozzle-to-collector distance. Recently, Shao et al. studied the effect of electrospinning parameters and polymer concentration on the crystal structure and the piezoelectric behaviour of the PVDF nanofibre mat.9 However, to the best of our knowledge, all of the studied systems used solution electrospinning, and there has not been a report investigating the relationship between melt-electrospinning conditions and the piezoelectric properties. Here, as the relevant methods to melt-electrospinning, Lee et al.10 and Hadimani et al.11 reported an electric poling-assisted additive manufacturing (EPAM) process, and a continuous melt extrusion process with in-line poling, respectively. By using their processes, free-form shape or fibrous piezoelectric devices could be obtained. However, their processes could produce only sub-mm order filaments, and could not produce non-woven fabrics like electrospinning method. On the other hand, melt-electrospinning is one of the electrospinning techniques, where a polymer is melted or softened by heat and simultaneously spun by applying high electrostatic force, resulting in μm-order fibres. Here, some researchers reported the piezoelectricity of PVDF was improved by high temperature,12,13 while the others reported that the poling temperature was not as crucial parameter or high temperature was not proper.14,15 Considering these researches, it is still not clear whether the high temperature used in melt-electrospinning is suitable for fabricating piezoelectric fibre mats or not.
Ogata et al. developed a new type of melt-electrospinning technique equipped with a CO2 laser melting device.16 In this technique, a rod like polymer sample is locally heated with a spot like laser beam, and fibres can be prepared. This laser melt-electrospinning does not spend much energy compared to conventional melt-electrospinning and does not use any organic solvent. However, because it used a rod-shaped polymer and a spot laser beam, it could fabricate only one fibre per one-point laser irradiation, resulting in very low productivity. Then, Shimada et al. changed the laser shape from spot to linear and used sheet-formed polymer.17 By changing the laser and sample polymer shapes, they succeeded in making many Taylor corns, where the fibres were produced, and the productivity was significantly improved.
In this study, we systematically investigated the effect of spinning parameters on the piezoelectric properties of PVDF fibre prepared by linear laser melt electrospinning (M-ES) and obtained fundamental knowledge about the relationship between the properties, structures, and spinning conditions. In addition, we compared the results with conventional solution-electrospinning (S-ES).
2. Experimental
2.1 Materials
PVDF pellets were purchased from Sigma-Aldrich. The average molecular weight (Mw) of the PVDF was ∼180![[thin space (1/6-em)]](https://www.rsc.org/images/entities/char_2009.gif) 000 kg mol−1. N,N-Dimethylfolmamide (DMF) was purchased from Nacalai Tesque, inc. (Kyoto, Japan). All materials were used as received.
000 kg mol−1. N,N-Dimethylfolmamide (DMF) was purchased from Nacalai Tesque, inc. (Kyoto, Japan). All materials were used as received.
2.2 Melt electrospinning using a linear laser device
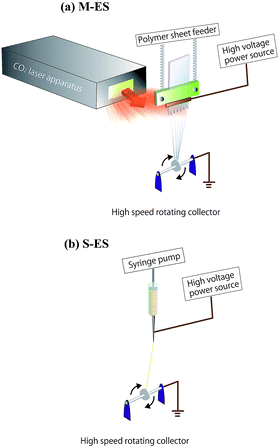
At first, PVDF pellets were heat-pressed at 190 °C with a 120 μm spacer under about 4.9 MPa of pressure and cooled down slowly with keeping the pressure. Thus, we obtained a ca. 116 μm thick PVDF sheet that was used for the following electrospinning. The schematic representation of the melt electrospinning device was shown in Fig. 1(a). The PVDF sheet was heated and melted by the laser beam, then drawn to the rotating collector by a drag force caused by a high voltage. The CO2 laser was generated from a spot like laser beam generator (Universal Laser System, ULR-50, wavelength = 10.6 μm). By using a custom-made optical system, we changed the shape of the laser beam from spot to linear form. The details of the optical system are explained in our previous report.17 The feed rate of the polymer sheet was 1 mm min−1. The sheet-collector distance was 3.5 cm. The diameter and width of the rotating collector were 7 cm and 7 mm, respectively.2.3 Solution electrospinning
The spinning solution was prepared by dissolving PVDF with DMF and acetone at 70 °C. The fraction of the two solvents was 1![[thin space (1/6-em)]](https://www.rsc.org/images/entities/char_2009.gif) :
:![[thin space (1/6-em)]](https://www.rsc.org/images/entities/char_2009.gif) 1 by weight. The solution concentration was fixed at 26 wt%. Fig. 1(b) shows the S-ES apparatus used in this study. The same rotating collector as in the M-ES was used. The spinning nozzle was 21 gauge with a 0.51 mm inner diameter. The applied voltage was −10 kV. All of the S-ES was carried out at a temperature and humidity ranging from 19 °C to 24 °C, and 19% to 26%, respectively. The feed rate was 0.6 mL h−1. The nozzle-collector distance was 3.5 cm, which was also the same as the case of M-ES.
1 by weight. The solution concentration was fixed at 26 wt%. Fig. 1(b) shows the S-ES apparatus used in this study. The same rotating collector as in the M-ES was used. The spinning nozzle was 21 gauge with a 0.51 mm inner diameter. The applied voltage was −10 kV. All of the S-ES was carried out at a temperature and humidity ranging from 19 °C to 24 °C, and 19% to 26%, respectively. The feed rate was 0.6 mL h−1. The nozzle-collector distance was 3.5 cm, which was also the same as the case of M-ES.
2.4 Measurements
The temperature of the PVDF sheet during the M-ES was monitored by using a thermographic camera (FSV-7000E, Apiste Corporation, Osaka, Japan) equipped with a custom-made filter to protect the apparatus from the laser beam.Differential scanning calorimetry (DSC) curves were measured using a calorimeter (DSC-60, Shimadzu Corporation, Kyoto, Japan), at 10 °C min−1 from 30 °C to 250 °C in air.
Scanning electron microscopy (SEM) observations were carried out by using a Keyence scanning electron microscope (VE-9800, Keyence Co. Ltd., Osaka, Japan). The fibre samples were gold-sputter coated with an ion coater (SC-701, Sanyu Electron Co., Ltd., Tokyo, Japan). The average and the standard deviation of the fibre diameters were determined from 100 measurements using an image J software. Mat-form samples where many fibres were piled up were used for SEM observations as well as in all of the following experiments.
Attenuated total reflectance Fourier transform infrared spectroscopy (ATR-FTIR) data were obtained at room temperature using an IR spectrometer (IR Affinity-1, Shimadzu Corporation, Kyoto, Japan) equipped with a single reflection ATR accessory (MIRacle 10, Shimadzu Corporation, Kyoto, Japan) containing a diamond/ZnSe crystal.
X-ray diffraction (XRD) measurements were carried out using an X-ray diffractometer (Ultima-IV, Rigaku Corporation, Tokyo, Japan), equipped with a sample holder for fibrous specimens. Cu Kα radiation (wavelength, 1.54 Å) operated at 40 kV and 20 mA was used, and the data were collected in the 2θ range from 10° to 40° at room temperature with the step angle of 0.05°.
Piezoelectric constant, d33, values were measured by using piezometer system (PM300, Piezotest Pte. Ltd., Singapore) at 110 Hz.
3. Results and discussion
3.1 Condition of PVDF sheet during M-ES process
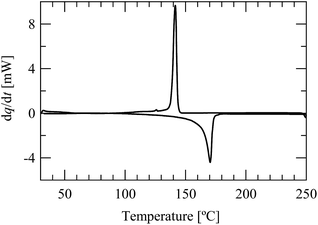
Fig. 2 shows the thermographic image of the PVDF sheet during laser beam irradiation at 53 W. The applied voltage was −10 kV. The heated region of the PVDF sheet is indicated in red. The average maximum temperature of the sheet was 156.7 ± 2.5 °C. Fig. 3 shows the results of DSC measurements of the PVDF sheet used for the M-ES. The melting point determined by DSC was ca. 170.5 °C. Therefore, it was found that the fibres prepared by M-ES were spun below the melting temperature by strong electrostatic force.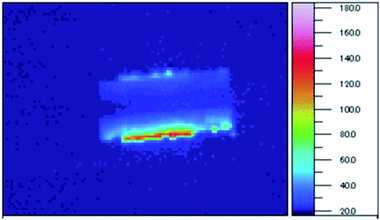 | ||
| Fig. 2 Thermographic image of the PVDF sheet during laser beam irradiation of M-ES at 53 W. The applied voltage was −10 kV. Temperature from 20 °C to 180 °C is represented by the colour difference. | ||
3.2 Effect of the spinning condition on the fibre structure
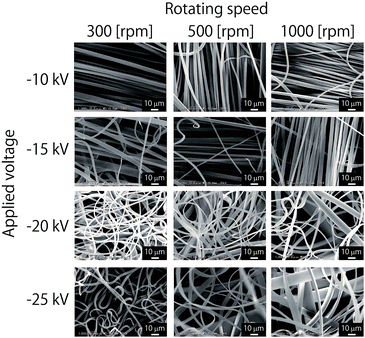
Fig. 4 summarises the SEM images of the PVDF fibre mats prepared by M-ES at different applied voltages and collector rotating speeds. The laser output power was fixed at 53 W. Here, an electrospinning process was generally carried out at positive applied voltage, but we obtained only burnt fibres at positive voltage. Considering that PVDF is triboelectrically highly negative,18 it may be that the PVDF sheet was only slightly positively charged even at a positive applied voltage, and thus the electrostatic drawing force was not generated between the collector and the PVDF sheet, resulting in the overheating of the PVDF. Therefore, all of our experiments were carried out at negative applied voltage.As the applied voltage was negatively increased, the orientation of the spun fibres became random, indicating that the insufficient neutralization of the charge of the fibres caused electrostatic repulsion. In addition, too high applied voltage and rotating speed made fibres get drawn from the PVDF sheet before it was sufficiently melted, causing ribbon-like flat fibres (−25 kV, 1000 rpm, in Fig. 4).
The corresponding results of S-ES are shown in Fig. 5. As you can see, the diameter of the fibres was smaller than in the case of M-ES, and the orientation of the fibres was achieved at higher rotating speeds. The fibre diameters obtained from the SEM photographs are summarised in Fig. 6. In the case of M-ES, the average diameter of fibres spun at −10 kV and 1000 rpm was 4.2 ± 3.4 μm, while the S-ES fibre had an average diameter of 0.58 ± 0.14 μm under the same spinning conditions. The reason for the smaller diameters of S-ES fibres can be attributed to the different spinning mechanisms between these two spinning systems: in the case of M-ES, polymer sheet softened by the laser irradiation is drawn to the collector by electrostatic force, and fibres are obtained. On the other hand, in the case of S-ES, polymer solution is ejected from a spinning nozzle. The solvent of the ejected solution gradually evaporates during the spinning process, and only the remained polymer component forms fibres, resulting in the formation of finer fibres than the case of M-ES.
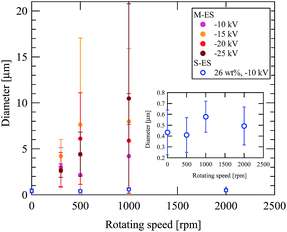 | ||
| Fig. 6 Variation of the diameters of the M-ES and S-ES fibres as a function of applied voltage and rotating speed. The inset shows the magnified figure for S-ES fibres. | ||
The fibre diameter of M-ES tended to increase with increasing rotating speed. This can also be attributed to the strong drawing caused by the higher rotating speed before sufficient heating of the sheet, and agrees with the thermography, and DSC results. The large errors of the M-ES fibres came from the wide distributions of the diameters as shown in the histograms (Fig. S1†). On the other hand, the fibre diameters of the S-ES fibres were not affected by the rotating speed, and its diameter distributions were narrower than the case of M-ES (Fig. S2†). This may be due to the stable spinning for S-ES.
3.3 Effect of spinning conditions on the crystal structure
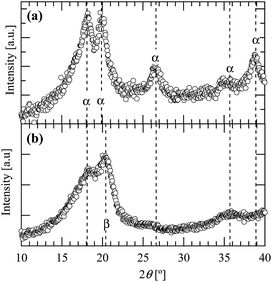
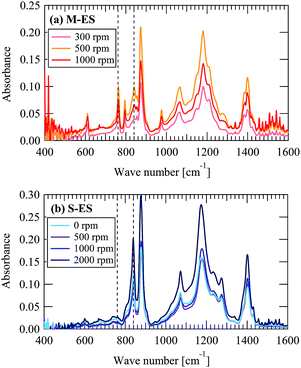
Fig. 7 shows the XRD spectra for the (a) M-ES and (b) S-ES fibre mats spun at 500 rpm and −10 kV after subtracting background data. According to the peak positions summarized by Jurczuk et al.,19 we assigned the peak positions for α and β phase, indicated by dashed lines in Fig. 7. As shown in these figures, the fibres spun by M-ES contained more α phase, while those spun by S-ES were rich in β phase, though they showed small peaks assigned to α phases at 18.1°, 26.6° and 35.7°.In addition, we compared the crystal structure of the fibres obtained from M-ES and S-ES. Fig. 8 shows the ATR-FTIR spectra for (a) M-ES and (b) S-ES at various rotating speeds. The applied voltage was −10 kV for both spinning systems. In the reference, peaks at 761 cm−1, 877 cm−1, and 976 cm−1 are assigned to α phase.9 They correspond to CH2 in-plane bending or rocking, CH2 out-of-plane bending or rocking, and CH2 twisting, respectively.9 Peaks at 840 cm−1 and 1274 cm−1 are attributed to β phase.9 They correspond to CH2 rocking/CF2 asymmetrical stretching and C–F stretching vibrations, respectively.
Here, in our ATR-FTIR data, both M-ES and S-ES fibres showed the above three peaks corresponding to α phase, as well as the two peaks for β phase. However, for M-ES fibres, the β phase peaks were smaller comparing with the case of S-ES. For S-ES fibres, α phase peaks at 761 cm−1 and 976 cm−1 were very small. These results indicates that M-ES samples were α phase rich, while S-ES samples were β phase rich, and are consistent with XRD results (Fig. 7).
From these spectra, we evaluated the fraction of β phase crystal, F(β) by using the following equation:
 | (1) |
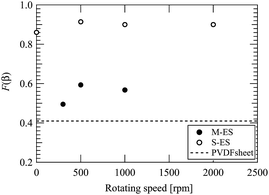 | ||
| Fig. 9 Variation of F(β) values for the fibres spun by M-ES and S-ES, as a function of the rotating speed. The applied voltage was fixed at −10 kV. | ||
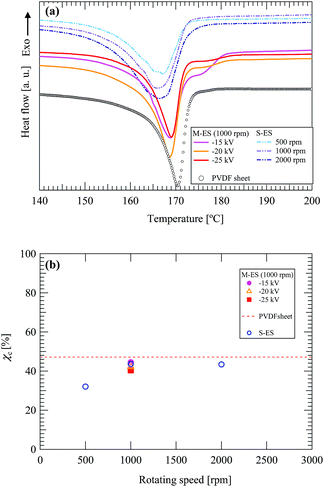
Furthermore, we performed DSC measurements and evaluated crystallinity (χc) from χc [%] = ΔH/ΔH* × 100, where ΔH and ΔH* means the heat of fusion obtained from DSC measurement and that for perfect crystal, respectively. We used 104.7 J g−1 for ΔH* value.23 Fig. 10(a) shows the DSC thermograms for M-ES and S-ES fibres during heating process. The evaluated χc values are summarized in Fig. 10(b). It was found that the χc value was about 40%, irrespective of the spinning methods and the applied voltage for M-ES, as well as the rotating speed for S-ES. Here, Gheibi et al. reported the crystallinity was 65% in the case of S-ES nanofiber.23 The lower χc values of our S-ES fibres might be due to the rather short nozzle-to-collector distance (i.e. 3.5 cm) used in this study. We chose this short distance to match the experimental condition with M-ES.
As shown in Fig. 10(a), the M-ES fibres showed large melting peak at 169 °C and small one around 175 °C. On the other hand, the S-ES fibres showed relatively broad single peak around 166 °C. The PVDF sheet showed a single peak at 170.5 °C. Here, as for the assignments of the peaks, there are contradictory references: some researchers mentioned that the peak at higher temperature corresponds to β phase,14,21,24 while the others described it indicates α phase.22,23,25 However, considering our XRD and FT-IR data, we assigned the larger peak of M-ES as the α phase, and the broad peak of S-ES as β phase.22,23,25 The small peak of M-ES fibres was assigned as γ phase.22
From these data, we conjectured that α phase was dominant in the PVDF sheet. The M-ES fibre might contain not only α and β phases, but also γ phase, which is an intermediate phase between α and β phases.19 The mixture of β phase in the M-ES fibres might cause the α phase peak to shift to lower temperature than that in PVDF sheet. However, the existence of γ phase in the M-ES fibre could not be confirmed in the ATR-FTIR data, where two peaks should be observed at 812 and 882 cm−1.21 This might be because the amount of γ phase was too small to detect by ATR-FTIR. For the S-ES fibres, the broad β phase peak might come from the existence of α phase.
From the XRD, ATR-FTIR, and DSC measurements, it was found that the crystallinity of the M-ES fibres were comparable with those obtained by S-ES, but the S-ES fibres had much more β phase, which induces piezoelectricity.
3.4 Effect of spinning conditions on the piezoelectric properties
Finally, we compared the d33 values of the fibres prepared by M-ES and S-ES. Fig. 11 shows the evaluated d33 values as a function of the rotating collector speed. The S-ES fibre mat shows higher d33 values, corresponding to the results for the F(β). The obtained d33 values were much smaller, comparing with those of a bulk PVDF film,26 a PVDF nanowire,27 or a fibre.28 This might be because the porosity of the sample was too high for the measurement system used in this study, considering that the d33 values of PVDF sheet measured in this study was 0.30 ± 0.19 pC/N.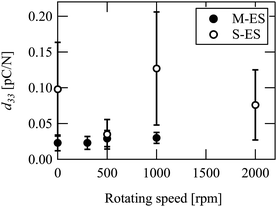 | ||
| Fig. 11 Variation of d33 values for the fibre mats obtained by M-ES and S-ES as a function of rotating speed. The applied voltage was −10 kV. | ||
From these experiments, it was found that in the case of M-ES, after-treatment such as drawing may be necessary to obtain β phase rich fibres. On the other hand, for the S-ES case, the longer nozzle-to-collector distance, which can elongates the polymer chains more, may enhance the crystallization and the formation of β phase.
4. Conclusions
We studied the influence of the spinning conditions on the structure and piezoelectricity of the PVDF fibres spun by a linear laser-melt electrospinning process, and compared the results with the corresponding conventional solution-electrospinning process. The rotating speed of a collector and applied voltage only affected the fibre structure and did not strongly influence the crystal structure of the fibres obtained by M-ES. XRD and ATR-FTIR measurements revealed that crystal structure of M-ES fibres was mainly α phase, whereas the S-ES fibres showed higher β phase fraction. From DSC measurements, it was found that the crystallinity of M-ES fibres was comparable with that of S-ES.References
- G. M. Sessler, J. Acoust. Soc. Am., 1981, 70, 1596 CrossRef CAS.
- S. B. Lang and S. Muensit, Appl. Phys. A, 2006, 85, 125–134 CrossRef CAS.
- K. Tashiro, H. Tadokoro and M. Kobayashi, Ferroelectrics, 1981, 32, 167–175 CrossRef CAS.
- C. Chang, V. H. Tran, J. Wang, Y. K. Fuh and L. Lin, Nano Lett., 2010, 10, 726–731 CrossRef CAS PubMed.
- Z. H. Liu, C. T. Pan, C. K. Yen, L. W. Lin, J. C. Huang and C. A. Ke, Appl. Surf. Sci., 2015, 346, 291–301 CrossRef CAS.
- D. Mandal, S. Yoon and K. J. Kim, Macromol. Rapid Commun., 2011, 32, 831–837 CrossRef CAS PubMed.
- T. Lei, L. Yu, G. Zheng, L. Wang, D. Wu and D. Sun, J. Mater. Sci., 2015, 50, 4342–4347 CrossRef CAS.
- T. Huang, C. Wang, H. Yu, H. Wang, Q. Zhang and M. Zhu, Nano Energy, 2015, 14, 226–235 CrossRef CAS.
- H. Shao, J. Fang, H. Wang and T. Lin, RSC Adv., 2015, 5, 14345–14350 RSC.
- C. Lee and J. A. Tarbutton, Smart Mater. Struct., 2014, 23, 095044 CrossRef.
- R. L. Hadimani, D. V. Bayramol, N. Sion, T. Shah, L. Qian, S. Shi and E. Siores, Smart Mater. Struct., 2013, 22, 075017 CrossRef.
- T. Hattori, M. Kanaoka and H. Ohigashi, J. Appl. Phys., 1996, 79, 2016–2022 CrossRef CAS.
- A. Hartono, S. Satira, M. Djamal, Ramli and E. Sanjaya, AIP Conf. Proc., 2015, 1656, 030018 CrossRef.
- A. Salimi and A. A. Yousefi, Polym. Test., 2003, 22, 699–704 CrossRef CAS.
- E. Nilsson, A. Lund, C. Jonasson, C. Johansson and B. Hagstrom, Sens. Actuators, A, 2013, 201, 477–486 CrossRef CAS.
- N. Ogata, S. Yamaguchi, N. Shimada, G. Lu, T. Iwata, K. Nakane and T. Ogihara, J. Appl. Polym. Sci., 2007, 104, 1640–1645 CrossRef CAS.
- N. Shimada, H. Tsutsumi, K. Nakane, T. Ogihara and N. Ogata, J. Appl. Polym. Sci., 2010, 116, 2998–3004 CAS.
- Y. Zheng, L. Cheng, M. Yuan, Z. Wang, L. Zhang, Y. Qin and T. Jing, Nanoscale, 2014, 6, 7842–7846 RSC.
- K. Jurczuk, A. Galeski, M. Mackey, A. Hiltner and E. Baer, Colloid Polym. Sci., 2015, 293, 1289–1297 CAS.
- J. R. Gregorio and M. Cestari, J. Polym. Sci., Part B: Polym. Phys., 1994, 32, 859–870 CrossRef.
- J. S. Andrew and D. R. Clarke, Langmuir, 2008, 24, 670–672 CrossRef CAS PubMed.
- C. M. Wu and M. H. Chou, Compos. Sci. Technol., 2016, 127, 127–133 CrossRef CAS.
- A. Gheibi, M. Latifi, A. A. Merati and R. Bagherzadeh, J. Polym. Res., 2014, 21, 469 CrossRef.
- M. Wu, H. X. Huang and J. Tong, Mater. Des., 2016, 108, 761–768 CrossRef CAS.
- S. S. Choi, Y. S. Lee, C. W. Joo, S. G. Lee, J. K. Park and K. S. Han, Electrochim. Acta, 2004, 50, 339–343 CrossRef CAS.
- Y. Ting, Suprapto, A. Nugraha, C.-W. Chiu and H. Gunawan, Sens. Actuators, A, 2016, 250, 129–137 CrossRef CAS.
- V. Cauda, S. Stassi, K. Bejtka and G. Canavese, ACS Appl. Mater. Interfaces, 2013, 5, 6430–6437 CAS.
- J. Pu, X. Yan, Y. Jiang, C. Chang and L. Lin, Sens. Actuators, A, 2010, 164, 131–136 CrossRef CAS.
Footnote |
| † Electronic supplementary information (ESI) available: Histograms for the diameters of M-ES and S-ES fibres. See DOI: 10.1039/c7ra01299c |
| This journal is © The Royal Society of Chemistry 2017 |

