DOI:
10.1039/C7RA01286A
(Paper)
RSC Adv., 2017,
7, 21518-21530
Experimental and theoretical studies on efficient carbon dioxide capture using novel bis(3-aminopropyl)amine (APA)-activated aqueous 2-amino-2-methyl-1-propanol (AMP) solutions†
Received
31st January 2017
, Accepted 1st April 2017
First published on 18th April 2017
Abstract
The present study investigates the absorption of CO2, into novel bis(3-aminopropyl)amine (APA)-activated aqueous solutions of 2-amino-2-methyl-1-propanol (AMP), using a wetted-wall column absorber. The physicochemical and transport properties of these solvents were measured over a temperature (T) range of 298–323 K and a partial pressure (pCO2) range of 5–15 kPa. APA is used as an activator with molar concentration varying from 0 to 1.1 kmol m−3 while maintaining the total (APA + AMP) concentration to 3.0 kmol m−3. Details on uncertainty analysis of property measurements are provided in order to analyse the kinetics data. The effect of thermodynamic properties on liquid–liquid interactions are discussed and assessed. Following the reaction mechanism of primary and secondary amines with CO2, the reaction mechanism of aqueous APA was described by the zwitterion mechanism. Based on this mechanism, the overall reaction scheme for (APA + AMP + H2O)–CO2 system was established. According to the pseudo-first-order condition, the reaction rate parameters were estimated for the (APA + AMP + H2O)–CO2 system from the kinetics measurement. A substantial enhancement of the reaction rate in comparison to the single AMP solution was observed upon the addition of a small amount of APA to the blend. Furthermore, it was prominent from the parity plot that the model fitted and experimental rate data were in close agreement with each other.
1. Introduction
Globally, the capture of anthropogenic CO2 from power plants and other industrial sources has become a critical environmental concern because CO2 is the root cause of global warming.1–4 However, the threat of climate change from the large quantities of greenhouse gases (GHG), such as CO2, CH4 and N2O in the atmosphere, is significant. The energy-related global CO2 emissions will keep on growing from 31.3 gt in 2011 to 45 gt in 2035 as per the report of the International Energy Agency (2012). Therefore, the average global temperature is expected to rise from 1.8 °C to 5.6 °C, and there is only a 50% probability that this effect will significantly contribute to an increase in the CO2 emissions.5 Hence, persistent attempts of stabilizing GHG concentrations at a target of 450 ppm CO2-e (carbon dioxide equivalent)6 are essential. There are various techniques to control CO2 in the atmosphere. Cryogenic separation, biological and membrane-based separations are used to capture CO2,7 but these methods are not feasible to handle the bulk quantities of CO2 emitted. Apart from this, cryogenic separation is cost intensive, and other two methodologies are in their nascent stage. Therefore, techniques that are most promising for CO2 control include absorption and adsorption.8 Different industries like natural and synthesis gas processing plants, coal-based power plants, and cement plants have proven the potential of the absorption-based technique.9
Monoethanolamine (MEA) is used most frequently as an absorbent for CO2 removal on an industrial scale due to its high reactivity with CO2, its low cost and the CO2 capture ability from the low-pressure flue gas.10,11 However, MEA reduces the power station efficiency considerably due to its significant energy demand for solvent regeneration.12 In an amine-based post-combustion carbon capture (PCC) system at 90% CO2 recovery, more than half of the overall energy requirement accounts for solvent regeneration. In addition to this, the stoichiometric CO2 loading capacity of MEA is 0.5 mole CO2 per mole of amine. Increased volatility and the high rate of degradation, i.e. degradation product, can be an environmental issue, and dealing with these issues can increase the overall cost. The large size of the stainless steel absorber and stripping columns and solvent regeneration contributes 70% to the overall capital cost of the MEA-based PCC process.12,13 Thus, the higher cost of CO2 capture from power plant flue gas reduces the motivation of up-scaling in the MEA-based PCC process.
Out of various solvents used in regenerative chemical absorption processes, interest has recently grown towards activated alkanolamine absorbents where a small amount of rate activator is employed in the alkanolamine solution to significantly increase the reaction rate of CO2. For example, piperazine (PZ) activated N-methyldiethanolamine (MDEA) solutions could combine the high reaction rate of CO2 with PZ and the high CO2 loading capacity of MDEA. Moreover, the activated solvent requires a relatively small cost for regeneration.14,15 The sterically hindered form of the primary amine16i.e. AMP absorbs CO2 more slowly than MEA, whereas its theoretical cyclic CO2 capacity is twice that of MEA. AMP is more resistant to thermal degradation than MEA, and oxidative degradation for AMP is two orders of magnitude slower than that of MEA.9,17 No degradation product of AMP was observed after heating for 14 days at 403 K (Barzagli et al.18). Pei et al.19 reported that some heat-stable salt (HSS) formation could result in the decrease of the CO2 absorption capacity and regeneration efficiency. Their results show easier regeneration of AMP with less loss of absorption capacity than MEA, diethanolamine (DEA) and MDEA. They have also reported that the order of CO2 stripping performance is as follows: AMP > MDEA > DEA > MEA.
The state-of-the-art process uses 15–30 wt% AMP for CO2 capture, with slower CO2–amine mass transfer rates than those of MEA.20–22 The bis(3-aminopropyl)amine (APA), wherein a single molecule contains two primary amine groups and one secondary amine group, is proposed in this study as a novel activator for CO2 capture. Since the pKa value of APA (10.85) is higher than that of PZ (9.73) along with the relationship of cyclic and noncyclic amines with amine protonation constant,13 high reaction rates are expected for (APA + H2O)–CO2 system than those for (PZ + H2O)–CO2. Hence, the addition of a small quantity of rate activator, i.e. APA to the alkanolamine solvent, could activate the AMP by increasing the chemical reaction and hence the mass transfer rate significantly. It will provide more flexibility and give better performance than that with MEA or AMP alone. Furthermore, it may fulfil the requirement of a lower capital cost.23
In the present study, the specific rate of CO2 absorption into a new aqueous blend solution containing APA and AMP as well as the physicochemical properties over a wide range of temperature and CO2 partial pressure, were measured. The molar concentration of blends was kept at 3.0 kmol m−3, whereas APA concentration was varied from 0 to 0.5 kmol m−3. The importance of thermodynamic properties of the new amine based solvent on both technical (thermodynamic model) and economical considerations3 are assessed, and the role of these on the ternary liquid mixture are discussed. Several models, as developed in our earlier study, were introduced to implement the measured physicochemical properties. Uncertainty analysis was carried out with a 95% level of confidence to interpret all the measured physicochemical and transport properties. The kinetics rate parameters were calculated based on the pseudo-first order condition from the reaction rate experiment at every condition.
2. Theory
2.1. Reaction scheme
The reactions of CO2 into an aqueous amine blend solution of sterically hindered amine, AMP and rate activator APA are reversible in nature. The reactions of CO2–(AMP + APA + H2O) systems are described elsewhere (ESI, Table S1†).
2.2. Reaction mechanism
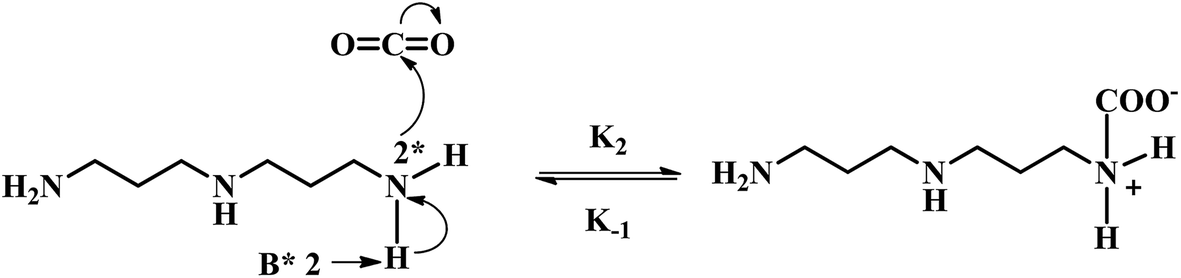
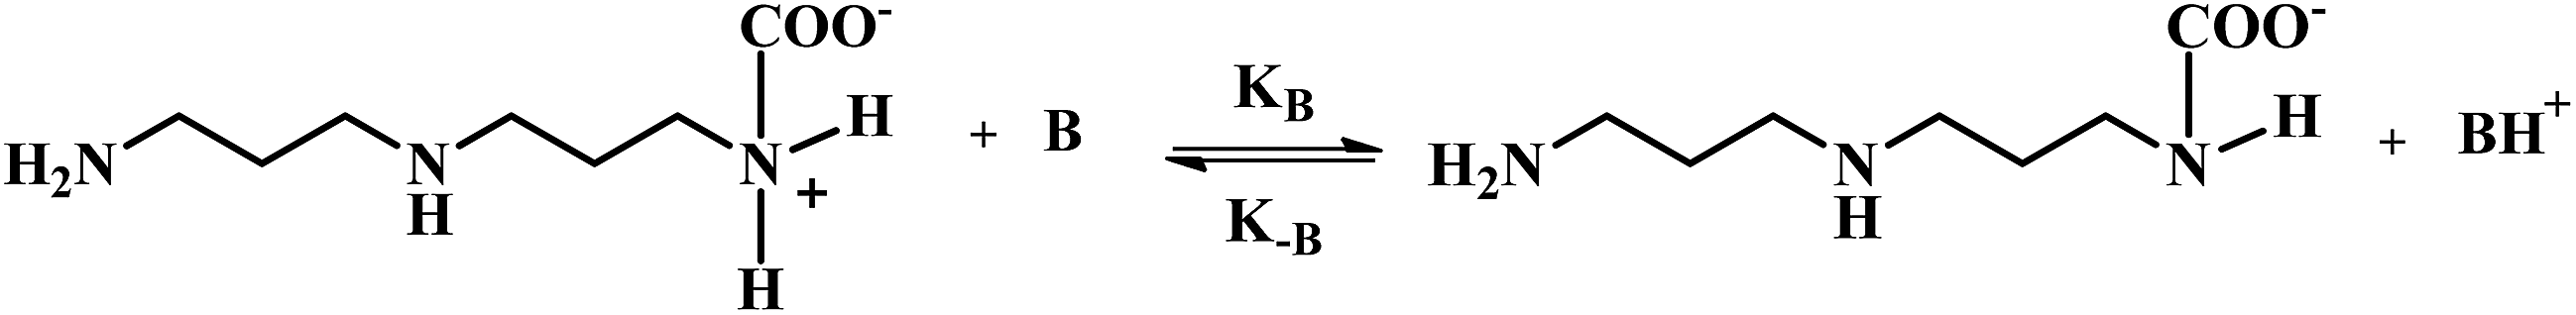
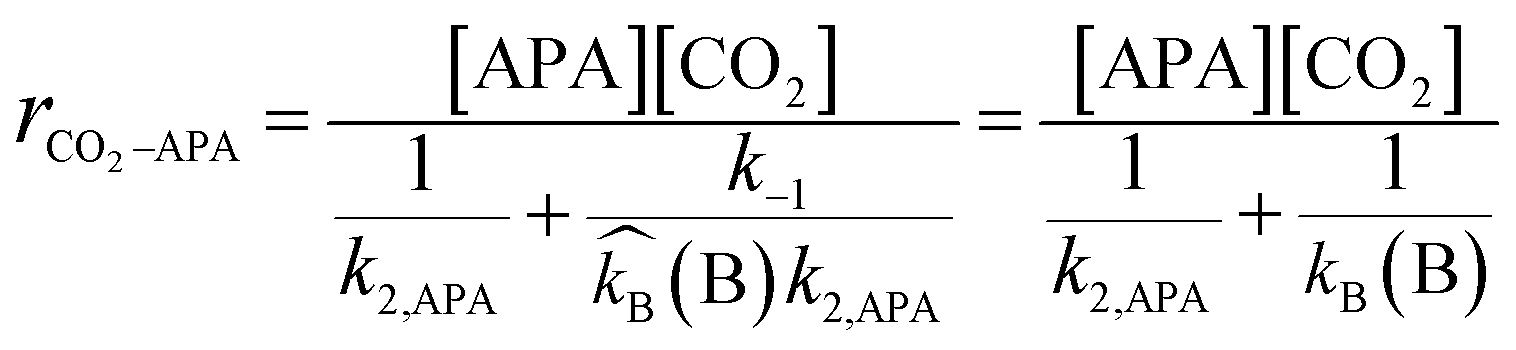
In the case of a sterically hindered amine such as AMP, the only significant reaction of CO2 with AMP is suggested to be the hydration of CO2 catalyzed by AMP, which forms the bicarbonate ion.21,24 However, because of the very small carbamate stability constant of AMP, the formation of carbamate is much lower in comparison to that of the bicarbonate ion.9,20 Hence, it can also be neglected. Therefore, literature suggests that the reaction of CO2 with AMP is similar to the CO2 and MDEA reaction. The anticipated reaction mechanism between CO2 and APA consists of mainly two steps: one is the formation of the zwitterion and other is the base (AMP, APA, APACOO−) catalyzed deprotonation of the zwitterion to form APA-monocarbamate, APA-dicarbamate and protonated base. As described by the zwitterion mechanism, which was initially proposed by Caplow et al.25 and reintroduced by Danckwerts et al.,26 the deprotonation of the zwitterion can occur by any base present in the solution. The presence of significantly more AMP in solution catalyzes the reaction between CO2 and APA to produce a carbamate and the deprotonation of AMP dominates. The reaction mechanism of APA with CO2 is illustrated below:
Two lone electrons present at nitrogen and at base atom in above mechanism are denoted as ‘*2’, where k2, k−1, and kB are second order rate constant, zwitterion mechanism rate constant and zwitterion mechanism deprotonation rate constant, respectively.
According to the zwitterion mechanism, the rate equation under steady state condition can be expressed as follows:
| |  | (1) |
herein, the kinetic constant

represents a combination of bases, whereas
.
Two asymptotic situations exist for the above rate equation.
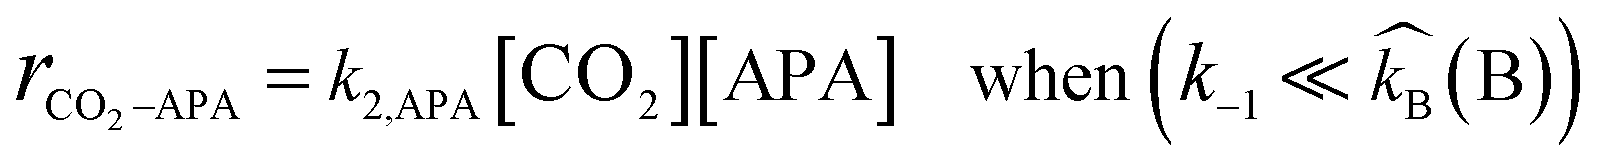
Case I.
When the deprotonation reaction is very high in comparison to the reverse reaction and the rate determining step is zwitterion formation, the kinetics rate expression becomes simple second order kinetics as given below:| | 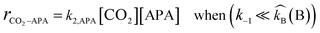 | (2) |
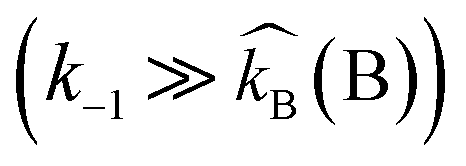
Case II.
The opposite condition i.e. when  and zwitterion deprotonation is rate-determining, then the rate equation becomes:
| | 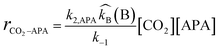 | (3) |
This expression is suggested for the shift in reaction order between one and two with respect to amine concentration since the contribution of the individual bases to deprotonate the zwitterions is considered to estimate the reaction order.
As discussed in the introductory section, the pKa value of APA is higher than that of PZ, and high deprotonation rates are expected for (APA + H2O)–CO2 system. Therefore, the kinetics rate expression for this system is assumed to follow the Case I situation. The rate-determining step of APA should be zwitterion formation, whereas only proton transfer occurs for the deprotonation steps and these steps are considered to be very fast. Even though hydration of CO2 occurs during the reaction, the contribution of the rate constant to the overall reaction rate is very little (k = 0.026 s−1 at 298 K),15 and it has been neglected in this study. Moreover, the bicarbonate reaction contribution to the overall reaction is insignificant.
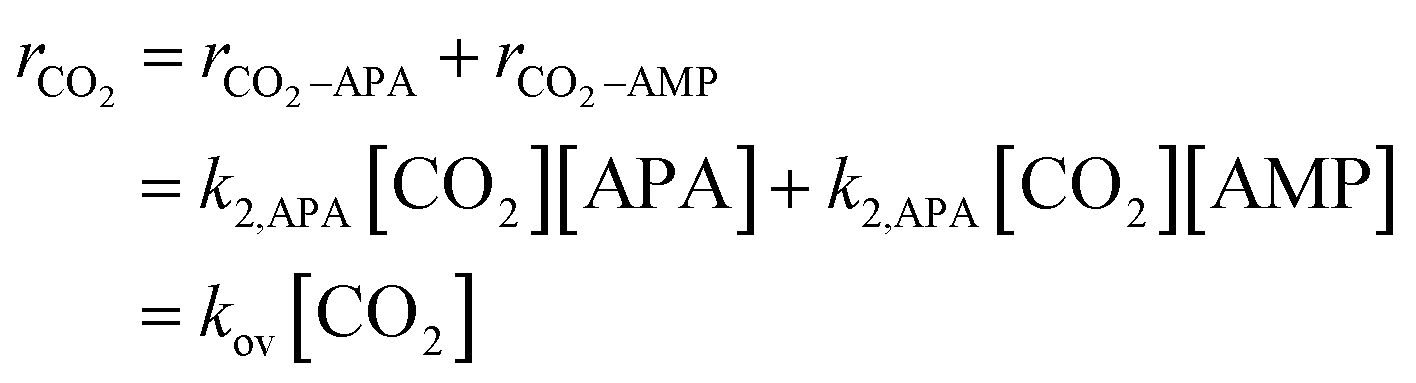
2.3. Reaction rate for CO2 in (AMP + APA + H2O)
The reaction between CO2 and sterically hindered alkanolamine and AMP, is a second-order reaction as reported in several studies.21,27 Therefore, the absorption rate of CO2 with AMP can be represented as follows:| | | rCO2–AMP = k2,AMP[CO2][AMP] = kov-AMP[CO2] | (4) |
As described by the zwitterion mechanism, the rate-determining step of APA should be zwitterion formation. Then, the governing equation for the reaction rate of CO2 into APA can be written as follows:
| | | rCO2–APA = k2,APA[CO2][APA] | (5) |
Thus, the overall reaction rate of CO2 in (AMP + APA + H2O) is as follows:
| | 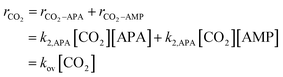 | (6) |
where,
kov denotes an overall rate constant and is represented as follows:
| kov = k2,APA[APA] + k2,AMP[AMP] |
3. Mass transfer
The absorption flux is enhanced by the chemical reaction in the bulk liquid when the absorption of gas occurs in a lean chemical solvent, and the governing equation is presented as follows:where EA is the enhancement factor and kL is the liquid side mass transfer coefficient. EA is related to the absorption rate in the presence of a chemical reaction and in the absence of a chemical reaction. This enhancement factor is considered to be an essential element because this single term incorporates all of the chemical reaction's possible effect on the absorption rate. For certain reaction regimes, the enhancement factor estimation from the various mass transfer models was available in literature.28
It is worth mentioning that when the gas phase mass transfer is negligible and CO2 content of the liquid phase is zero, only eqn (7) is valid.
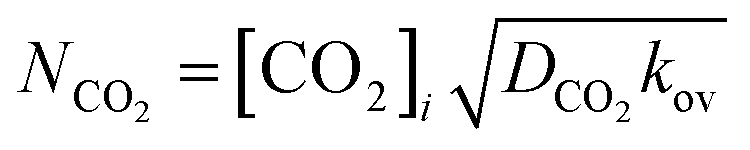
Doraiswamy et al.29 presented the specific rate of mass transfer of CO2 as follows:
| | 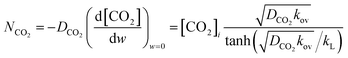 | (8) |
herein, [CO
2]
i denotes CO
2 interfacial concentration.
DCO2 and
kL denotes the diffusivity of CO
2 and liquid phase mass transfer coefficient, respectively.
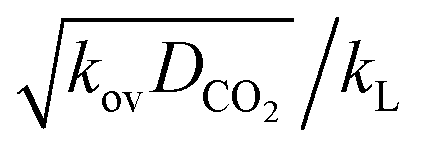
Absorption experiments were carried out in such a way that the reaction regime is considered to be the pseudo-first-order reaction regime. In this regard, the absorption condition was selected accordingly for the CO2 in (AMP–APA–H2O) systems. In this regime a linear relationship can be observed between the flux vs. CO2 partial pressure. In eqn (8), if  term is greater than three, then
  is equal to one, and the enhancement factor can be presumed to be a dimensionless Hatta number with
| |  | (9) |
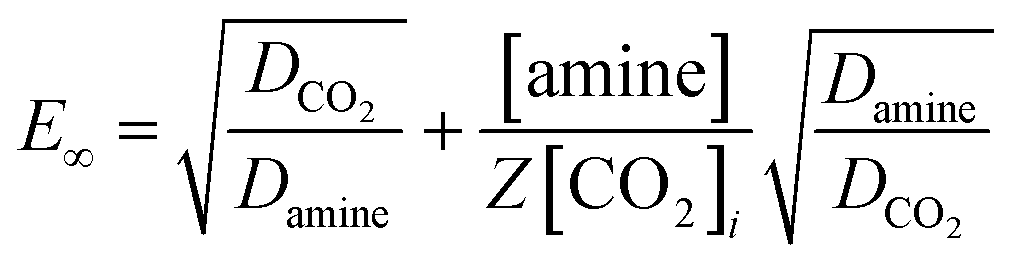
Moreover, in the pseudo-first-order reaction regime, the condition (3 < Ha ≪ E∞) must be fulfilled for the reliable assessment of the reaction rate constant. Herein, the infinite enhancement factor is presented below as follows:
| |  | (10) |
where and
Z are the diffusivity of amine and stoichiometric coefficient, respectively.
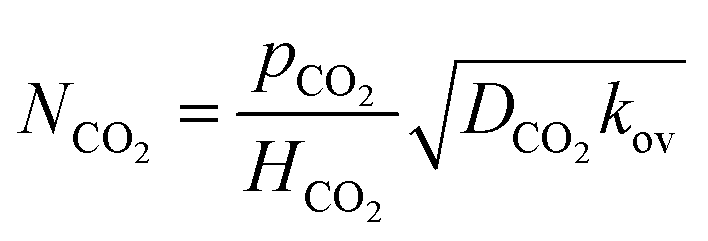
The specific rate of mass transfer using eqn (7) and (9) becomes
| |  | (11) |
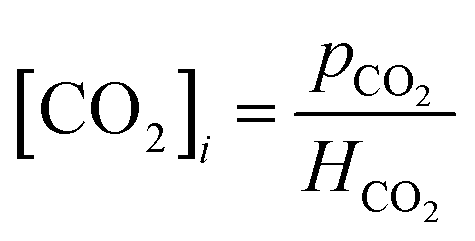
The interfacial concentration of CO2 can be obtained from Henry's law as follows:
| |  | (12) |
Using eqn (11), eqn (12) becomes
| |  | (13) |
Hence, eqn (13) was used to interpret the measured absorption kinetic data. From this kinetics study, the overall reaction kinetics rate constant, kov, can also be estimated with the values of HCO2 and DCO2 for CO2 in the amine solution.
4. Experimental
4.1. Materials
Reagent-grade APA (98% purity) and AMP (97% purity) were purchased from Sigma-Aldrich (USA) and E. Merck (Germany), respectively. These chemicals were used without any further purification. The CO2 gas had a purity of 99.995%. On the other hand, Assam Air Products (India) provided zero grade N2O gas for measurement of diffusivity and solubility. Similarly, Vadilal Gases Limited (India) supplied calibrated CO2 and N2 gas mixtures for the absorption kinetic experiments. Water degassing was carried out before the use of amine solution through boiling, followed by cooling under vacuum conditions. A quality control step was carried out to estimate the actual concentration of the amine solutions – this involved an acid–base titration against standard HCl using an auto-titrator (DL-50, Mettler Toledo, Switzerland). The uncertainty for the determination of amine concentrations was found to be 0.01%. Concentrated HCl with appropriate dilution was used for cell desorption, as well as for titration purposes.
4.2. Physicochemical properties measurement
The density measurement was carried out for aqueous (APA + AMP) solutions in a Pyrex England pycnometer (Sigma-Aldrich) of volume 34.73 × 10⁻⁶ m3, and an Ostwald viscometer (Model: 11619/01, Stanhope-seta, UK) was used to measure the viscosity at six different concentrations and temperatures. The validity of the procedure and apparatus utilized for these experiments were same as those discussed elsewhere.30 In this case, the combined expanded uncertainty for density and viscosity measurements was 3.97 kg m−3 and 0.058 mPas, respectively.
The glass equilibrium absorption cell was used to estimate the physical solubility of CO2 in aqueous (APA + AMP) solutions at constant temperature and pressure. A precise manometric device was used throughout each experimental run to maintain ambient pressure in the cell. The physical solubility of CO2 was estimated through N2O analogy.31 The same procedures for physical solubility measurements were followed as explained by Das et al.30 The reproducibility among the various experiments was observed and found to be less than ±1.0%. In this case, the combined expanded uncertainty for the determination of Henry's constant was estimated to be 66.5 kPa m3 kmol−1.
A wetted-wall column absorber was employed to study the diffusivity of N2O in aqueous blend (APA + AMP) solutions. The absorption surface length during the experiment was 7 × 10⁻² m. In the diffusivity experiment, the saturated gas was stored using a jacketed glass soap film storage device, and thermostated water controlled the temperature of the gas phase and the liquid film. The apparatus and procedure used herein were the same as those discussed in our recent publication.30 The values of reproducibility between the various experiments were calculated and found to be within ±1%. In this case, the combined expanded uncertainty was found to be 1.93 × 10⁻¹¹ m2 s−1.
4.3. Measurement of CO2 absorption rate
A wetted-wall column contactor15,32,33 consisting of three concentric stainless steel tubes was used to determine the reaction rate of CO2 into aqueous solutions of (APA + AMP). The outside diameter of the wetted-wall contactor was 2.81 × 10⁻² m. The outer surface of the tube provides an interfacial area for capturing the solute gas. Throughout the research, the length of the column was adjusted manually at a length of 7 × 10⁻² m. In this absorption study, a jacketed glass shroud formed the gas phase enclosure, which consisted of a gas inlet at the top and three equally shroud gas outlets at the bottom. A water circulating temperature controller was used to maintain the temperature of the gas phase enclosure at the desired level. An overhead vessel was employed to store the aqueous amine solution. A constant liquid flow, through an outside part of the tube and gas flow were monitored using calibrated rotameters. Thermostated water was circulated through the middle of a concentric tube, which formed a two-pass heat exchanger, to maintain the liquid film temperature. At the end of the absorption length, three samples of CO2 loaded aqueous solutions were collected in the liquid receiver at a fixed interval to obtain steady state absorption flux. Each set of data was the average of the three liquid solutions. A thermostated gas cell with a manometric device was used to measure the total CO2 content of a loaded liquid.34 Hence, the liquid phase analysis was considered to estimate the specific rate of CO2 in the (APA + AMP + H2O) solvent.
5. Results and discussion
5.1. Physicochemical, transport and thermodynamic properties
5.1.1. Density and viscosity.
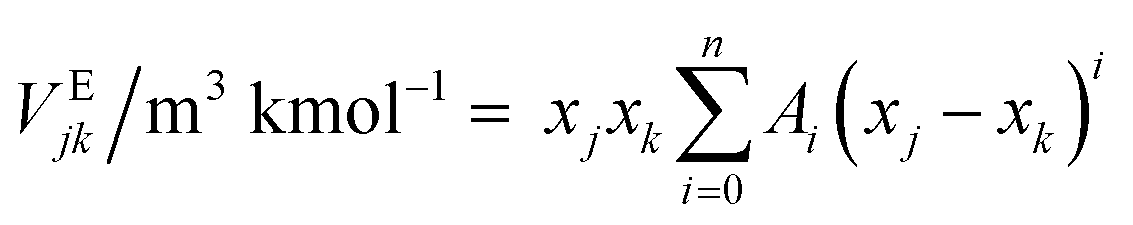
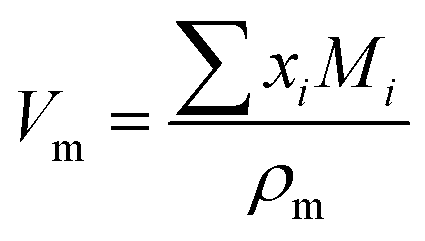
The experimental data of density and viscosity measurements of aqueous solutions of (APA + AMP) at various temperatures and concentrations, are given in ESI (Table S2†). A Redlich–Kister equation is suggested to implement the experimental density in terms of excess volume (VE), which is a function of temperature (T) in the Kelvin range and mole fraction (xi) of component, i, as illustrated below:| |  | (14) |
where| | | Ai = a + b(T/K) + c(T/K)2 | (15) |
| |  | (17) |
where ρm is the density of the solution in kg m−3, a, b, and c are adjustable parameters and Vm is molar volume in m3 kmol−1. Total excess volume, VE, is the sum of binary excess volume varies with the change of mole fraction of APA (x1) as shown in Fig. 1. In the studied composition and the entire temperature range, the values of VE are negative. This VE describes the physical, structural and chemical contribution of the components between the molecules upon mixing. The dispersion of forces or weak dipole–dipole interactions account for physical contributions, which leads to positive contribution of VE. The structural contribution of the different size molecules present in the mixture provides geometrical effect to fit each other's structure, which leads to the negative contribution of VE. Lastly, the chemical contribution while VE values are negative involves the formation of hydrogen bonding, the specific interaction, formation of charge transfer complex, other complex forming interactions and strong dipole–dipole interactions are amongst the components.35,36 This study indicates that packing effect and intermolecular interactions (hydrogen bond) exist in the mixture, and a contraction of volume occurs by strong intermolecular interaction in the system upon mixing as well as other properties while VE are negative, as mentioned above. The AAD of this system is 0.12% for 42 data points. The values of VE are given in Table S3,† and the parameters are tabulated in Table 1. Herein, a correlation developed by Hsu et al.37 was used to calculate the density of pure AMP.
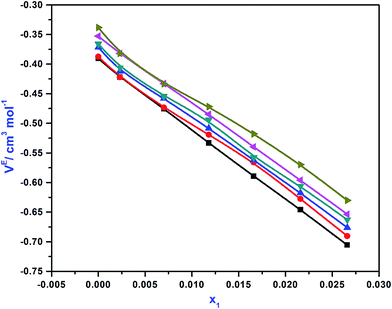 |
| | Fig. 1 Excess molar volume (VE) values of APA (1) + AMP (2) + H2O (3) systems as a function of APA mole fraction  , T = 298 K; , T = 298 K;  , T = 303 K; , T = 303 K;  , T = 308 K; , T = 308 K;  , T = 313 K; , T = 313 K;  , T = 318 K; , T = 318 K;  , T = 323 K. , T = 323 K. | |
Table 1 Ternary Redlich–Kister parameters A0, A1, A2 for the excess volume of density for APA (1) + AMP (2) + H2O (3) (eqn (14) and (15))a
| Parameter |
Binary pair |
| APA (1) + AMP (2) |
AMP (2) + H2O (3) |
APA (1) + H2O (3) |
|
AAD for ternary density, 0.12%.
|
|
A
0
|
a
|
3.0289 |
1.3901 |
4.8559 |
|
b
|
−0.30397 |
0.55637 |
−1.2786 |
|
c
|
0.072131 |
0.38635 |
0.44933 |
|
A
1
|
a
|
−2.1136 |
−0.029089 |
−1.6548 |
|
b
|
−0.82476 |
1.2527 |
−2.6081 |
|
c
|
0.25637 |
0.89446 |
0.9783 |
|
A
2
|
a
|
−3.091 |
−1.8248 |
−8.0982 |
|
b
|
2.1344 |
0.70382 |
−1.2998 |
|
c
|
0.04018 |
0.5177 |
0.52785 |
The thermal expansion coefficient (α), of the blend was estimated from the experimentally measured density values according to the eqn (18)38
| |  | (18) |
where
ρm,
T and
p are the measured liquid density, temperature, and pressure, respectively. The values of thermal expansion coefficient (
α) are incorporated in Table S3.
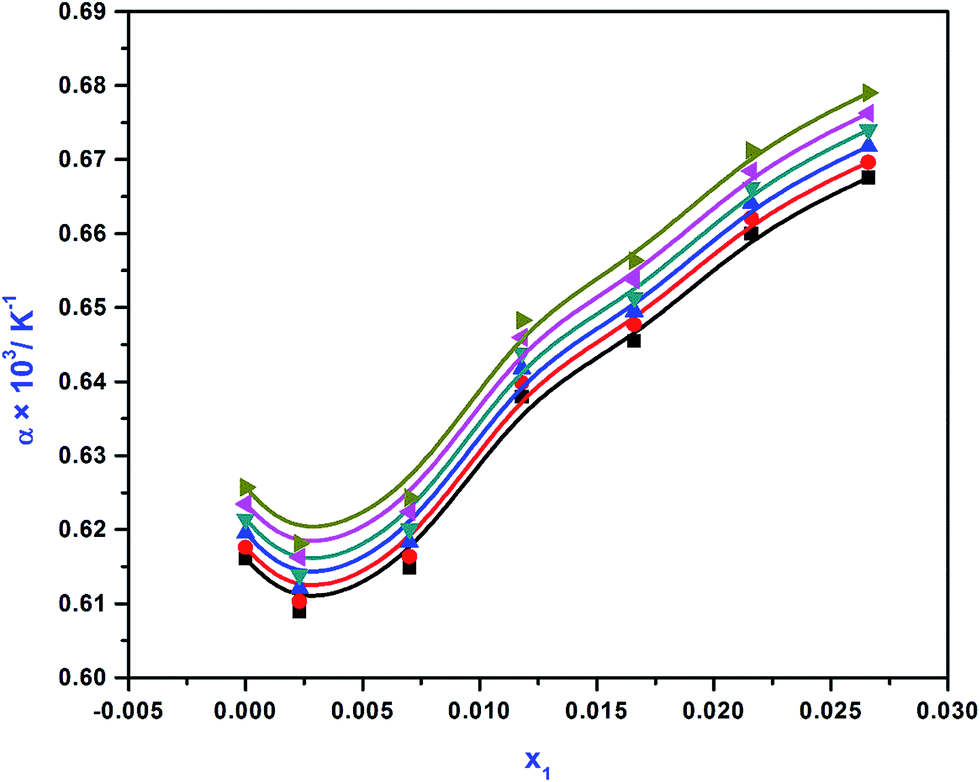
†Fig. 2 demonstrates the values of
α against APA concentration at various temperatures. It was observed that the values of
α were all positive. The values of
α for (APA + AMP + H
2O) increase with increasing APA concentration, indicating a further expansion in the volume with the addition of more APA in the blend. The values of
α of the blend increase with increasing temperature demonstrating higher expansivities for the mixtures.
 |
| | Fig. 2 Thermal expansion coefficient (α) values of APA (1) + AMP (2) + H2O (3) system at various mole fraction of APA  , T = 298 K; , T = 298 K;  , T = 303 K; , T = 303 K;  , T = 308 K; , T = 308 K;  , T = 313 K; , T = 313 K;  , T = 318 K; , T = 318 K;  , T = 323 K. , T = 323 K. | |
The Grunberg and Nissan model is applied to estimate the predicted experimental viscosity data as a function of mole fraction and temperature, as shown below:
| | ln(η/mPa s) = ∑xi![[thin space (1/6-em)]](https://www.rsc.org/images/entities/char_2009.gif) lnηi + ∑∑xixjGij lnηi + ∑∑xixjGij | (19) |
| | | Gij = a + b(T/K) + c(T/K)2 | (20) |
where
η is the viscosity in mPa s and
a,
b, and
c are parameters, whose values are given in the
Table 2. The viscosity data of pure AMP are taken from Mandal
et al.39 The AAD% for these predicted values is 2.23% over 42 data points.
Table 2 Parameters of Grunberg and Nissan model G12, G23, G13 for ternary viscosity of APA (1) + AMP (2) + H2O (3) (eqn (19) and (20))a
| Parameter |
G
12
|
G
23
|
G
13
|
|
AAD for ternary viscosity, 2.23%.
|
|
a
|
43971 |
951.42 |
−2146.1 |
|
b
|
−289.8 |
−5.8358 |
14.421 |
| 103c |
477.04 |
9.048 |
−23.888 |
The viscosity deviation (Δη) of the blend was calculated from the experimental value of viscosity and the viscosity values of pure components using the eqn (21)40
| | | Δη = ηm − (x1η1 + x2η2 + x3η3) | (21) |
where
x1,
x2 and
x3 are the mole fraction of components 1, 2 and 3, respectively while
ηm,
η1,
η2 and
η3 are the viscosity values of the mixture and components 1, 2 and 3, respectively.
The calculated values of viscosity deviation (Δη) are incorporated in Table S3.†Fig. 3 demonstrate the values of Δη against APA mole fraction at different temperatures. It was observed that the values of Δη increased with increasing temperature at constant concentration, indicating a positive value of Δη. Vogel and Weiss41 expressed that different components present in the blend system with strong interactions, show positive viscosity deviations. The dipole interactions between AMP and H2O are less at low temperatures. The interaction between the molecules of the system increased when APA was introduced into the system and the temperature was increased. The values of Δη increase with an increment in both temperature and mole fraction of APA, suggesting that dipole interaction between the molecules in the system is more prominent at higher temperatures and increases with the mole fraction of APA in the mixture. The negative Δη values express that the interaction amongst AMP and H2O is weak and becomes stronger with the addition of APA into the mixture. The values of Δη tend to increase on account of the increase of viscosity in the blend with the introduction of APA. Thus, overall it is described that at low APA concentration and low temperature, the dipole association is less prevailing, which increases with temperature and APA concentration.
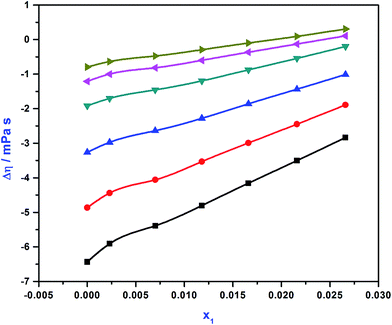 |
| | Fig. 3 Viscosity deviation (Δη) values of APA (1) + AMP (2) + H2O (3) system against APA mole fraction  , T = 298 K; , T = 298 K;  , T = 303 K; , T = 303 K;  , T = 308 K; , T = 308 K;  , T = 313 K; , T = 313 K;  , T = 318 K; , T = 318 K;  , T = 323 K. , T = 323 K. | |
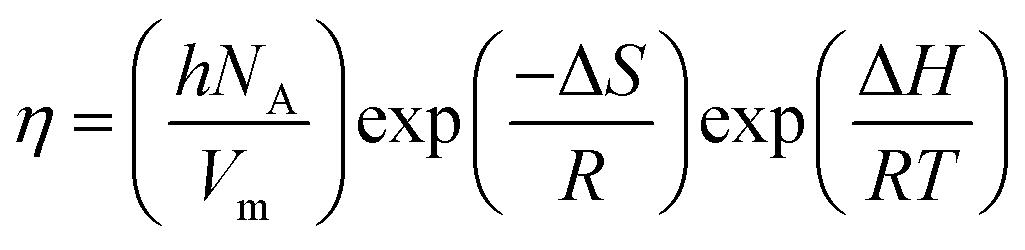
The Eyring equation eqn (22)42 has been used to calculate the activation molar enthalpy (ΔH), molar entropy (ΔS) and the Gibbs free energy (ΔG) of the ternary blends using experimental viscosity data
| | 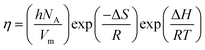 | (22) |
where,
h,
NA,
Vm, Δ
S, Δ
H,
R, and
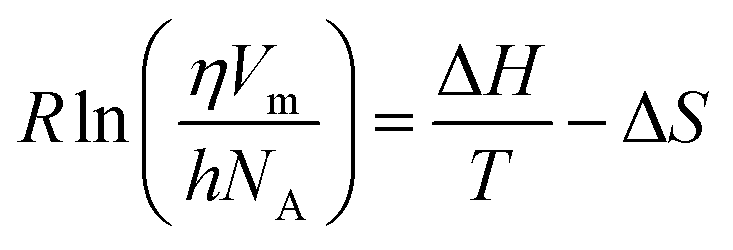
T are Planck constant, Avogadro's constant, the molar volume, molar entropy, molar enthalpy, the gas constant and the temperature, respectively. A rearrangement of
eqn (22) can be done according to
eqn (23) as a linear equation of
Rln(
ηVm/
hNA) against 1/
T, in which the slope and the intercept were estimated for Δ
H and Δ
S values, respectively.
| |  | (23) |
From the obtained values of ΔH and ΔS, molar Gibbs free energy (ΔG) can be calculated at a particular temperature according to eqn (24)
Based on the experimental viscosity as a function of concentration, the estimated values of ΔH and ΔS from eqn (23) for an entire temperature range and ΔG at T = 298 K are incorporated in Table S4.† It was observed from Table S4† that the values of ΔH were positive in the blend, which indicate strong interactions in the molecule,35 while the values of ΔH were greater than those of TΔS. These observations suggest that the contribution of enthalpy to the change of molar Gibbs free energy was more predominant than that of entropy.
5.1.2. Solubility of N2O.
The measured N2O solubility in aqueous solution of (APA + AMP) is presented in terms of Henry's constant (HN2O) as ESI (Table S5†) at temperature T = 298–323 K and various amine concentrations. As observed, Henry's constant (HN2O) increased with increasing temperature; this may be due to the exothermic nature of the gas absorption. However, Henry's constant decreased with increasing APA concentration in ternary solutions, which may be due to a larger affinity of APA towards N2O. Several models such as the semi-empirical model, Arrhenius type equation and polynomial model are suggested to estimate the solubility as given below:
5.1.2.1. Semi-empirical model.
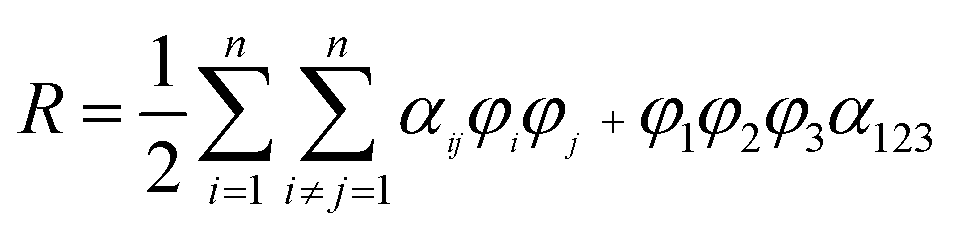
A semi-empirical model was introduced to implement the experimental solubility of N2O into aqueous solutions of (APA + AMP), in terms of excess Henry's constant (R) as shown in eqn (25). Excess Henry's constant (R) is a function of the volume fraction (φi) of amines and water, and the temperature, as shown in eqn (26) and (27).| | 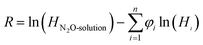 | (25) |
| | 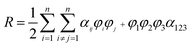 | (26) |
| | | αij = k1 + k2T + k3T2 + k4φj | (27) |
where α123 is a constant for three-body interaction parameter, and k1, k2, k3 and k4 are constants for two-body interaction parameter. The values of Henry's constant of pure AMP and an aqueous solution of AMP were obtained from Wang et al.43 and Mandal et al.,44 respectively, to calculate the excess property. The value of AAD for model predicted solubility of aqueous (APA + AMP) solutions was 0.95%, and parameters are given in Table 3.
Table 3 Parameters k1, k2, k3, k4, α123 for the excess Henry's constant for the ternary solvent systems and AAD for N2O solubility of APA (1) + AMP (2) + H2O (3) (eqn (25) and (26))
| System |
k
1
|
k
2
|
104k3 |
k
4
|
α
123
|
AAD% |
| APA (1) + AMP (2) |
−447.95 |
2.505 |
−32.31 |
180.23 |
|
|
| APA (1) + AMP (2) + H2O (3) |
|
|
|
|
−111.80 |
0.95 |
5.1.2.2. Arrhenius type equation.
The solubility of N2O was also estimated by the Arrhenius type equation as shown below in terms of different APA (m1) and AMP (m2) concentrations (kmol m−3) and temperature (T)| | | HN2O/kPa m3 kmol−1 = (a + bm1 + cm12 + dm2 +em22 + fm1m2)exp(−h/(T/K)) | (28) |
5.1.2.3. Polynomial model.
This model is suggested to predict the solubility of N2O as a function of the mole fraction of APA (x1), AMP (x2), and the temperature (T), which is defined in eqn (29).| | | HN2O/kPa m3 kmol−1 = A1 + A2x1 + A3x22 + A4(T/K) + A5x1(T/K) + A6x22(T/K) | (29) |
The values of parameters are presented in Tables 4 and 5 for both the Arrhenius type equation and the polynomial model having AAD of 0.38% and 0.28%, respectively.
Table 4 Parameters for solubility and diffusivity of N2O in the ternary solution of APA (1) + AMP (2) + H2O (3) with AAD using Arrhenius type equation (eqn (28) and (31))
| Parameter |
Solubility |
Diffusivity |
|
a
|
7.6867 × 10⁷ |
1.5219 × 10⁻⁶ |
|
b
|
1.5537 × 10⁵ |
1.5621 × 10⁻⁶ |
|
c
|
−8.3652 × 10⁶ |
1.57 × 10⁻⁶ |
|
d
|
3.4288 × 10⁸ |
3.0287 × 10⁻⁶ |
|
e
|
−1.22 × 10⁸ |
2.7701 × 10⁻⁶ |
|
f
|
−1.31 × 10⁸ |
2.994 × 10⁻⁶ |
|
h
|
1809.2 |
3248.3 |
| AAD% |
0.38 |
2.57 |
The results of all of the three models were compared with measured solubility of N2O in an aqueous solution of (APA + AMP) and are shown in the parity plot (Fig. S1†). It is important to note that the polynomial model led to the best result amongst them.
5.1.3. Diffusivity.
The experimental diffusivity of N2O into aqueous solutions of (APA + AMP) at various concentrations and temperatures is given in Table S6.† As observed, N2O diffusivity decreased with increasing APA concentration and decreasing temperature. Different models used to predict diffusivity of N2O such as the modified Stokes Einstein model, Arrhenius type equation and the polynomial model are given below:
5.1.3.1. Modified Stokes Einstein model.
Modified Stokes Einstein model based on viscosity of the solutions (η) with different temperatures and measured diffusivity of N2O, is suggested to estimate the diffusivity of N2O (DN2O) into aqueous solutions of (APA + AMP) as follows:| | 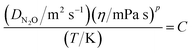 | (30) |
where p and C are constant parameters. For the ternary system, the values of p and C were 0.907 and 6.74 × 10⁻¹², respectively. The AAD value for this model predicted the diffusivity of N2O to be 3.05%.
5.1.3.2. Arrhenius type equation.
The Arrhenius type equation is considered to predict diffusivity of N2O (DN2O) into aqueous (APA + AMP) solutions as the function of the molar concentration of APA (m1) and AMP (m2), and temperature as shown in eqn (31).| | | DN2O/m2 s−1 = (a + bm1 + cm12 + dm2 + em22 + fm1m2)exp(−h/(T/K)) | (31) |
The values of parameters for eqn (31) are also given in Table 4. The values of AAD through this model were found to be 2.57%.
5.1.3.3. Polynomial model.
The Polynomial model is applied to estimate the predicted diffusivity of N2O for ternary solutions as the function of the mole fraction of APA (x1), AMP (x2), and temperature (T) as given below.| | | ln(DN2O/m2 s−1) = A1 + A2x1 + A3x22 + A4(T/K) + A5x1(T/K) + A6x22(T/K) | (32) |
Parameters of eqn (32) are given in Table 5 along with the AAD of 2.44%.
Table 5 Parameters A1, A2, A3, A4, A5, A6 for solubility and diffusivity of N2O in the ternary solutions of APA (1) + AMP (2) + H2O (3) with AAD using polynomial models (eqn (29) and (32))
| Parameter |
Solubility |
Diffusivity |
|
A
1
|
3.7394 |
−29.028 |
|
A
2
|
−22.37 |
−136.91 |
|
A
3
|
−159.45 |
−310.4 |
| 103A4 |
15.456 |
26.212 |
| 103A5 |
79.144 |
416.57 |
|
A
6
|
0.655 |
1.1248 |
| AAD% |
0.28 |
2.44 |
All of the parameters obtained through regression from the different model are computed using Matlab software (2013b). Comparisons with the experimental diffusivity of N2O to the model predicted data are represented in a parity plot, as shown in Fig. S2.† It was prominent from the graph that the polynomials model showed the best-fit results for these ternary solutions.
5.2. Determination of overall reaction rate constant and second order rate constant for aqueous (AMP + APA) solutions
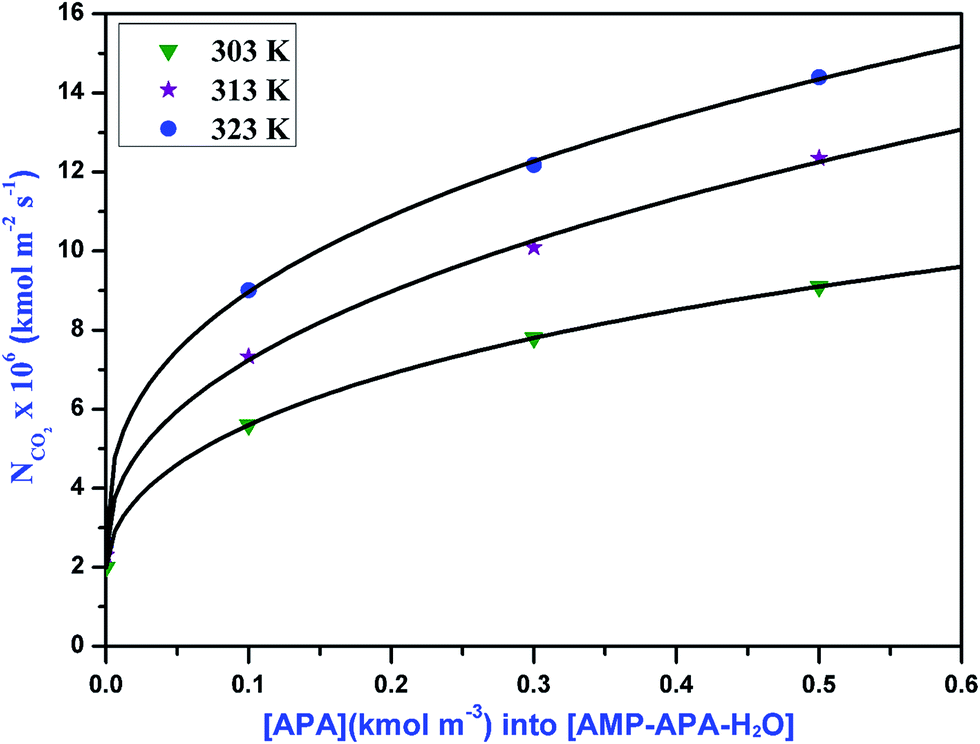
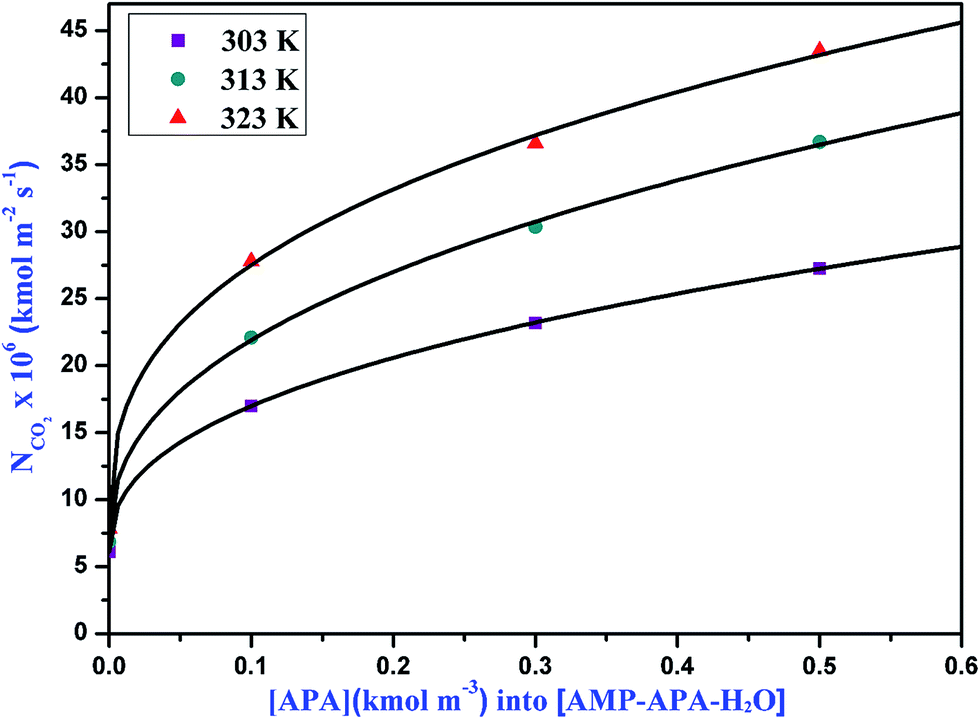
The absorption rate of CO2 in the aqueous blend of (APA + AMP) solutions is given in Table 6. Herein, APA acts as an activator in aqueous AMP solution. As observed from Table 6, the specific rate of absorption of CO2 in the aqueous blend of (APA + AMP) solutions increased with increasing temperature as well as increasing APA concentration. Due to the presence of bulky methyl groups, AMP is sterically hindered, which leads to lower reaction rate with CO2. However, in APA, due to the presence of six electron donating alkyl groups, the two amine groups at either end cannot affect each other and are equally reactive with a higher pKa value (10.85). Since the basicity of APA is higher than that of AMP, APA can deprotonate the zwitterion faster, indicating its higher reaction rate.11 The specific absorption rate of CO2 at different amine concentrations, is shown in Fig. 4, 5 and 6 for 5, 10 and 15 kPa partial pressures, respectively. The Hatta numbers given in Tables 6 and 7 are higher than 3 in all cases and E∞ are much higher than Ha, and hence (3 < Ha ≪ E∞) condition is fulfilled. The enhancement factor equal to the Hatta number (Ha) is also included in Tables 6 and 7.
Table 6 Results of the interpretation of the experimental kinetic data for CO2–APA–AMP–H2O system
|
T (K) |
[APA/AMP] (kmol m−3) |
p
CO2 (kPa) |
θ (s−1) |
k
L (105 m s−1) |
N
CO2 (106 kmol m−2 s−1) |
H
a
|
E
|
| 303 |
0/3 |
4.85 |
0.555 |
4.5 |
2.00 |
37.6 |
37.6 |
| 0.1/2.9 |
0.564 |
4.33 |
5.60 |
109.1 |
109.1 |
| 0.3/2.7 |
0.571 |
4.20 |
7.80 |
154.7 |
154.7 |
| 0.5/2.5 |
0.585 |
4.04 |
9.10 |
185.7 |
185.7 |
| 0/3 |
9.71 |
0.555 |
4.55 |
3.98 |
37.3 |
37.3 |
| 0.1/2.9 |
0.564 |
4.33 |
11.25 |
109.5 |
109.5 |
| 0.3/2.7 |
0.571 |
4.20 |
15.40 |
153.4 |
153.4 |
| 0.5/2.5 |
0.585 |
4.04 |
18.13 |
184.7 |
184.7 |
| 0/3 |
14.6 |
0.555 |
4.55 |
6.10 |
38.2 |
38.2 |
| 0.1/2.9 |
0.564 |
4.33 |
17.00 |
110.4 |
110.4 |
| 0.3/2.7 |
0.571 |
4.20 |
23.20 |
153.4 |
153.4 |
| 0.5/2.5 |
0.585 |
4.04 |
27.25 |
185.3 |
185.3 |
| 313 |
0/3 |
4.70 |
0.493 |
5.77 |
2.31 |
40.4 |
40.4 |
| 0.1/2.9 |
0.500 |
5.57 |
7.33 |
132.1 |
132.1 |
| 0.3/2.7 |
0.510 |
5.41 |
10.09 |
186.0 |
186.0 |
| 0.5/2.5 |
0.519 |
5.22 |
12.35 |
232.6 |
232.6 |
| 0/3 |
9.39 |
0.493 |
5.77 |
4.55 |
39.9 |
39.9 |
| 0.1/2.9 |
0.500 |
5.47 |
14.80 |
127.0 |
127.0 |
| 0.3/2.7 |
0.510 |
5.41 |
20.00 |
184.6 |
184.6 |
| 0.5/2.5 |
0.519 |
5.22 |
24.60 |
232.6 |
232.6 |
| 0/3 |
14.1 |
0.493 |
5.77 |
6.85 |
40.0 |
40.0 |
| 0.1/2.9 |
0.500 |
5.57 |
22.10 |
132.8 |
132.8 |
| 0.3/2.7 |
0.510 |
5.41 |
30.37 |
186.3 |
186.3 |
| 0.5/2.5 |
0.519 |
5.22 |
36.70 |
230.4 |
230.4 |
| 323 |
0/3 |
4.45 |
0.442 |
6.98 |
2.58 |
46.8 |
46.8 |
| 0.1/2.9 |
0.452 |
6.73 |
9.01 |
168.1 |
168.1 |
| 0.3/2.7 |
0.462 |
6.58 |
12.18 |
230.6 |
230.6 |
| 0.5/2.5 |
0.473 |
6.40 |
14.40 |
277.3 |
277.3 |
| 0/3 |
8.9 |
0.442 |
6.98 |
5.10 |
46.2 |
46.2 |
| 0.1/2.9 |
0.452 |
6.73 |
18.05 |
168.4 |
168.4 |
| 0.3/2.7 |
0.462 |
6.58 |
23.97 |
226.9 |
226.9 |
| 0.5/2.5 |
0.473 |
6.40 |
28.50 |
274.4 |
274.4 |
| 0/3 |
13.65 |
0.442 |
6.98 |
7.86 |
46.4 |
46.4 |
| 0.1/2.9 |
0.452 |
6.73 |
27.80 |
169.1 |
169.1 |
| 0.3/2.7 |
0.462 |
6.58 |
36.60 |
225.9 |
225.9 |
| 0.5/2.5 |
0.473 |
6.40 |
43.52 |
273.2 |
273.2 |
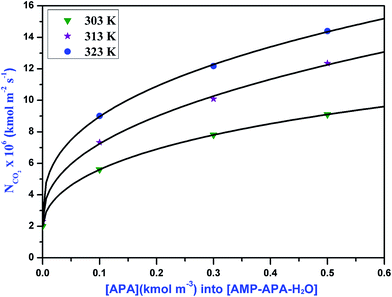 |
| | Fig. 4 Specific absorption rates of CO2 into aqueous solutions of APA at different temperatures for gas compositions 5% CO2 and 95% N2. | |
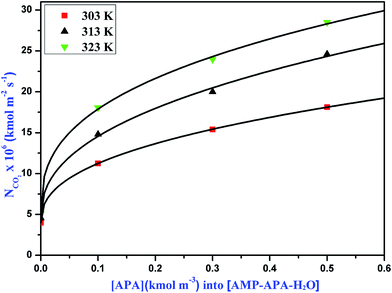 |
| | Fig. 5 Specific absorption rates of CO2 into aqueous solutions of APA at different temperatures for gas compositions 10% CO2 and 90% N2. | |
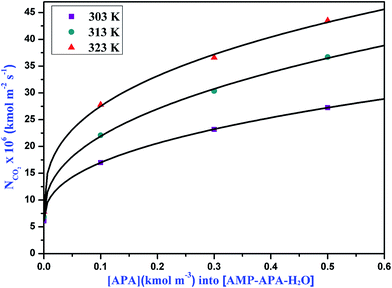 |
| | Fig. 6 Specific absorption rates of CO2 into aqueous solutions of APA at different temperatures for gas compositions 15% CO2 and 85% N2. | |
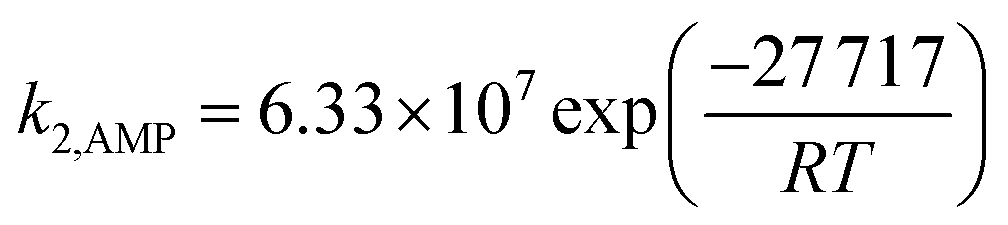
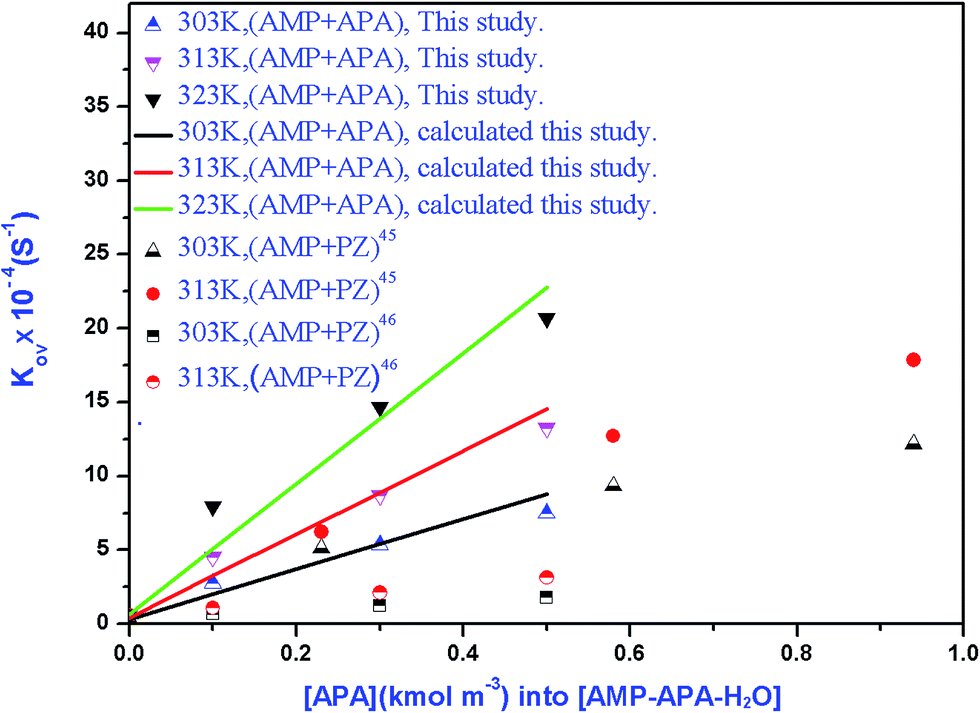
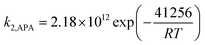
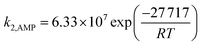
The overall rate of reaction, kov, are calculated based on eqn (13) and presented in Table 7. Fig. 7 shows a change of kov with the variation of APA concentration in (APA + AMP + H2O). This figure also shows the variation of PZ concentration in (AMP + PZ + H2O) systems, which are available in open literature.45 The kov values for the absorption of CO2 into the aqueous blend of (APA + AMP) solutions at 303 K are comparable with reported values for the (AMP + PZ + H2O) system by Samanta et al.45 However, at some higher temperatures (313 K), the values of kov for the (APA + AMP + H2O) system are a little greater than the reported values of (AMP + PZ + H2O) systems. Thus, at comparatively higher temperature ranges, the (APA + AMP + H2O) system is preferable to the absorption of CO2 than the (AMP + PZ + H2O) system. On the other hand, at the temperature range of 303–313 K, the values of kov for (APA + AMP + H2O) system are higher than the values described by Sun et al.46 The kinetic parameters, k2,APA and k2,AMP, calculated from the values of kov by a regression method using Matlab software (2013b) are included in Table 7. The average absolute deviation from this regression analysis is estimated to be 2.71% for 36 data points. In order to study the effect of kinetics parameter on the calculated specific rate of absorption, parametric sensitivity analysis was performed and discussed in the next section. The second order rate constants, k2,APA and k2,AMP, are correlated as a function of temperature with the following results (over the experimental range).
| |  | (33) |
| |  | (34) |
Table 7 Kinetics constant for the absorption of CO2 into aqueous blend solutions of AMP and APA
|
T (K) |
[APA/AMP] (kmol m−3) |
p
CO2 (kPa) |
E
∞
|
k
ov (s−1) |
k
2 (m3 kmol−1 s−1) |
k
2,APA (m3 kmol−1 s−1) |
k
2,AMP (m3 kmol−1 s−1) |
| 303 |
0/3 |
4.85 |
1404.4 |
3238.4 |
1079.5 |
166062.5 |
1114.6 |
| 0.1/2.9 |
1387.5 |
26869.6 |
8956.5 |
| 0.3/2.7 |
1370.9 |
53463.4 |
17821.1 |
| 0.5/2.5 |
1356.7 |
75065.6 |
25021.9 |
| 0/3 |
9.71 |
702.4 |
3199.5 |
1066.5 |
| 0.1/2.9 |
694.0 |
27054.2 |
9018 |
| 0.3/2.7 |
685.7 |
52535.6 |
17511.9 |
| 0.5/2.5 |
678.6 |
74335.9 |
24778.6 |
| 0/3 |
14.6 |
469.4 |
3347.3 |
1115.8 |
| 0.1/2.9 |
463.7 |
27513.2 |
9171 |
| 0.3/2.7 |
458.2 |
52553.4 |
17517.8 |
| 0.5/2.5 |
453.4 |
74790.9 |
24930.3 |
| 313 |
0/3 |
4.70 |
1662.8 |
4226.8 |
1408.9 |
287057.5 |
1411.1 |
| 0.1/2.9 |
1652.7 |
44453.3 |
14817.8 |
| 0.3/2.7 |
1637.0 |
86165.9 |
28722.0 |
| 0.5/2.5 |
1616.3 |
132654.8 |
44218.3 |
| 0/3 |
9.39 |
833.2 |
4108.4 |
1369.5 |
| 0.1/2.9 |
828.1 |
45403 |
15134.3 |
| 0.3/2.7 |
820.3 |
85155.6 |
28385.2 |
| 0.5/2.5 |
809.9 |
131863.3 |
43954.4 |
| 0/3 |
14.1 |
555.5 |
4129.7 |
1376.6 |
| 0.1/2.9 |
552.1 |
44899 |
14966.4 |
| 0.3/2.7 |
546.9 |
86736.2 |
28912.1 |
| 0.5/2.5 |
540.0 |
130160.4 |
43386.8 |
| 323 |
0/3 |
4.45 |
2079.2 |
6295.5 |
2098.5 |
463447.6 |
2116.3 |
| 0.1/2.9 |
2066.3 |
79594.4 |
26531.5 |
| 0.3/2.7 |
2048.5 |
146610.4 |
48870.1 |
| 0.5/2.5 |
2026.1 |
207032.9 |
69011 |
| 0/3 |
8.9 |
1040.5 |
6150.0 |
2050.0 |
| 0.1/2.9 |
1034.1 |
79859.7 |
26619.9 |
| 0.3/2.7 |
1025.2 |
141953.5 |
47317.8 |
| 0.5/2.5 |
1013.9 |
202742.2 |
67580.7 |
| 0/3 |
13.65 |
679.1 |
6210.0 |
2070.0 |
| 0.1/2.9 |
674.9 |
80533.7 |
26844.6 |
| 0.3/2.7 |
669.1 |
140698 |
46899.2 |
| 0.5/2.5 |
661.7 |
200977.3 |
66992.4 |
 |
| | Fig. 7 Overall reaction rate constants for the reaction of CO2 with aqueous (APA + AMP) solutions as a function of amine concentration. | |
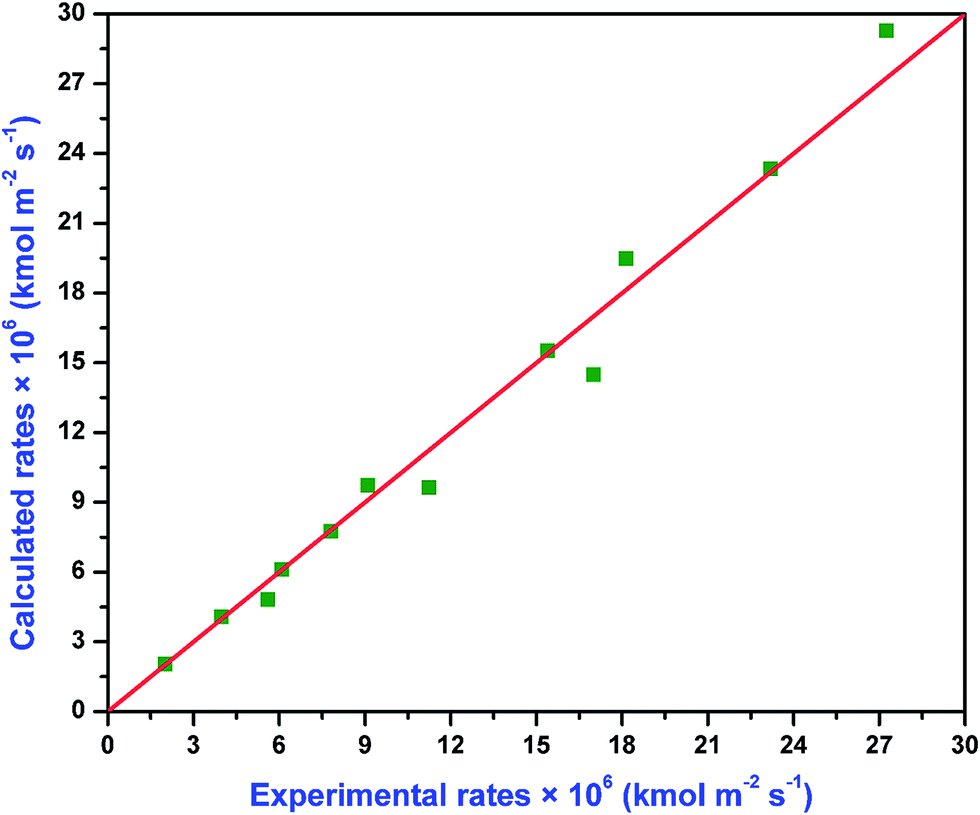
The absolute average deviation for these calculated rate constants are found to be 0.87% and 4.38%, respectively. The activation energy for k2,APA and k2,AMP is estimated to be approximately 41.3 and 27.7 kJ mol−1, respectively. The experimental and model calculated specific rate of absorption using eqn (33) and (34) are depicted in the parity plot (Fig. 8). There is good agreement between the experimental and model fitted data.
 |
| | Fig. 8 Comparison of the calculated rates to the experimental rates of absorption for CO2 into aqueous solutions of (APA + AMP). | |
5.2.1. Enhancement of CO2 absorption using APA activated AMP.
Table 6 represents the experimental specific rate of absorption of CO2 and enhancement factors into the novel blended amine system such as (APA + AMP + H2O) at T = 303–323 K. As observed from this table and Fig. 4, the aqueous AMP solution was activated by a small amount of APA, which delivered significant enhancement in the rates of absorption. For example, the enhancement factor for the absorption of CO2 into 3 kmol m−3 AMP, 0.1 kmol m−3 APA + 2.9 kmol m−3 AMP, 0.3 kmol m−3 APA + 2.7 kmol m−3 AMP, and 0.5 kmol m−3 APA + 2.5 kmol m−3 AMP at CO2 partial pressure of about 4.0 kPa and T = 303 K are about 37.5, 117.8, 154.74, 185.6, respectively. Therefore, by replacing 0.1 kmol m−3 AMP with an equal amount of APA, the enhancement factor increased to about 214%. Again, the enhancement factor rose by an additional 31.3% when 0.2 kmol m−3 of AMP was replaced with an equal amount of APA. On further replacement of 0.2 kmol m−3 of AMP with APA, the enhancement factor was increased by an additional 19.9%. Therefore, on replacement of a small quantity of AMP with APA, a substantial increase of enhancement factor was observed. This is presumably due to the larger amount of AMP present in solutions catalyzed by the formation of APA-carbamate and APA-dicarbamate ions. However, the initial enhancement factor of (0.1APA + 2.9AMP) kmol m−3 is high. As the concentration of APA increased further in the blend solution, approximately (2.5AMP + 0.5APA) kmol m−3, the observed enhancement factor was not found to follow the same trend. One of the reason may be the decrease in diffusivity with increasing APA concentration and decreasing AMP concentration in the blend. The other possible reason could be the negligible increase in equilibrium loading capacity. Similar phenomena were observed by Samanta et al.47 for the absorption of CO2 into the (MDEA + PZ + H2O) system.
5.2.2. Effect of pertinent parameters on the rate of absorption of CO2.
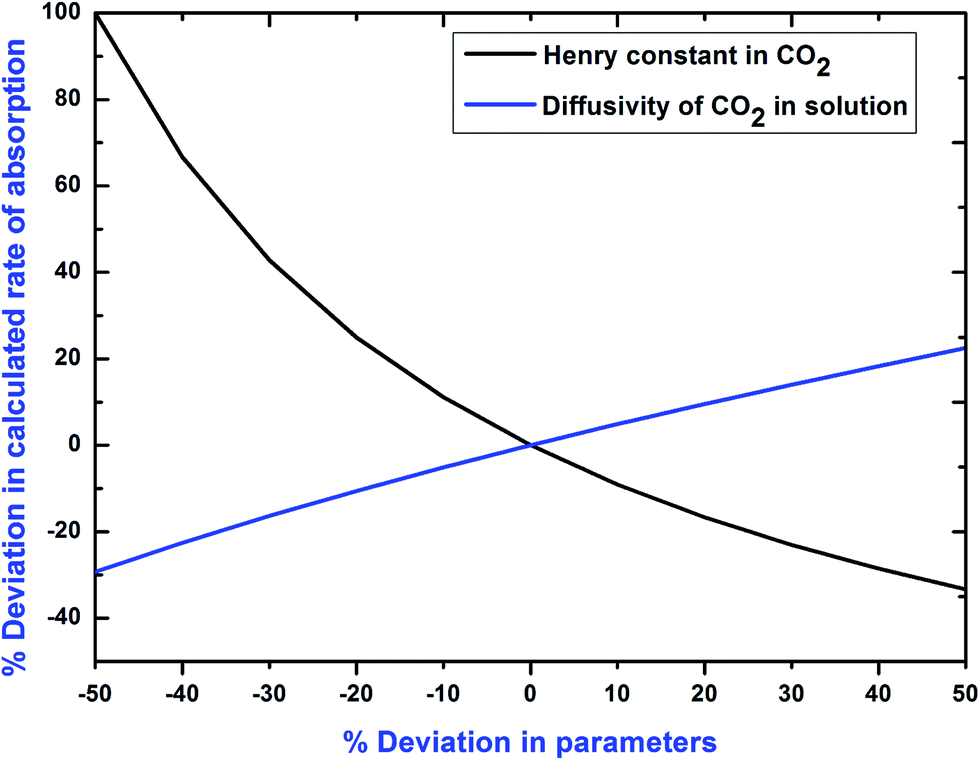
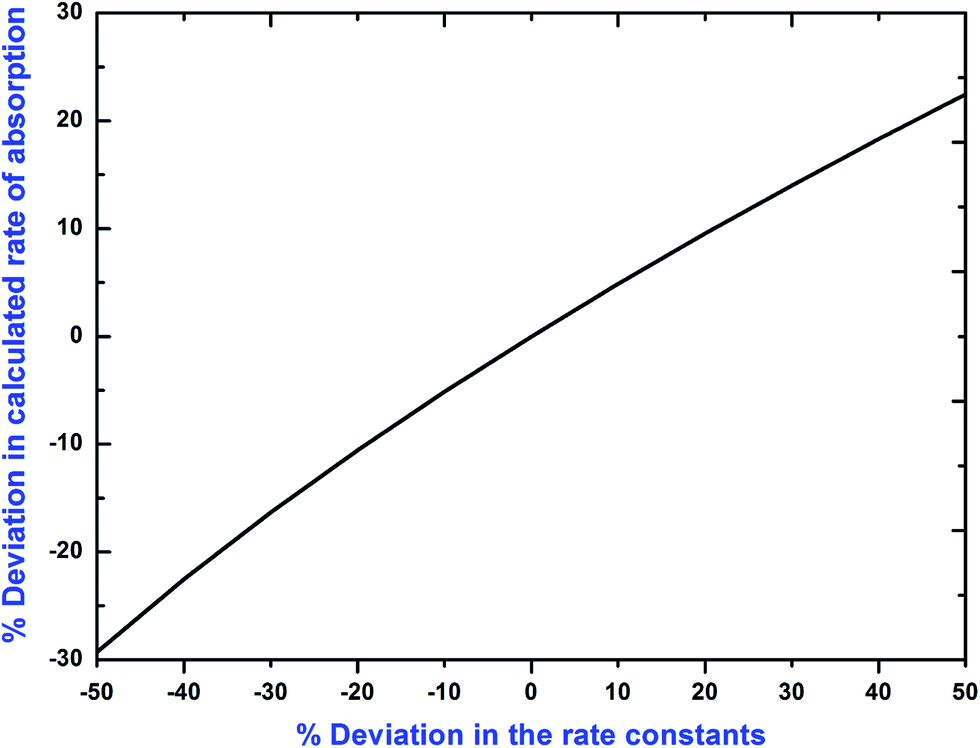
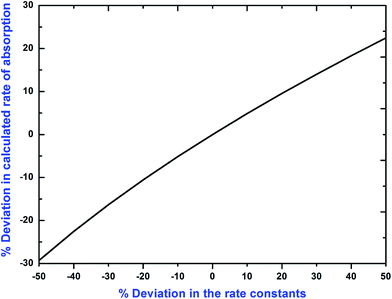
A parametric sensitivity analysis has been performed to examine the effect of important physicochemical and kinetic parameters on the specific rate of absorption of CO2 into (APA + AMP + H2O) solutions. The pertinent parameters, i.e. Henry's law constant and diffusion coefficient of CO2 into the (APA + AMP + H2O) system, and the kinetics constant of CO2–(APA + AMP) reactions in aqueous solutions of (APA + AMP) are considered for this analysis. Deviations of +50% to −50% were incorporated over the pertinent parameter value and results were generated. The resulting deviation to Henry's law constants and the diffusivity of CO2 on the specific rate of absorption are depicted in Fig. 9. The corresponding deviation of Henry's law constants is in the range of −33% to 100% and diffusivity is in the range of +23% to −29% on the specific rate of absorption of CO2. Therefore, Henry's law constants are very sensitive to the specific rate of absorption of CO2 in comparison to the diffusion constants of CO2. It is evident from the Fig. 10 that significant deviation on the calculated rate of absorption of CO2 occurred due to the error introduced in rate constant values. Herein, the numerical output to this deviation is in the range of +23% to −29% with the corresponding deviation incorporated on rate constant values.
 |
| | Fig. 9 Deviation in Henry's law constant and diffusivity of CO2 on the calculated rate of absorption of CO2 into aqueous blend of (APA + AMP) solutions. | |
 |
| | Fig. 10 Deviation in second order rate coefficient on the calculated rate of absorption of CO2 into aqueous blend of (APA + AMP) solutions. | |
6. Conclusions
The experimental and theoretical studies of physicochemical properties as well as CO2 reaction kinetics on the novel aqueous solvent of (APA + AMP) were investigated. The thermodynamic properties indicate that specific and strong interactions like strong dipole–dipole interactions, hydrogen bonding, and charge transfer interactions are present in the investigated system. Significant enhancement of the specific rate of absorption of CO2 was observed by the addition of a small amount of rate activator, (APA), to a larger volume of AMP solution. Out of the three compositions studied, 2.5 kmol m−3 AMP + 0.5 kmol m−3 APA showed the highest peak with respect to APA concentration, specific rate and the enhancement factor. The regressed values for the physicochemical and transport properties and second order rate constants estimated from the different models are in an acceptable range of less than 5% (AAD). The kov value of (APA + AMP) blend solutions was found to be little higher compared that of (AMP + PZ) blend solutions at comparatively higher temperatures. This study demonstrated that APA activated aqueous AMP solutions could be a potential alternative for enhancing the absorption of CO2 compared to single aqueous AMP solutions.
Conflict of interest
The authors declare no competing financial interest.
Acknowledgements
The study reported was financially supported by the Department of Science and Technology (DST) (Grant No. DST/TSG/NTS/2015/73), New Delhi, the Government of India, INDIA.
References
- A. A. Khan, G. N. Halder and A. K. Saha, Int. J. Greenhouse Gas Control, 2016, 32, 15–23 CrossRef.
- S. Paul and K. Thomsen, Int. J. Greenhouse Gas Control, 2012, 8, 169–179 CrossRef CAS.
- M. K. Wong, A. M. Shariff and M. A. Bustam, RSC Adv., 2016, 6, 10816–10823 RSC.
- P. Nugent, Y. Belmabkhout, S. D. Burd, A. J. Cairns, R. Luebke, K. Forrest, T. Pham, S. Ma, B. Space, L. Wojtas, M. Eddaoudi and M. J. Zaworotko, Nature, 2013, 495, 80–84 CrossRef CAS PubMed.
- S. D. Kenarsari, D. Yang, G. Jiang, S. Zhang, J. Wang, A. G. Russell, Q. Weif and M. Fan, RSC Adv., 2013, 3, 22739–22773 RSC.
- Z. Liang, W. Rongwong, H. Liu, K. Fu, H. Gao, F. Cao, R. Zhang, T. Sema, A. Henni and K. Sumon,
et al.
, Int. J. Greenhouse Gas Control, 2015, 40, 26 CrossRef CAS.
- H. Pashaei, A. Ghaemi and M. Nasiri, RSC Adv., 2016, 6, 108075–108092 RSC.
- S. Norouzbahari, S. Shahhosseini and A. Ghaemi, RSC Adv., 2016, 6, 40017–40032 RSC.
- S. K. Dash, A. Samanta, A. N. Samanta and S. S. Bandyopadhyay, Chem. Eng. Sci., 2011, 66, 3223–3233 CrossRef CAS.
- B. P. Mandal, A. K. Biswas and S. S. Bandyopadhyay, Chem. Eng. Sci., 2003, 58, 4137–4144 CrossRef CAS.
- B. K. Mondal, S. S. Bandyopadhyay and A. N. Samanta, Int. J. Greenhouse Gas Control, 2017, 56, 116–125 CrossRef CAS.
- Y. Artantoa, J. Jansena, P. Pearsona, G. Puxty, A. Cottrell, E. Meulemana and P. Feron, Int. J. Greenhouse Gas Control, 2014, 20, 189–195 CrossRef.
- W. Conway, X. Wang, D. Fernandes, R. Burns, G. Lawrance, G. Puxty and M. Maeder, Environ. Sci. Technol., 2013, 47, 1163–1169 CrossRef CAS PubMed.
-
M. Appl, U. Wagner, H. J. Henrici, K. Kuessner, K. Volkamer and E. Fuerst, US Pat., 4, 336, 233, 1982.
- S. Paul, A. K. Ghoshal and B. P. Mandal, Chem. Eng. Sci., 2009, 64, 313–321 CrossRef CAS.
- J. Gabrielsen, H. F. Svendsen, M. L. Michelsen, E. H. Stenby and G. M. Kontogeorgis, Chem. Eng. Sci., 2007, 62, 2397–2413 CrossRef CAS.
- S. K. Dash, A. Samanta, A. N. Samanta and S. S. Bandyopadhyay, Int. J. Greenhouse Gas Control, 2014, 21, 130–139 CrossRef CAS.
- F. Barzagli, F. Mani and M. Peruzzini, Energy Environ. Sci., 2010, 3, 772–779 RSC.
- Z. Pei, S. Yao, W. Jianwen, Z. Wei and Y. Qing, J. Environ. Sci., 2008, 20, 39–44 CrossRef PubMed.
- G. Sartori and D. W. Savage, Ind. Eng. Chem. Fundam., 1983, 22, 239–249 CrossRef CAS.
- S. M. Yih and K. P. Shen, Ind. Eng. Chem. Res., 1988, 27, 2237–2241 CrossRef CAS.
- P. Tontiwachwuthikul, A. Meisen and C. J. Lim, Chem. Eng. Sci., 1992, 47, 381–390 CrossRef CAS.
- H. Liu, Z. Liang, T. Sema, W. Rongwong, C. Li, Y. Na, R. Idem and P. Tontiwachwuthikul, AIChE J., 2014, 60(10), 3502–3510 CrossRef CAS.
- D. J. Seo and W. H. Hong, Ind. Eng. Chem. Res., 2000, 39, 2062–2067 CrossRef CAS.
- M. Caplow, J. Am. Chem. Soc., 1968, 90, 6795–6803 CrossRef CAS.
- P. V. Danckwerts, Chem. Eng. Sci., 1979, 34, 443–446 CrossRef CAS.
- A. K. Saha and S. S. Bandyopadhyay, Chem. Eng. Sci., 1995, 50, 3587–3598 CrossRef CAS.
- H. Kierzkowska-Pawlak, Int. J. Greenhouse Gas Control, 2015, 37, 76–84 CrossRef CAS.
-
L. K. Doraiswamy and M. M. Sharma, Fluid-Fluid-Solid Reactions, Wiley, New York, 1984 Search PubMed.
- B. Das, B. Deogam, Y. Agrawal and B. Mandal, J. Chem. Eng. Data, 2016, 61, 2226–2235 CrossRef CAS.
- A. T. Zoghi, F. Feyzi and M. R. Dehghani, Ind. Eng. Chem. Res., 2012, 51, 9875–9885 CrossRef CAS.
- W. Conway, Y. Beyad, G. Richner, G. Puxty and P. Feron, Chem. Eng. J., 2015, 264, 954–961 CrossRef CAS.
- S. Y. Choi, C. S. Nam, Y. Yoon, K. T. Park and S. Park, Ind. Eng. Chem. Res., 2014, 53, 14451–14461 CrossRef CAS.
- B. P. Mandal and S. S. Bandyopadhyay, Environ. Sci. Technol., 2006, 38, 6076–6084 CrossRef PubMed.
- D. B. K. Kumar, K. R. Reddy, G. S. Rao, G. V. R. Rao and C. Rambabu, J. Mol. Liq., 2012, 174, 100–111 CrossRef.
- M. A. Kassim, N. A. Sairi, R. Yusoff, A. Ramalingam, Y. Alias and M. K. Aroua, Thermochim. Acta, 2016, 639, 130–147 CrossRef CAS.
- C. H. Hsu and M. H. Li, J. Chem. Eng. Data, 1997, 42, 502–507 CrossRef CAS.
- M. Geppert-Rybczynska, J. K. Lehmann and A. Heintz, J. Chem. Thermodyn., 2014, 71, 171–181 CrossRef CAS.
- B. P. Mandal, M. Kundu and S. S. Bandyopadhyay, J. Chem. Eng. Data, 2003, 48, 703–707 CrossRef CAS.
- W. Qian, Y. J. Xu, H. Y. Zhu and C. H. Yu, J. Chem. Thermodyn., 2012, 49, 87–94 CrossRef CAS.
- H. Vogel and A. Weiss, Phys. Chem., 1982, 86, 193–198 CAS.
- A. Hernandez, J. A. Trejo, B. E. G. Flores and R. Molnar, Fluid Phase Equilib., 2008, 267, 172–180 CrossRef.
- Y. W. Wang, S. Xu, F. D. Otto and A. E. Mather, Chem. Eng. J., 1992, 48, 31–40 CrossRef CAS.
- B. P. Mandal, M. Kundu and S. S. Bandyopadhyay, J. Chem. Eng. Data, 2005, 50, 352–358 CrossRef CAS.
- A. Samanta and S. S. Bandyopadhyay, Chem. Eng. Sci., 2009, 64, 1185–1194 CrossRef CAS.
- W. C. Sun, C. B. Yong and M. H. Li, Chem. Eng. Sci., 2005, 60, 503–516 CrossRef CAS.
- A. Samanta and S. S. Bandyopadhyay, Chem. Eng. J., 2011, 171, 734–741 CrossRef CAS.
Footnote |
| † Electronic supplementary information (ESI) available: Table S1, reaction scheme for the reactions of CO2 into novel (AMP + APA + H2O) systems Table S2, density and viscosity for (APA + AMP + H2O) at different molar concentrations and temperatures at a pressure of 0.1 MPa. Table S3, excess molar volume, thermal expansion coefficient, viscosity deviation for (APA + AMP + H2O) at different mole fraction and temperature. Table S4, values of ΔH and ΔS as a function of concentration from (298 to 323) K and ΔG against APA mole fraction at 298 K. Table S5, measured Henry's constant of N2O and estimated Henry’s constant of CO2 in (APA + AMP + H2O) at various temperatures as a function of molar concentration at a pressure of 0.1 MPa; Table S6, measured diffusivity of N2O and an estimated diffusivity of CO2 in (APA + AMP + H2O) at various temperatures as a function of molar concentration at a pressure of 0.1 MPa. Fig. S1, comparison between experimental and predicted results of Henry's constant of N2O, HN2O, in aqueous blend of APA and AMP solutions by parity plot. Fig. S2, comparison between experimental and predicted results of N2O diffusivity in aqueous blend of AMP and APA solutions by parity plot. See DOI: 10.1039/c7ra01286a |
|
| This journal is © The Royal Society of Chemistry 2017 |
Click here to see how this site uses Cookies. View our privacy policy here. 
 Open Access Article
 This Open Access Article is licensed under a
  *
*
 represents a combination of bases, whereas
  .
.
 and zwitterion deprotonation is rate-determining, then the rate equation becomes:
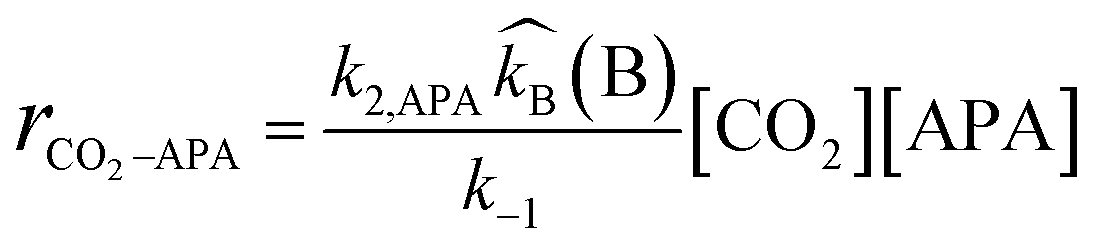

 term is greater than three, then
  is equal to one, and the enhancement factor can be presumed to be a dimensionless Hatta number with
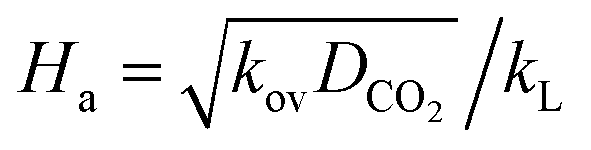

 , T = 298 K;
  , T = 303 K;
  , T = 308 K;
  , T = 313 K;
  , T = 318 K;
  , T = 323 K.
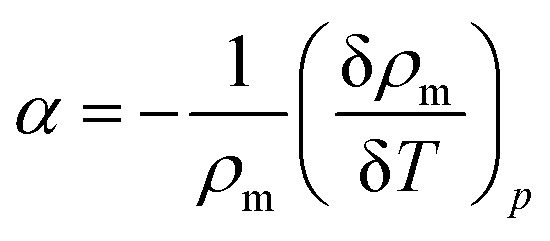
 , T = 298 K;
  , T = 303 K;
  , T = 308 K;
  , T = 313 K;
  , T = 318 K;
  , T = 323 K.
 , T = 298 K;
  , T = 303 K;
  , T = 308 K;
  , T = 313 K;
  , T = 318 K;
  , T = 323 K.